Prometheus
PlanetScale exposes Prometheus-compatible metrics endpoints for scraping metrics about your database branches. This, along with our API-driven service discovery, allow you to automatically get in-depth information about all of the databases in your organization.
In order to collect and store these, you will need to use Prometheus or a Prometheus-compatible metrics engine (such as VictoriaMetrics) that is capable of using the HTTP SD protocol.
Prerequisites
This document assumes we'll be configuring a Prometheus 3.x instance via a configuration file running on our local machine.
If you are using managed Prometheus via AWS, GCP or another provider, you will have to deploy Prometheus to scrape and forward metrics via remote_write, as these services do not support scraping metrics.
Getting Started
First, provision a new PlanetScale Service token in your Organization settings. Make sure to save the ID and token, as they will not be visible after they've been generated.
When that's created, grant the token read_metrics_endpoints permissions and click "Save permissions". Your token should look like the following:

Configuring Prometheus
Now that we have a Service Token, we can add a scrape configuration for your PlanetScale organization. A minimal Prometheus configuration should look like the following:
scrape_configs:
  - job_name: "${ORG}"
    http_sd_configs:
    - url: https://api.planetscale.com/v1/organizations/${ORG}/metrics
      authorization:
        type: "token"
        credentials: "${TOKEN_ID}:${TOKEN}"
      refresh_interval: 10m
Fill in your organization name in the job_name and url, and place the Service Token and ID that we created in the previous step for the credentials.
Save this file to prometheus.yml in your working directory.
Start Prometheus
Run Prometheus pointed at this configuration file:
$ prometheus --config.file=prometheus.yml
By default, Prometheus will listen at 0.0.0.0:9090, which means you can access it in your browser at http://127.0.0.1:9090.
Validating Service Discovery
First, let's make sure that Prometheus is properly querying the PlanetScale API for the right branches. If you go to http://127.0.0.1:9090/service-discovery you should see the job that we created earlier, with all of your branches listed under Discovered labels. In this example, our organization is called nick, so it looks like the following:

Here, I have two branches that have been discovered. I can confirm that this matches what's in my organization:
$ pscale branch list test --org nick
  ID             NAME         PARENT BRANCH   REGION    PRODUCTION   SAFE MIGRATIONS   READY   CREATED AT    UPDATED AT
 -------------- ------------ --------------- --------- ------------ ----------------- ------- ------------- ---------------
  7wxuxewx4l0p   main         n/a             us-east   Yes          Yes               Yes     2 years ago   7 minutes ago
  6o0rr27785fl   partitions   main            us-east   No           No                Yes     1 month ago   9 minutes ago
Now, if I go to my list of targets I should see each branch as an Endpoint:
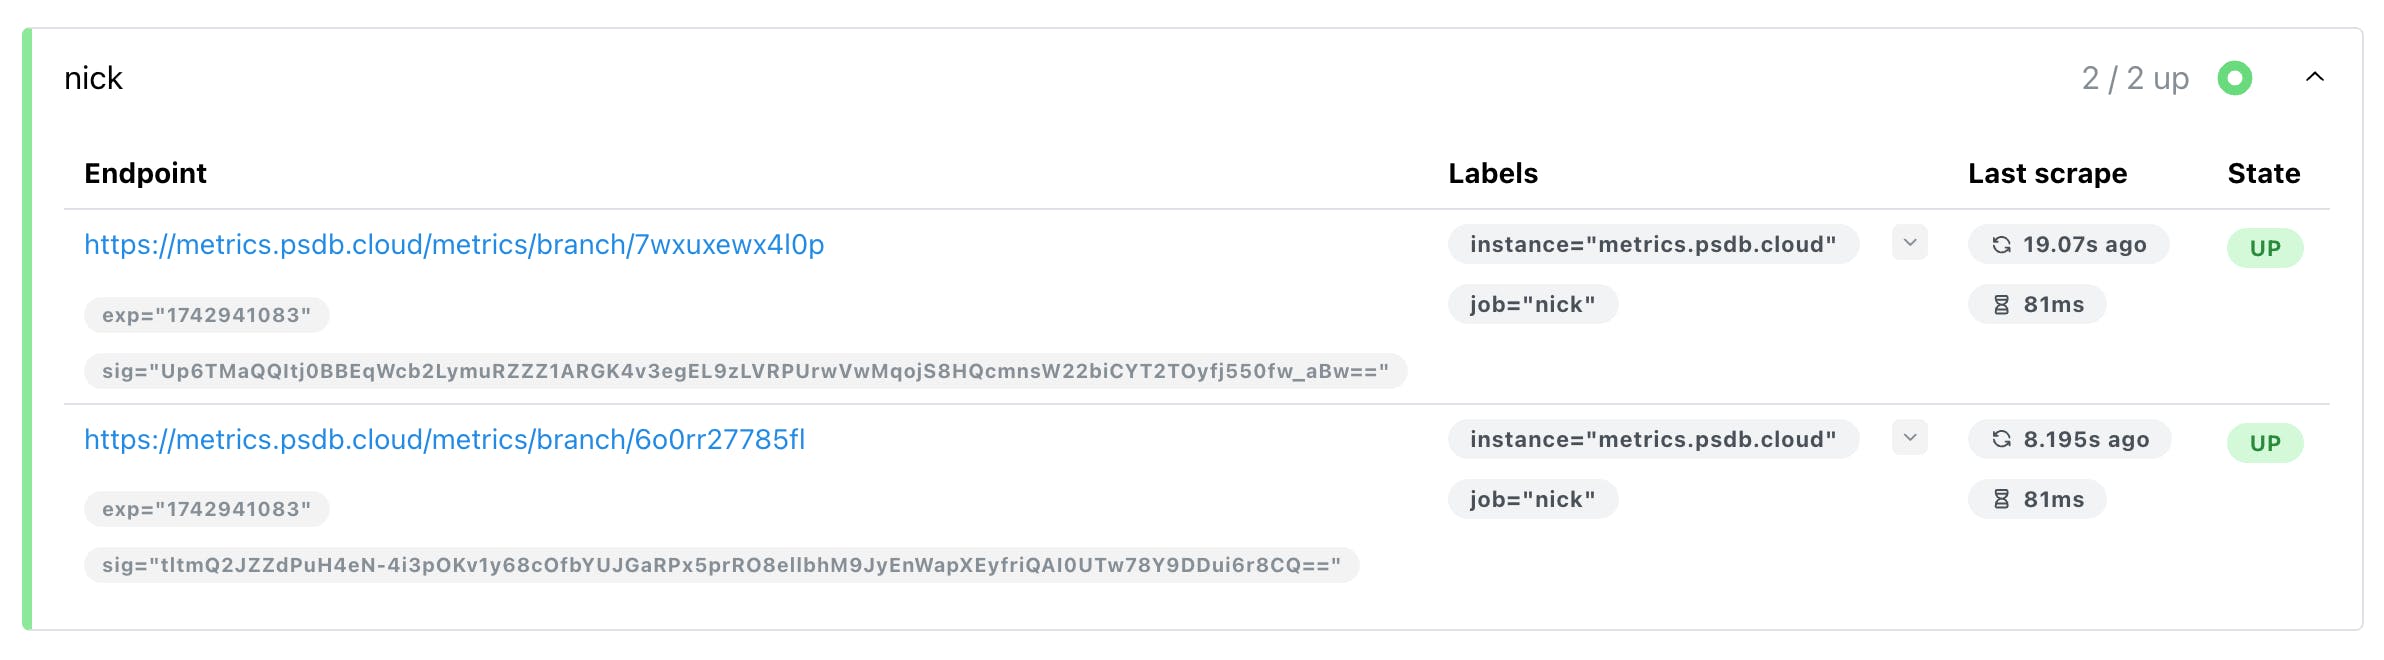
This screenshot shows that they're being correctly scraped, and I can start to query my Prometheus instance.
Querying Prometheus
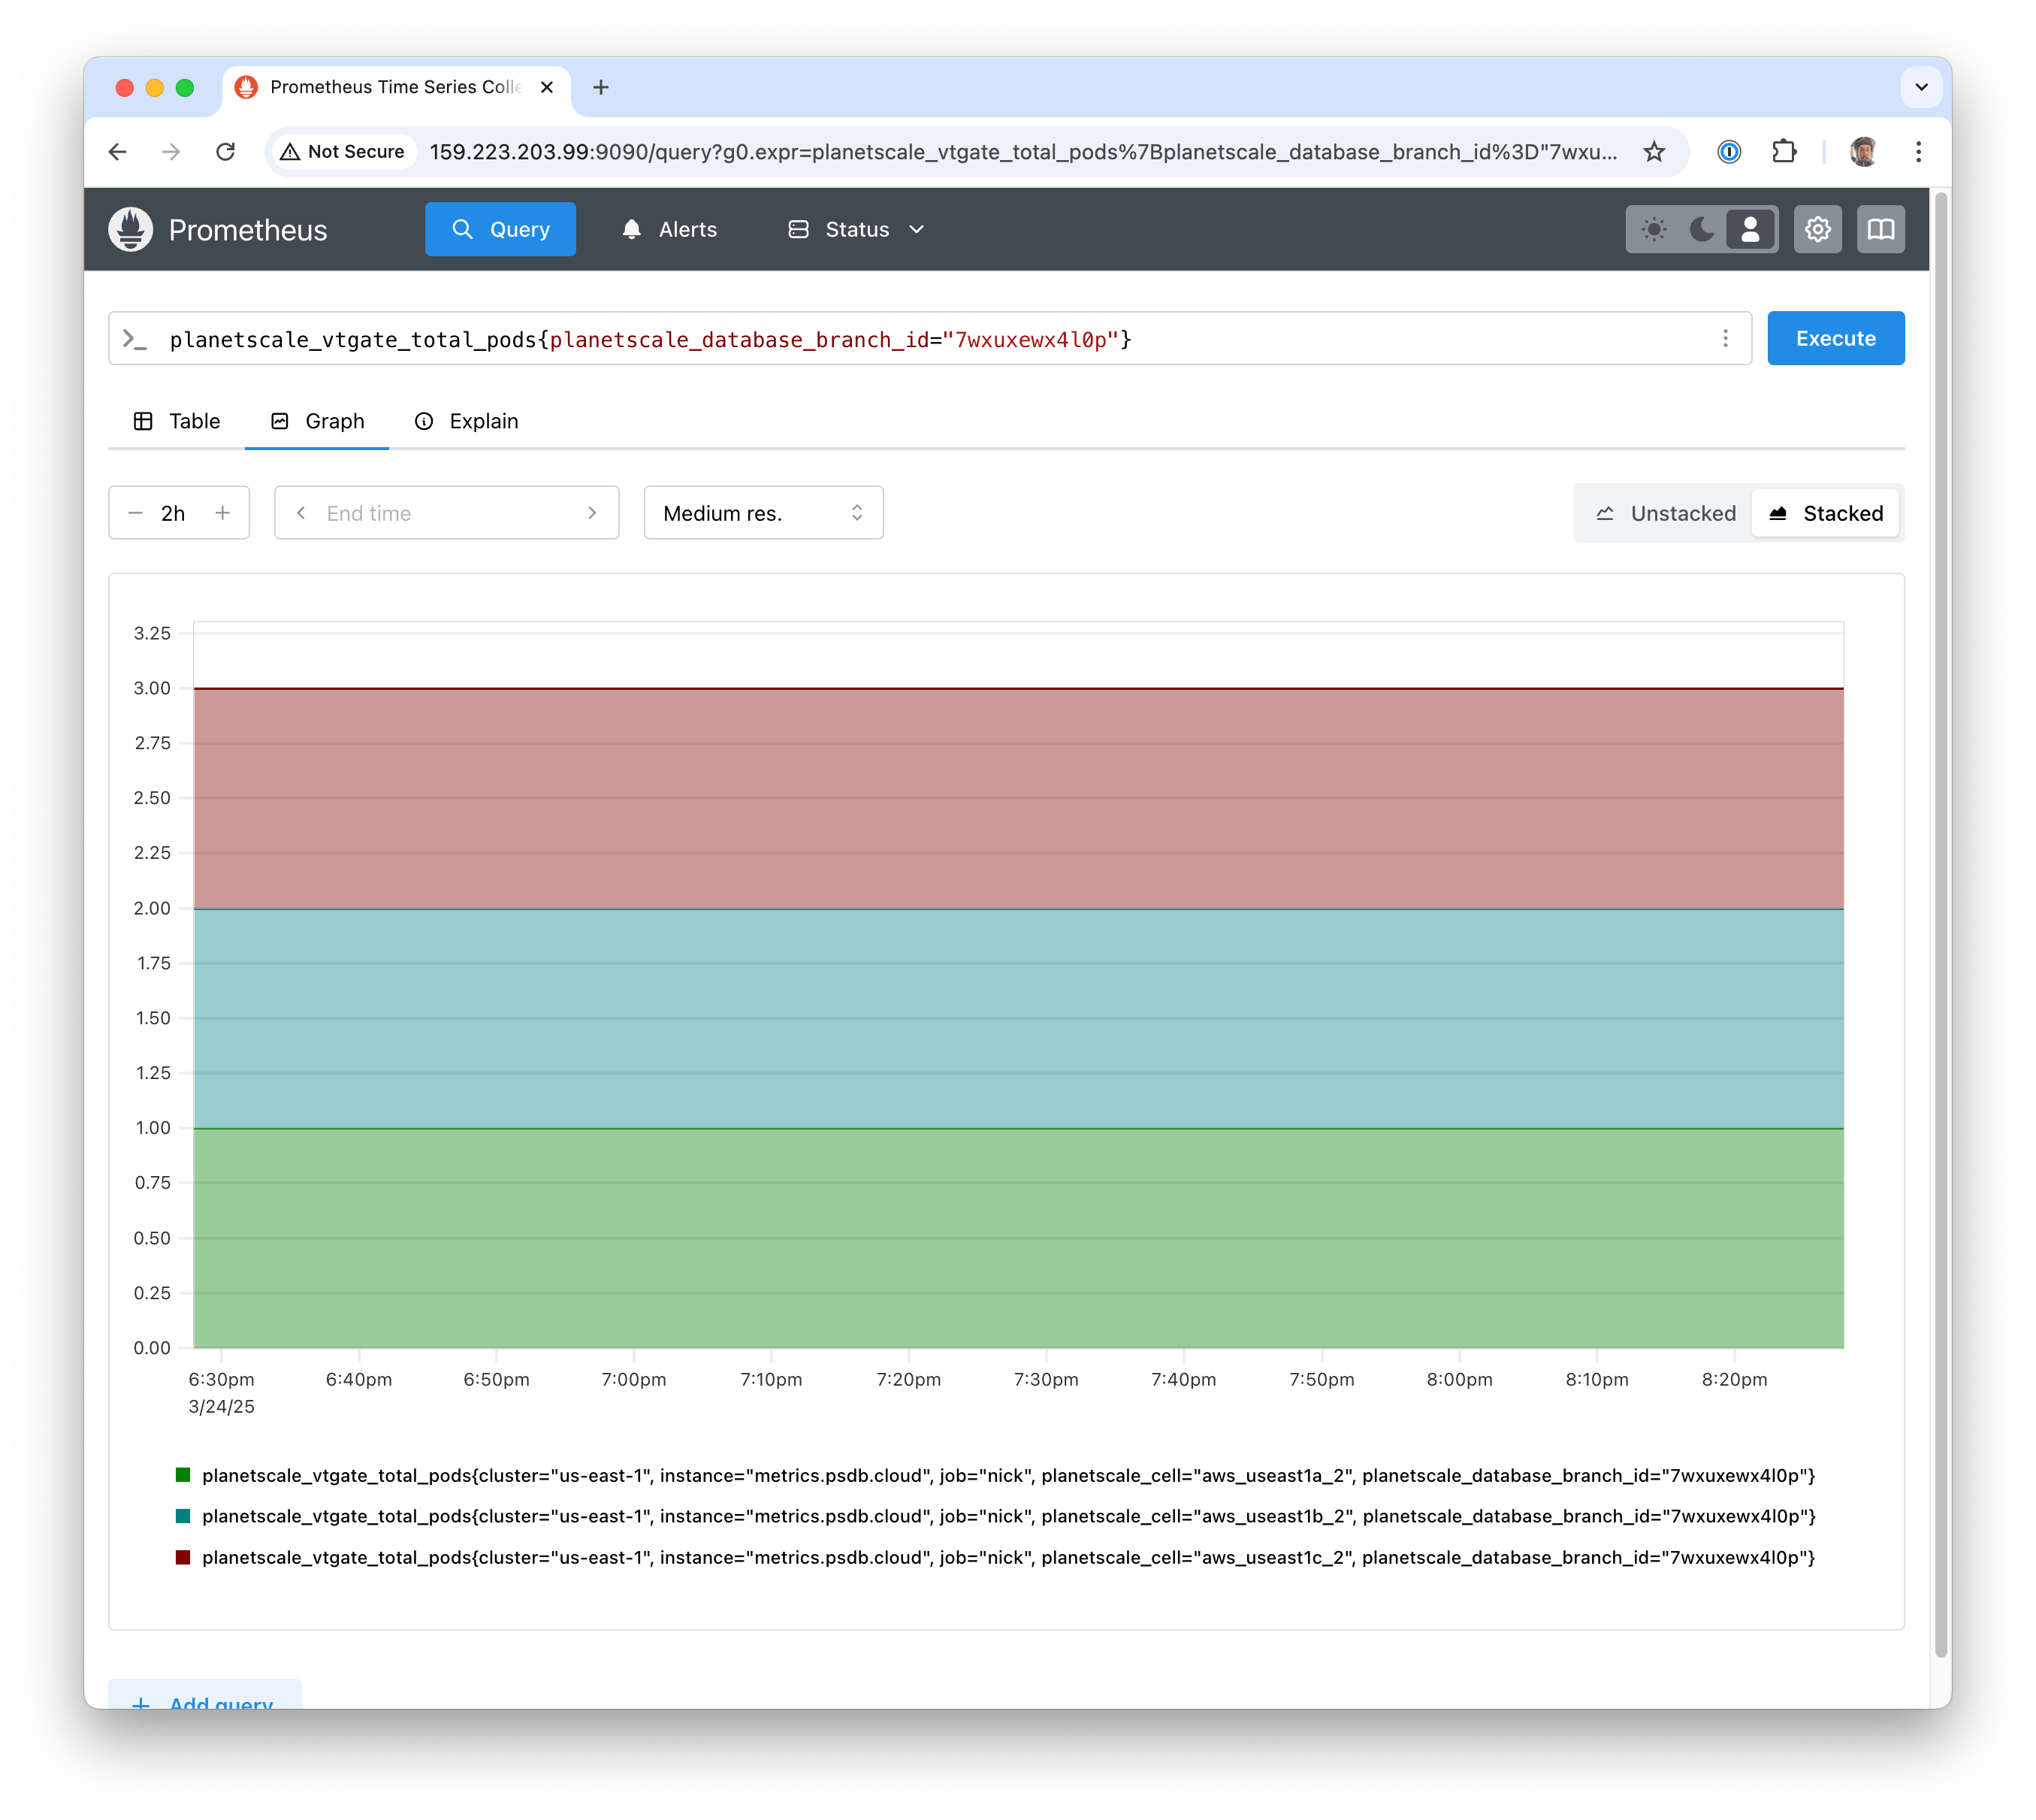
Now that we're collecting metrics for my branches, our reference guide has a list of everything that we export. If I want to see how many vtgate pods are running per AZ for my branch, I can query:
planetscale_vtgate_total_pods{planetscale_database_branch_id="7wxuxewx4l0p"}
Make sure the graph is set to stacked, and it should look like this:
Next Steps
If you keep this Prometheus instance running, it will collect metrics every 30 seconds, and refresh the list of branches every 10 minutes.
For more information, see:
- Metrics reference for a list of metrics we expose
- Grafana and Prometheus tutorial for using PlanetScale's provided dashboard to visualize these metrics in Grafana.
- Sending metrics to New Relic tutorial for using Prometheus to forward metrics to New Relic.
Need help?
Get help from the PlanetScale Support team, or join our GitHub discussion board to see how others are using PlanetScale.