Overview
In this tutorial, we’ll assume that you have a Datadog Agent Version 7 running. For more information on what the Datadog Agent is and how to install it, start with the Datadog Agent documentation. For the purposes of this guide, we’ll be using a Datadog agent running with the recommended installation steps on a Linux system.Prerequisites
You’ll need a working Datadog agent and access to add a Custom Agent Check to that instance. This may requireroot or sudo access on the machine running the Datadog agent.
You’ll also need a Service token in your Organization, with the read_metrics_endpoints permission granted.
Adding the Plugin to the Datadog Agent
Go to https://github.com/planetscale/planetscale-datadog, which is the repository that has our custom OpenMetrics Check. Place the uneditedplanetscale.py in the checks.d directory of your Datadog Agent.
- On Linux, that is
/etc/datadog-agent/checks.d/ - On macOS, that is
/opt/datadog-agent/etc/checks.d/
dd-agent user:
dd-agent user and group in the /etc/datadog-agent/checks.d directory.
If you’re on macOS, it will depend on whether you installed the agent as a ‘Single User Agent’ or a ‘Systemwide Agent’. If you picked Single User, there should be no additional permission changes needed. If you installed it as a Systemwide agent, make sure the user and group you installed the agent with as ownership of the file.
Configuring the Datadog Agent
Now that we have the plugin installed, we need to configure it. In theconf.d directory of the Datadog agent take the conf.d/planetscale.yaml.example file and edit it with your organization name and Service Token information. It should look like this:
"nick" PlanetScale organization, only collect the planetscale_vtgate_queries_duration metric, which it will rename vtgate_query_duration and put it inside of the planetscale namespace.
Collecting all metrics
If you want to collect all available PlanetScale metrics instead of specifying individual metrics, you can use a wildcard pattern:'.*' in the metrics list tells the Datadog agent to scrape all metrics exposed by PlanetScale. This is useful when you want comprehensive monitoring without manually maintaining a list of specific metrics.
Save the file at planetscale.yaml, making sure to double check permissions:
Restart the Datadog Agent
Now that this is configured and installed, restart the Agent:Validating the PlanetScale Plugin
Now that the Datadog Agent is running the PlanetScale plugin, metrics should start flowing into Datadog within a couple of minutes. To validate, we can ask the Datadog Agent:2025-04-02 23:56:32 UTC and produced 77 Histogram Buckets.
Adding Metrics
In our earlier configuration, we only added one metric. For a complete list of what PlanetScale exposes, please take a look at our Metrics Reference Documentation. Note that the Datadog agent normalizes metrics with certain suffixes starting in v7.32.0:Starting in Datadog Agent v7.32.0, in adherence to the OpenMetrics specification standard, counter names ending in _total must be specified without the _total suffix. For example, to collect promhttp_metric_handler_requests_total, specify the metric name promhttp_metric_handler_requests. This submits to Datadog the metric name appended with .count, promhttp_metric_handler_requests.count.This means that to scrape a metric such as
planetscale_mysql_bytes_received_total, you would configure the Datadog agent for planetscale_mysql_bytes_received.
If I want to collect additional metrics, I can add them to the list:
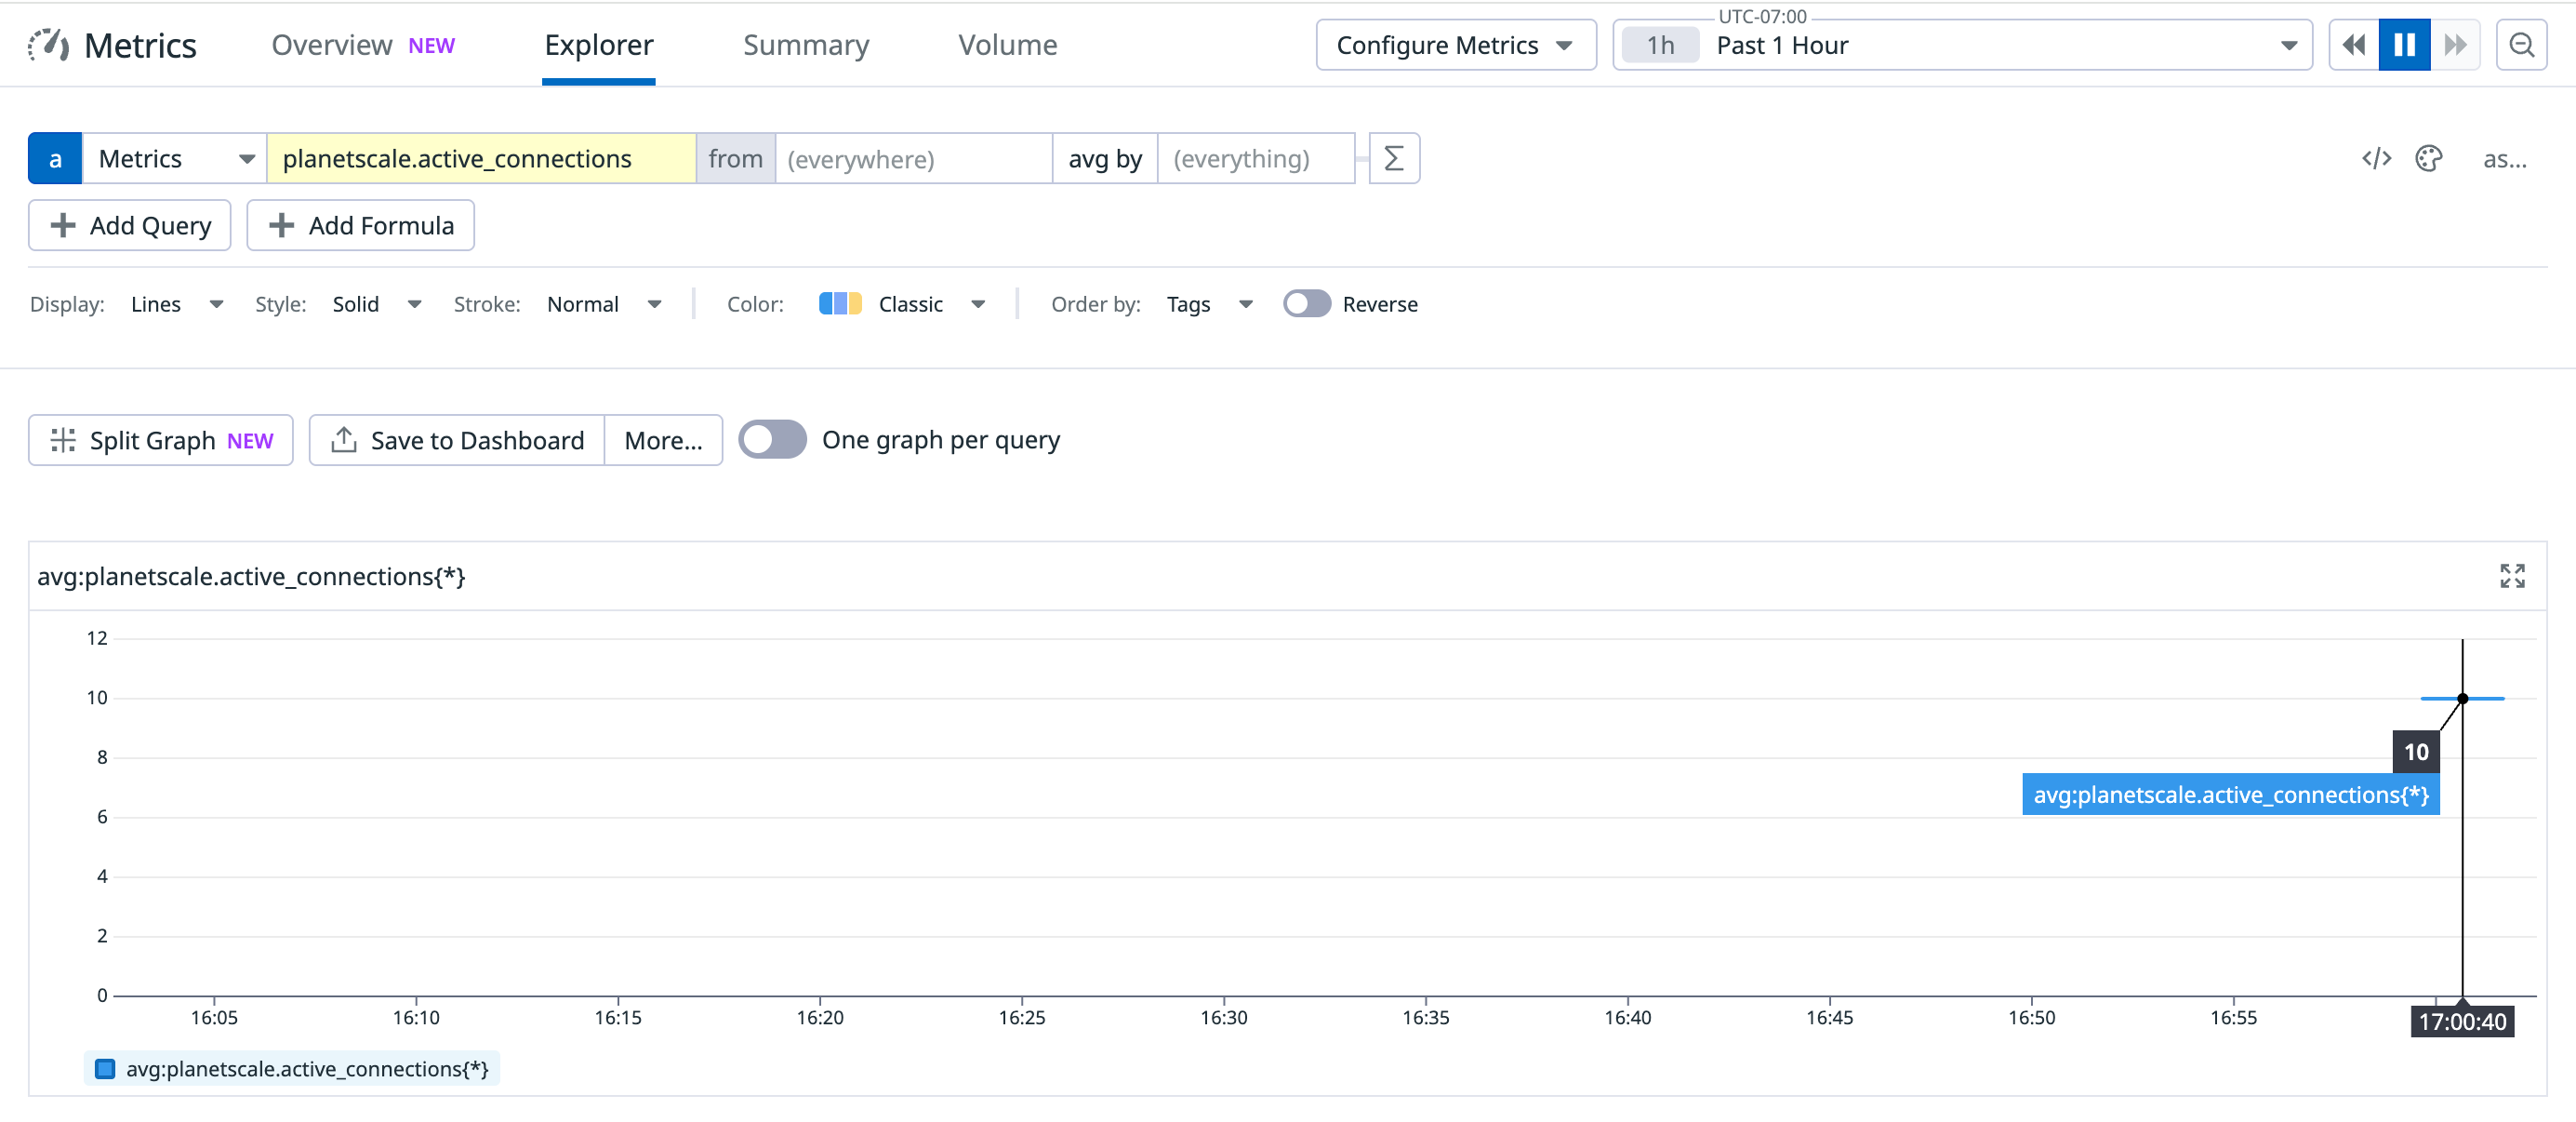
planetscale.active_connections metric: