Introduction
This guide requires that you’ve set up a Prometheus instance from our documentation. If you’re already running Grafana in production and you’re just looking for our standard dashboard template, you can find it on GitHub.Install Grafana
Grafana’s installation documentation contains information for their supported platforms. For this guide, we’ll be setting this up locally on a macOS machine. If you’re using a hosted Grafana option such as Grafana Cloud or AWS Managed Grafana you can skip this step. On macOS, Grafana is availabile via homebrew, and I can install it with:http://localhost:3000/ and I should see the Grafana welcome page:
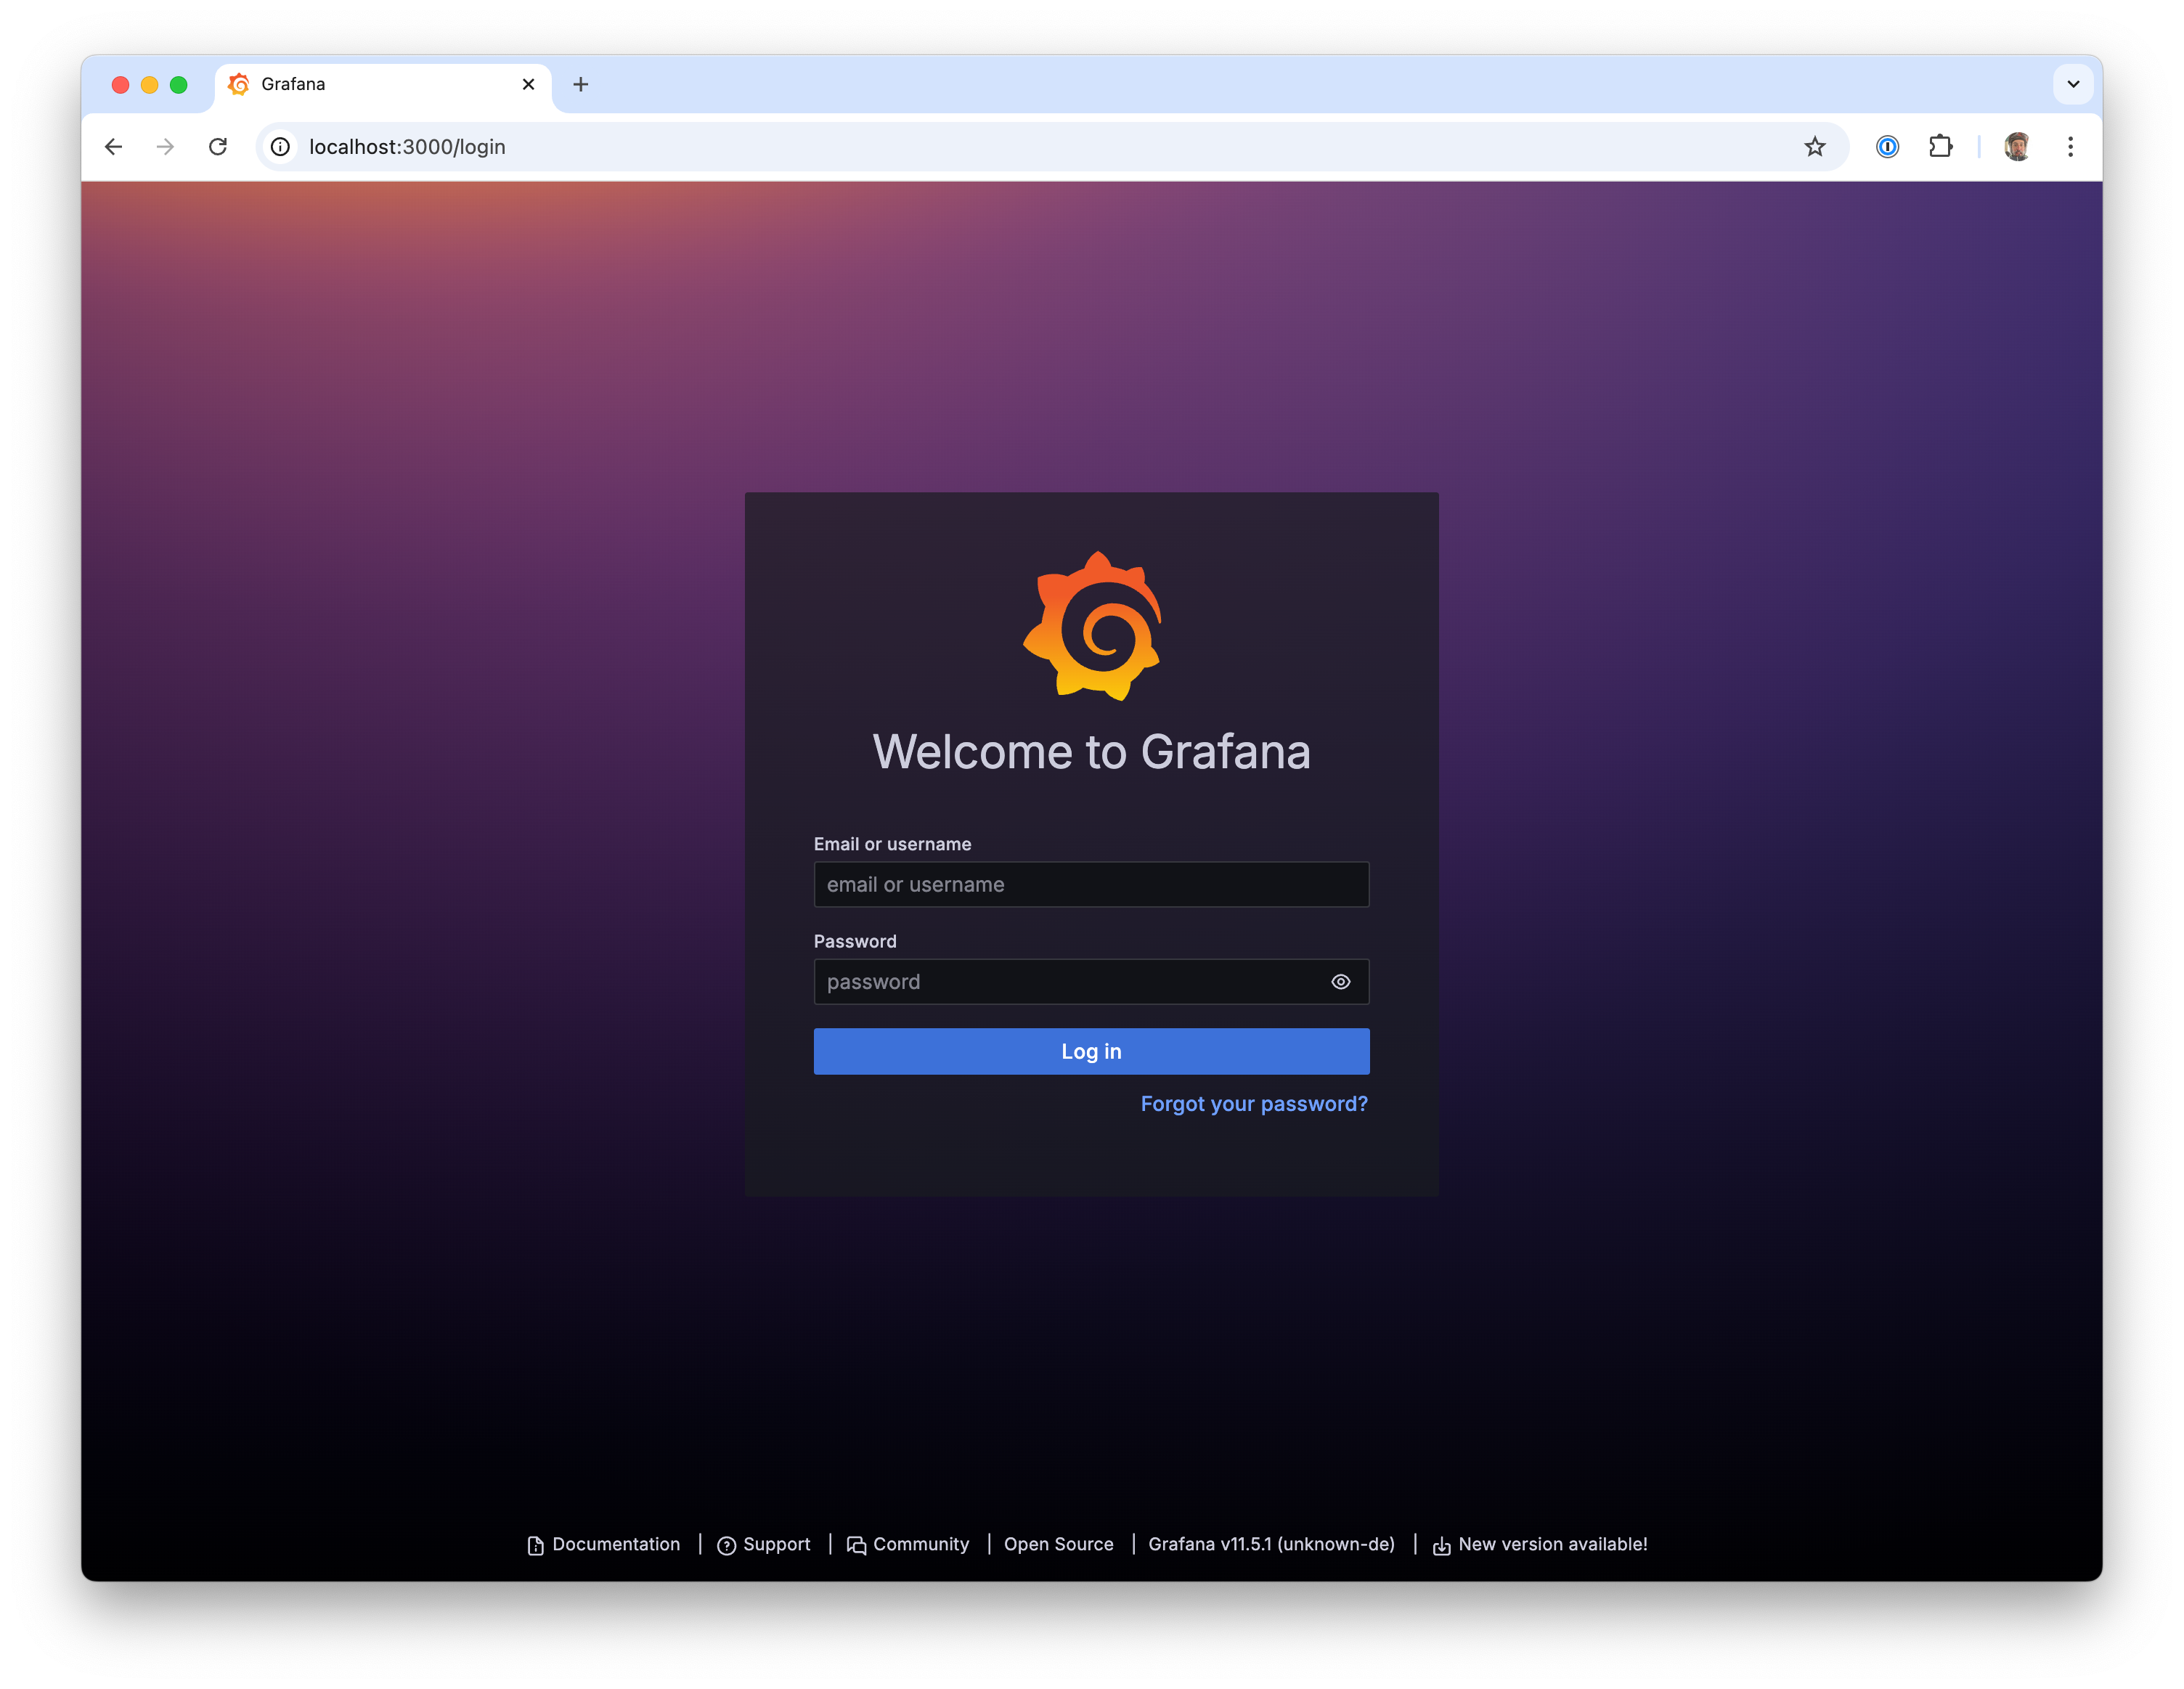
admin and admin. Grafana will ask you to change the password the first time you log in, please pick something more secure than admin.
Adding a Prometheus Endpoint
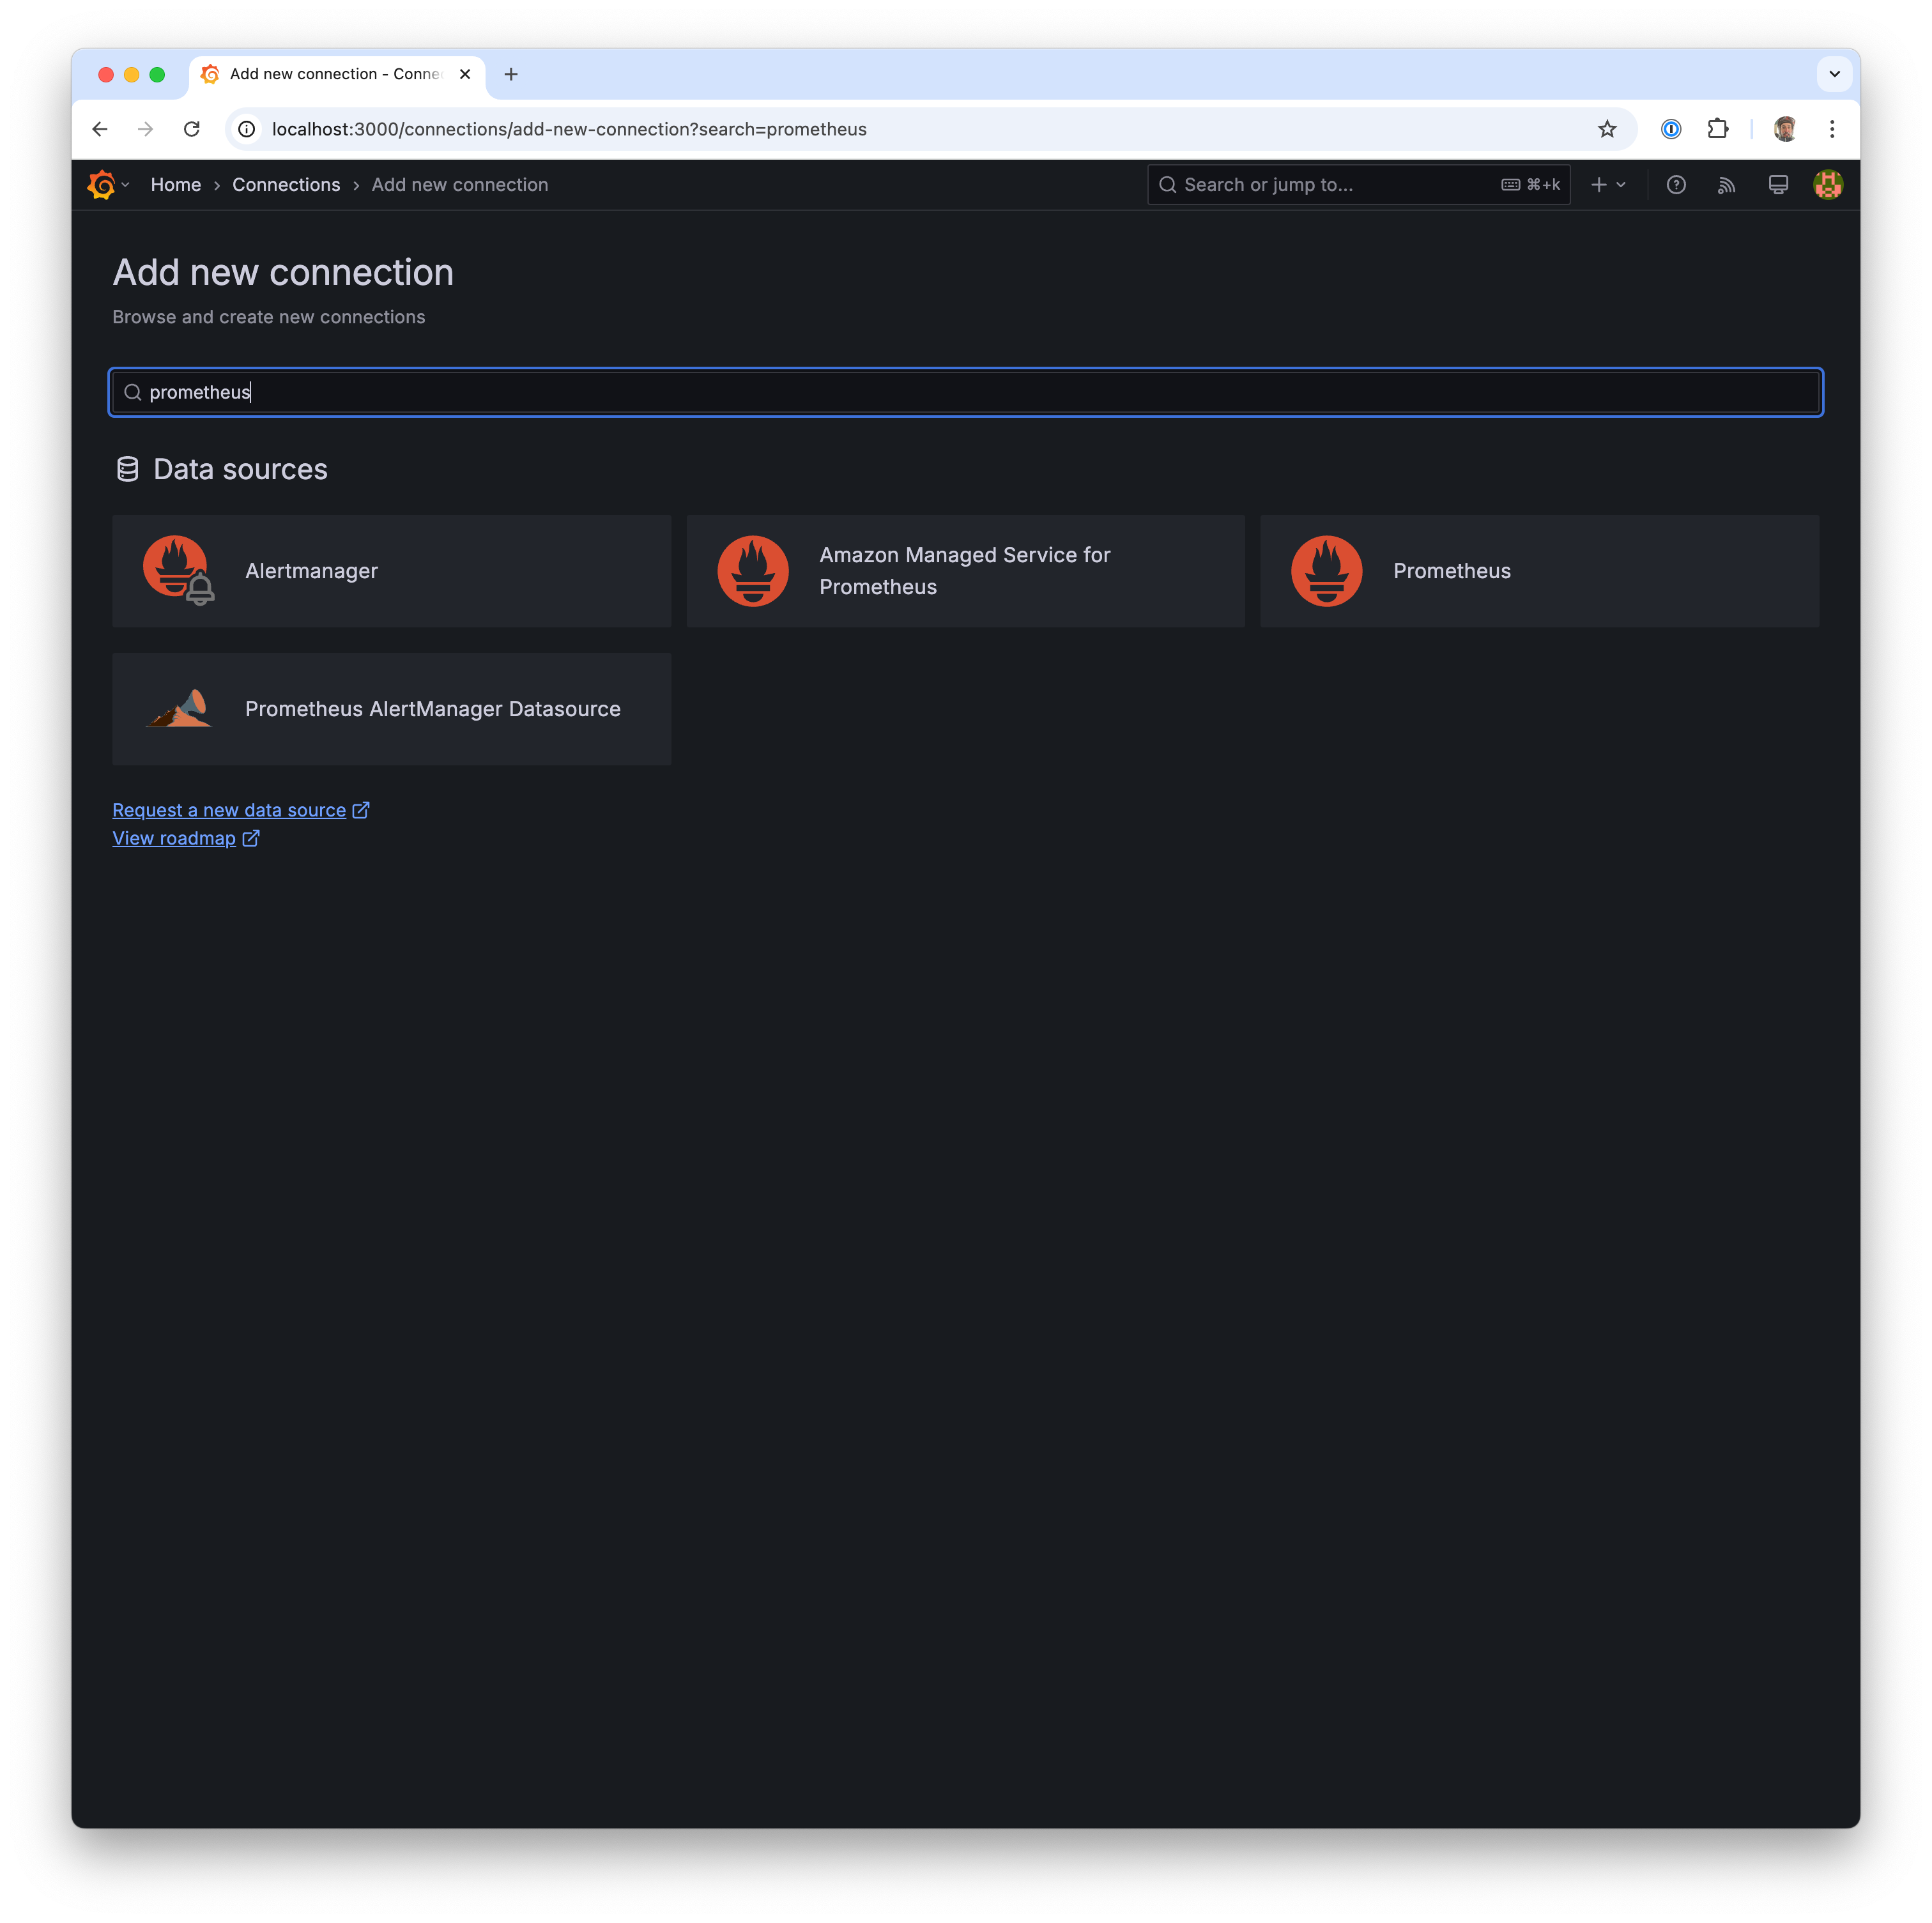
You can skip this step as well if you’re already running a managed Prometheus or have added your datasource to Grafana already. If you’re running Prometheus locally, you’ll need to add that as a datasource. To do this:
Now, you should look see a page that looks like this:
- Name: “PlanetScale”
- Prometheus server URL:
http://localhost:9090/
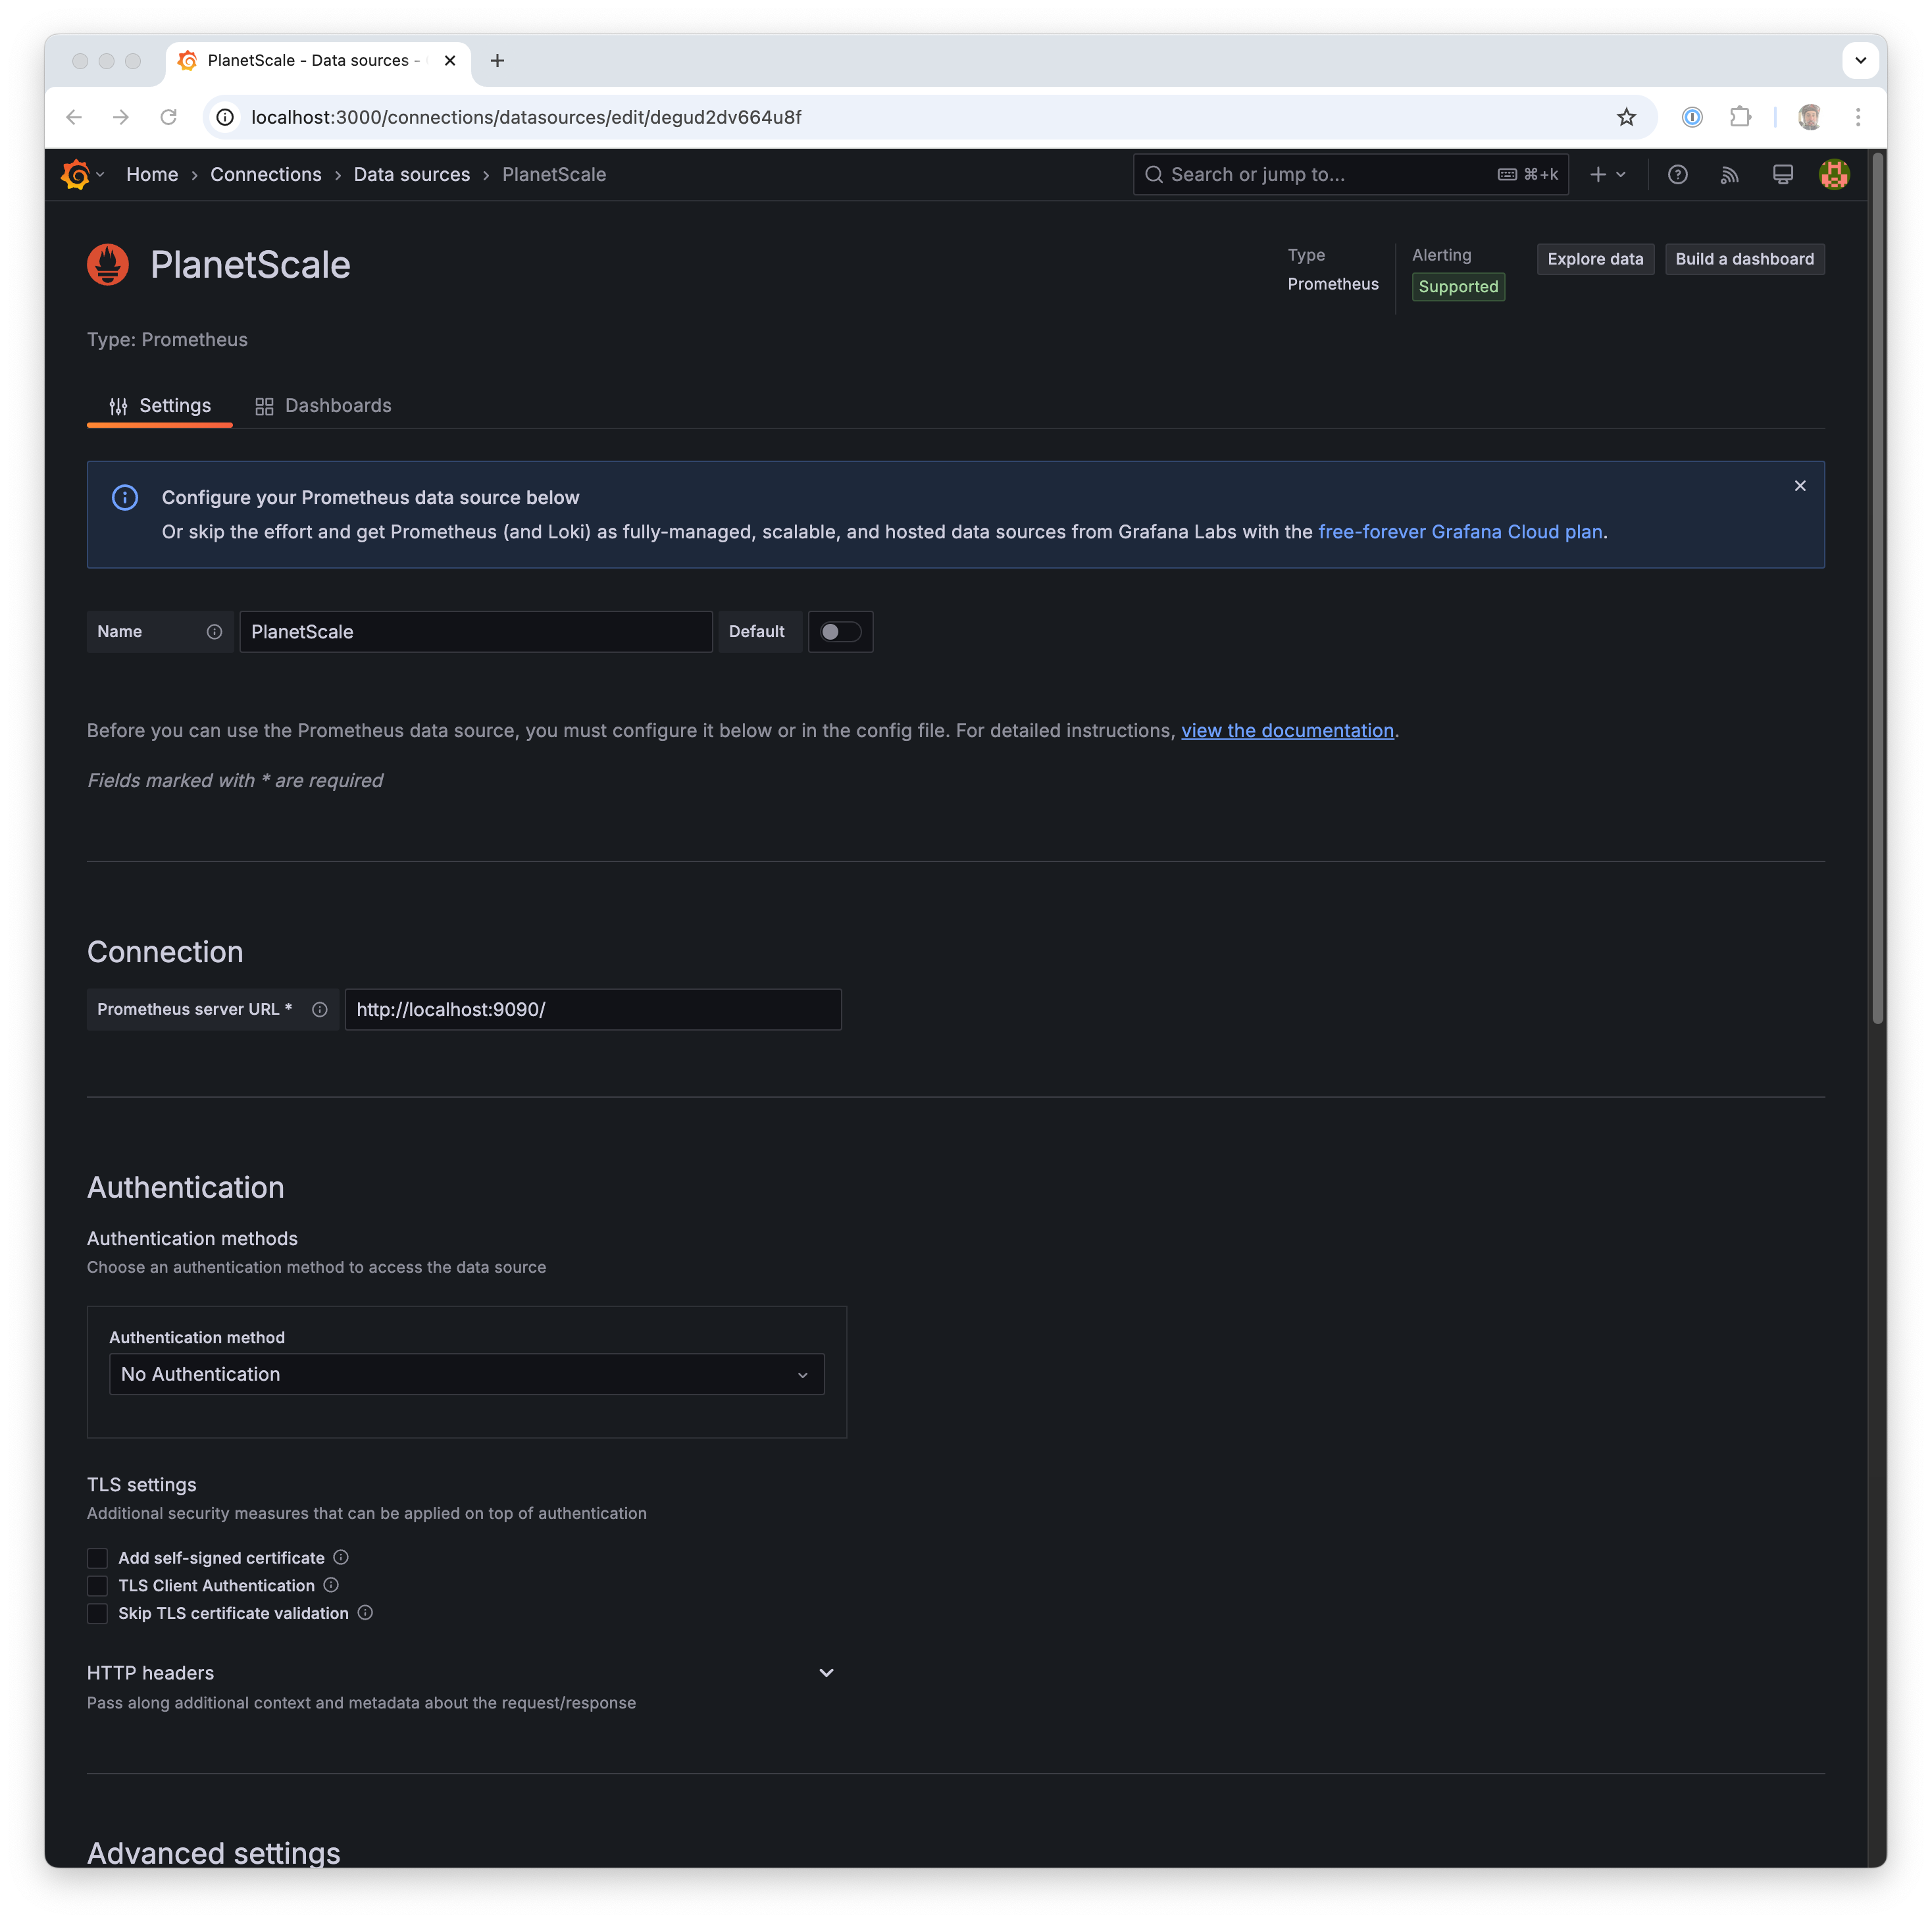
1m.
Finally, scroll to the bottom and click “Save & test”.
Import the PlanetScale Dashboard
Now that we have our datasource added, let’s import the PlanetScale Dashboard. This is a starter dashboard that PlanetScale has produced which shows an overview of your branch with the metrics that we expose. From the Grafana homepage, go to the top left menu and pick “Dashboards”. In the top right, click “New” and then Import”: PlanetScale maintains the latest version of the dashboard located here: https://github.com/planetscale/grafana-dashboard/blob/main/overview.json Download this file to your computer, and then click “Upload dashboard JSON file”. Find the JSON file you downloaded in the previous step, and configure it with the Prometheus datasource that we added in an earlier: