Overview
This in-dashboard tool allows you to identify queries that are running too often, too long, returning too much data, producing errors, and more. You can scroll through the performance graph to detect the time that a query was impacted and, if applicable, the Deploy Request that affected it. You can also see a list of all queries performed on your database in the last 24 hours. For further analysis, you can sort these by metrics like amount of rows read, time per query, and more. With this built-in tool, you can easily diagnose issues with your queries, allowing you to optimize individual queries without much digging. We will also alert you of any active issues your database may be having in the Anomalies page. This feature flags queries that are running significantly slower than expected. Insights will also automatically recommend schema changes to improve database performance, reduce memory and storage, and improve your schema based on production database traffic. Read more about the supported recommendations and how to use them in the schema recommendations documentation.Insights page overview
To view Insights for your database, head to the PlanetScale dashboard, select your database, and click the “Insights” tab. The dropdown on the top left lets you select which branch you want to analyze. You can also choose which servers you want to view insights for: primary or replicas.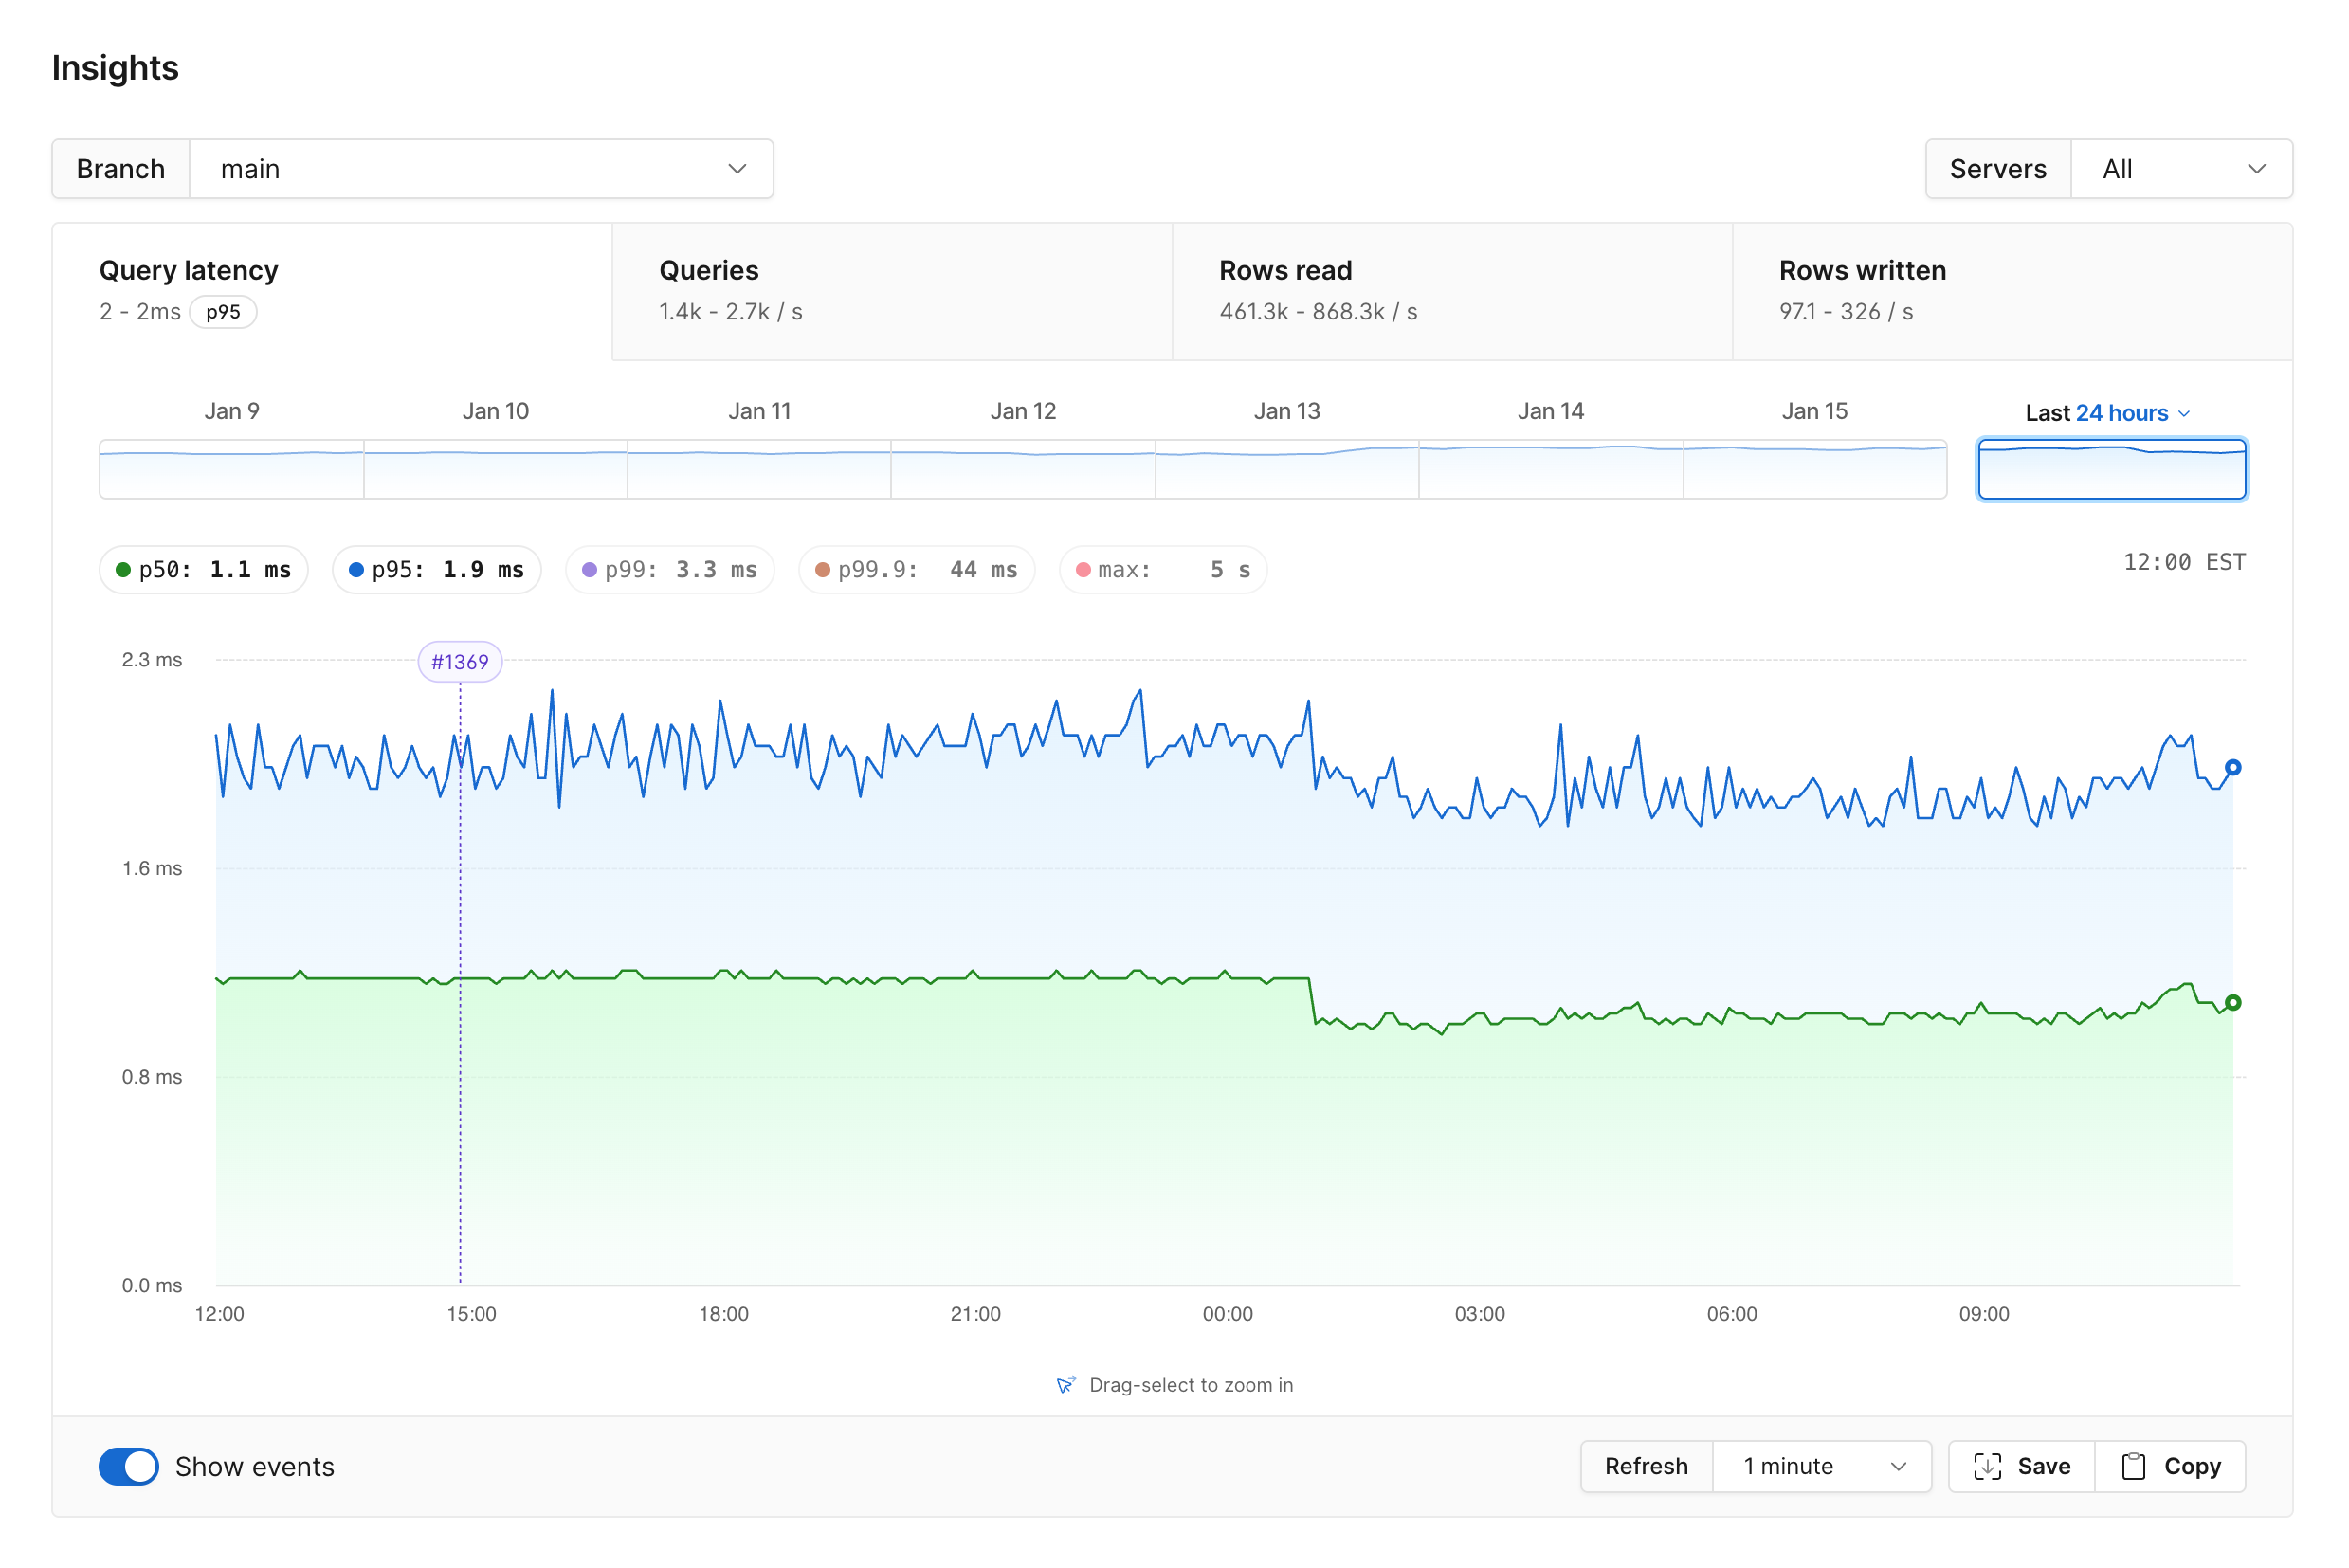
Queries overview table
The table underneath the graph shows all queries performed on your database in the selected timeframe (last 24 hours by default). For more information about how to read and interpret this data, see the Queries overview section.Insights graphs
Once you have selected the branch and server you want to analyze, you can begin exploring the insights for them in the following sections:Query latency
Queries
Rows read
Rows written
Any query metric
Query latency
The default graph depicts your database’s query latency in milliseconds over the last 24 hours. By default, the graph contains two line charts showingp50 and p95 latency. This means 50% and 95% of requests, respectively, completed faster than the time listed. You can also click on the p99 and p99.9 pills to toggle those on, or click p50 or p95 to toggle those off.
Queries
The Queries graph displays insights about all active running queries in your database. The graph displays total queries per second against the specified time period.Rows read
The Rows read graph displays the total number of rows read per second across the selected time period.Rows written
The Rows written graph displays the total number of rows written per second across the selected time period.Any query metric
The last graph tab plots any single query metric you choose across the selected time period. This tab is named after the metric you have selected, so it reads “Total time” or “Bytes returned” rather than a fixed title. To graph a metric:- Click the chevron on the last graph tab to open the metric list.
- Select a metric. The graph redraws with that metric plotted over the time period you already have selected.
Queries overview
The table underneath the graph shows queries performed on your database in the selected timeframe (last 24 hours by default).The queries table does not show following statements types:
BEGIN, COMMIT, RELEASE, ROLLBACK, SAVEPOINT, SAVEPOINT_ROLLBACK, SET.:v1. This is because we consider the actual data private and normalize it away.
You have the option to opt in to complete query collection to see the full SQL statements.
- A shard icon indicates that the query requires execution across multiple shards.
- An exclamation point icon indicates that the query is not currently using an index and requires a full table scan.
The queries table may also show internal PlanetScale queries that are used to monitor the state of your cluster.
Available query statistics
You can customize the metrics that show up on the Queries list by selecting columns in the “View options” dropdown.- Query - The query that was run.
- Keyspace — The default keyspace associated with the connection that issued the query, if set.
- Qualified table — The table(s) referenced in the query, in the format
keyspace_name.table_name. - Table keyspace — The keyspace(s) associated with the tables referenced in the query. (This may differ from the connection keyspace.)
- Table — The table(s) being queried or modified.
- % of runtime — The percent of the total runtime the query pattern is responsible for (query pattern time divided by the cumulative time of all query patterns on your database).
- Count — The number of times this query has run.
- Total time (s) — The total time the query has run in seconds.
p50latency — Thep50latency for the query in milliseconds. This means that 50% of requests completed faster than the time listed.p99latency — Thep99latency for the query in milliseconds. This means that 99% of requests completed faster than the time listed.- Max latency — The maximum observed latency for the query in milliseconds.
- Rows returned — The total number of rows fetched by a
SELECTstatement. This includes all times the query has run in the displayed time frame. - Rows read — The total number of rows read. This includes all times the query has run in the displayed time frame.
- Rows read/rows returned — The result of dividing total rows read by rows returned in a query. A high number can indicate that your database is reading unnecessary rows, and the query may be improved by adding an index.
- Rows affected — The total number of rows modified by an
INSERT,UPDATE, orDELETEstatement. This includes all times the query has run in the displayed time frame. - Bytes returned — The total number of bytes returned to clients in query responses. This includes all times the query has run in the displayed time frame.
- Bytes returned per query — The average number of bytes returned to clients per query execution.
- Max bytes returned per query — The largest response, in bytes, returned by any single execution of the query.
- Bytes received — The total number of bytes received from clients, which includes the statement and any parameters sent with it. This includes all times the query has run in the displayed time frame.
- Bytes received per query — The average number of bytes received from clients per query execution.
- Max bytes received per query — The largest request, in bytes, received from a client for any single execution of the query.
- Tablet calls per query (only visible for databases with at least one sharded keyspace) — The average number of VTTablet calls/queries for each execution of the query pattern. Calculated as the sum of VTTablet calls divided by the number of queries issued by the client in the selected time period. Query patterns where this value is equal to the number of shards are known as “scatter gather queries”.
- Last run — The last time a query was run.
Show sparklines is selected, numeric columns in the queries table show a time series graph of the value within the selected time period. Click a sparkline to open that query pattern’s deep dive with the same metric graphed full size.
Query filtering
The search bar above the table allows you to filter queries as needed. You can filter for query SQL, keyspace (connection keyspace, and/or keyspace of tables referenced by the query), table name, query count, query latency, multisharded queries, index name, and if the query was indexed. Click on the? next to the search bar for the full list of search syntax.
Query deep dive
Clicking on a query in the Queries list will open a new page with more information about that query. You’ll first see the full query pattern, which displays the query with data normalized away. This query may run several times with different values, which Insights combines into a single query pattern. You can display an LLM-generated summary of the query by clicking “Summarize query.” You can also display a queryEXPLAIN plan by clicking “Show explain plan”, which generates the execution plan for the selected query. You may have to fill in some sample values designated with placeholders like :v1. We use placeholders in the patterns both so you can look at whole patterns at once and so the literal values remain private.
Note, if you’re viewing the EXPLAIN plan on a production branch, this button will be disabled unless you enable production web console access in your database Settings page.
If you’d like to further interact with the query, click “Open query in web console”, and you’ll be taken to your in-dashboard web console, where you can run the EXPLAIN plan.
Additional query information
Beneath the query pattern is a graph with more information about the query. The set of available metrics/tabs include: Query latency, Queries, Rows read, Rows written, Errors and Indexes, along with a final tab that graphs any query metric you select. A Vindexes tab is also available for queries against a sharded keyspace. The Indexes graph (which is not shown on the database-level page) shows the percentage of queries that used each of the listed indexes in each time bucket. (Currently onlySELECT queries show index usage information.) The Vindexes graph (also not shown on the database-level page) shows the percentage of queries that used each of the listed vindexes in each time bucket.
Beneath the time series graphs you will see summary statistics for the query pattern. These data are scoped to the same time period shown in the main query pattern graphs. The available metrics have the same definitions as the query statistics listed in the main insights page.
SELECT queries include a horizontal bar graph that shows the cumulative usage of each index over the complete time period shown in the main query pattern graphs. Additionally, for all queries against a sharded keyspace, another horizontal bar graph shows the cumulative percentage of queries that used each vindex over the time period.
To change the time period reflected in the graphs and summary statistics, click and drag to restrict the time window, or click on one of the day icons above the graph to select a different day.
Notable queries
Underneath the graph, you’ll see a table with more information about notable instances of the query, which are defined as queries that took longer than 1s, read more than 10,000 rows, or produced an error. If any of the selected queries have query tags attached, you’ll see the key-value pairs in the table underTags. See Query tags for how to add tags to your queries.
The table also surfaces when the query started, rows returned, rows read, rows affected, the time it took the query to run (in ms), and the user associated with the query.
Complete query collection
If you would prefer to view the raw query data using Insights, you can enable this option in your database settings page. In the dashboard, select your database, click “Settings”, scroll down until you see “Complete query collection”, and click “Enable” to opt in. With this enabled, Insights will gather the complete raw SQL statements and display them when a query deep dive is selected and in theEXPLAIN plan. For example, if you select a query from the table on the Insights page, the query pattern and the selected queries below it will display the full query.
Enabling complete query collection is beneficial when performance varies significantly within the same query pattern, and you need to see the full SQL statement, without placeholders, to identify the correct source of the performance issue.
However, full queries may contain personally identifiable information, so it’s important to consider this before opting in to the feature. Because of this, only Organization Administrators can choose to opt a database into complete query collection. Please read our Privacy Policy for more information on how we collect, process, and disclose your personally identifiable information.