Overview
Usage charges are scoped to each database, which you can find all together in the billing section of your Organization. Each plan is further broken down in the PlanetScale plans documentation.We use gibibytes, otherwise known as binary gigabytes, to calculate storage and usage limits. For reference, 1 binary gigabyte is equivalent to 2^30 bytes.
Organization usage and billing page
Each organization has its own billing page available for administrators, from which you can:- View your current and previous usage per database
- Enter/update your credit card information
- Activate coupons
- Add/update your business address, Vat ID, and other information shown on invoices
- Download current and previous invoices
Go to your PlanetScale dashboard
PlanetScale invoice details
Invoices provide line items for both usage and discounts received. Depending on the configuration of your database and the features you use, you may see line items for:- Your primary database branch
- Development branch usage
- Storage usage per GB (for non-Metal databases)
- Read-only region nodes and storage (for Vitess databases)
- Prorated discounts, if the branch existed for a smaller time period than the billing period
Download an invoice
To download an invoice, go to your billing page (Organization > Settings > Billing).
You’ll see a table of current and previous monthly invoices. You can download an invoice by month by clicking the “Download” button. This will send you to a Stripe invoice page, where you’ll have the option to download the complete invoice in PDF format, see invoice details, or download your receipt.
To see more details about your billing from the PlanetScale dashboard, click the “View details” button on the Billing page next to the month you want to view. This will show you an overview of the charges for all of the databases in your organization.
Payment methods
All plans require that your organization has a valid payment method on file. You can use a debit or credit card, but we do not accept pre-paid cards. It’s possible to use the same card for multiple organizations, but only after the card has been used to successfully pay for a database in the first organization.Spend management
You have the option to set spend alerts from your organization’s billing page. Once on the billing page, click the checkbox on the right next to “Enable spend alerts”, type in the max budget, and click “Save”. Organization administrators will receive an email when the organization hits 75% and 100% of its maximum monthly spend.Using coupons
You can redeem a coupon in the PlanetScale dashboard. To redeem a coupon, you must first enter your credit card information. Once you have a credit card on file, go to your Organization Settings page, click “Billing”, click “Redeem a coupon” on the right, enter your coupon, and click “Redeem coupon”.You can only have one active coupon at a time. Coupons are not stackable.
You may incur additional costs if your usage continues beyond the period, dollar amount, or any other metrics specified in the coupon terms. Additional costs will be charged to your card on file. If you have any questions about the terms of the coupon, please reach out to our Support team.
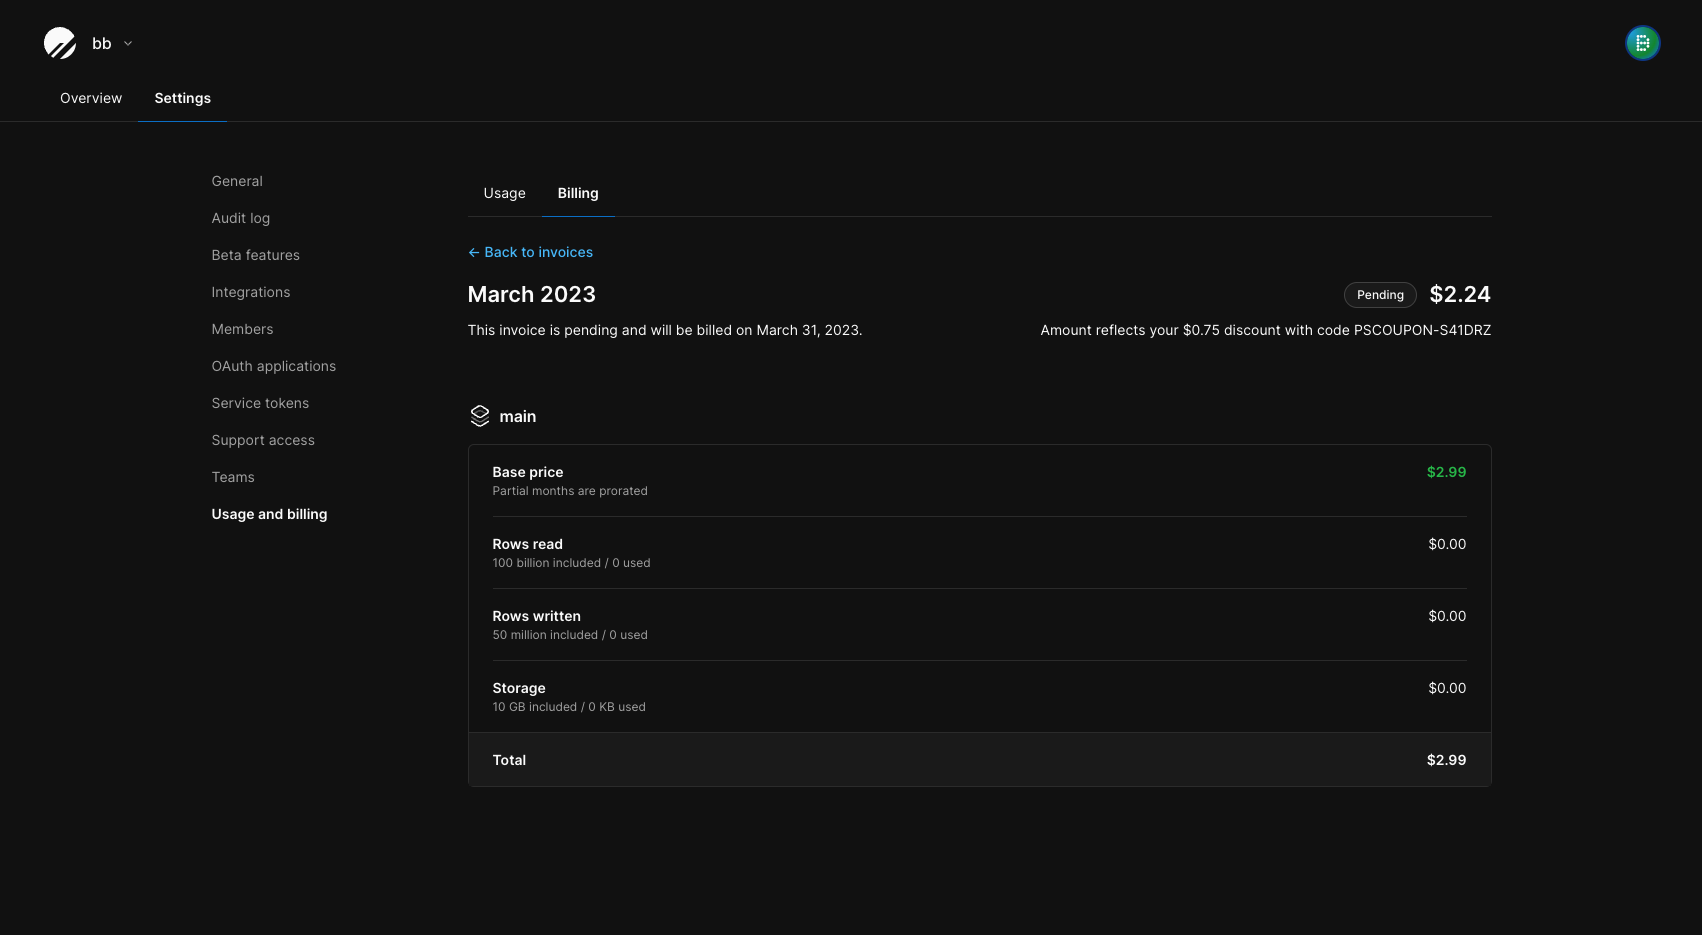
How do coupons affect invoices?
You will see your coupon reflected in your monthly invoice. Go to “Settings” > “Billing” and select the invoice for the month(s) where your coupon was active. You will see a note at the top of the invoice similar to this:Amount reflects your $xx.xx discount with code YOURCOUPONCODE