Introducing PlanetScale Insights: Advanced query monitoring
By Holly Guevara |
If you’ve ever experienced the frustration of debugging slow or costly queries, we’ve got a treat for you. With PlanetScale Insights, you can now analyze and debug individual query performance during specified time frames without leaving your PlanetScale dashboard.
What is PlanetScale Insights
Insights is the next generation of our in-dashboard query statistics tool. This update brings an interactive graph that maps your PlanetScale database query performance to selected time frames for quick debugging. We’re also introducing a new section that shows important metrics for all active queries running against the database over the past 24 hours.
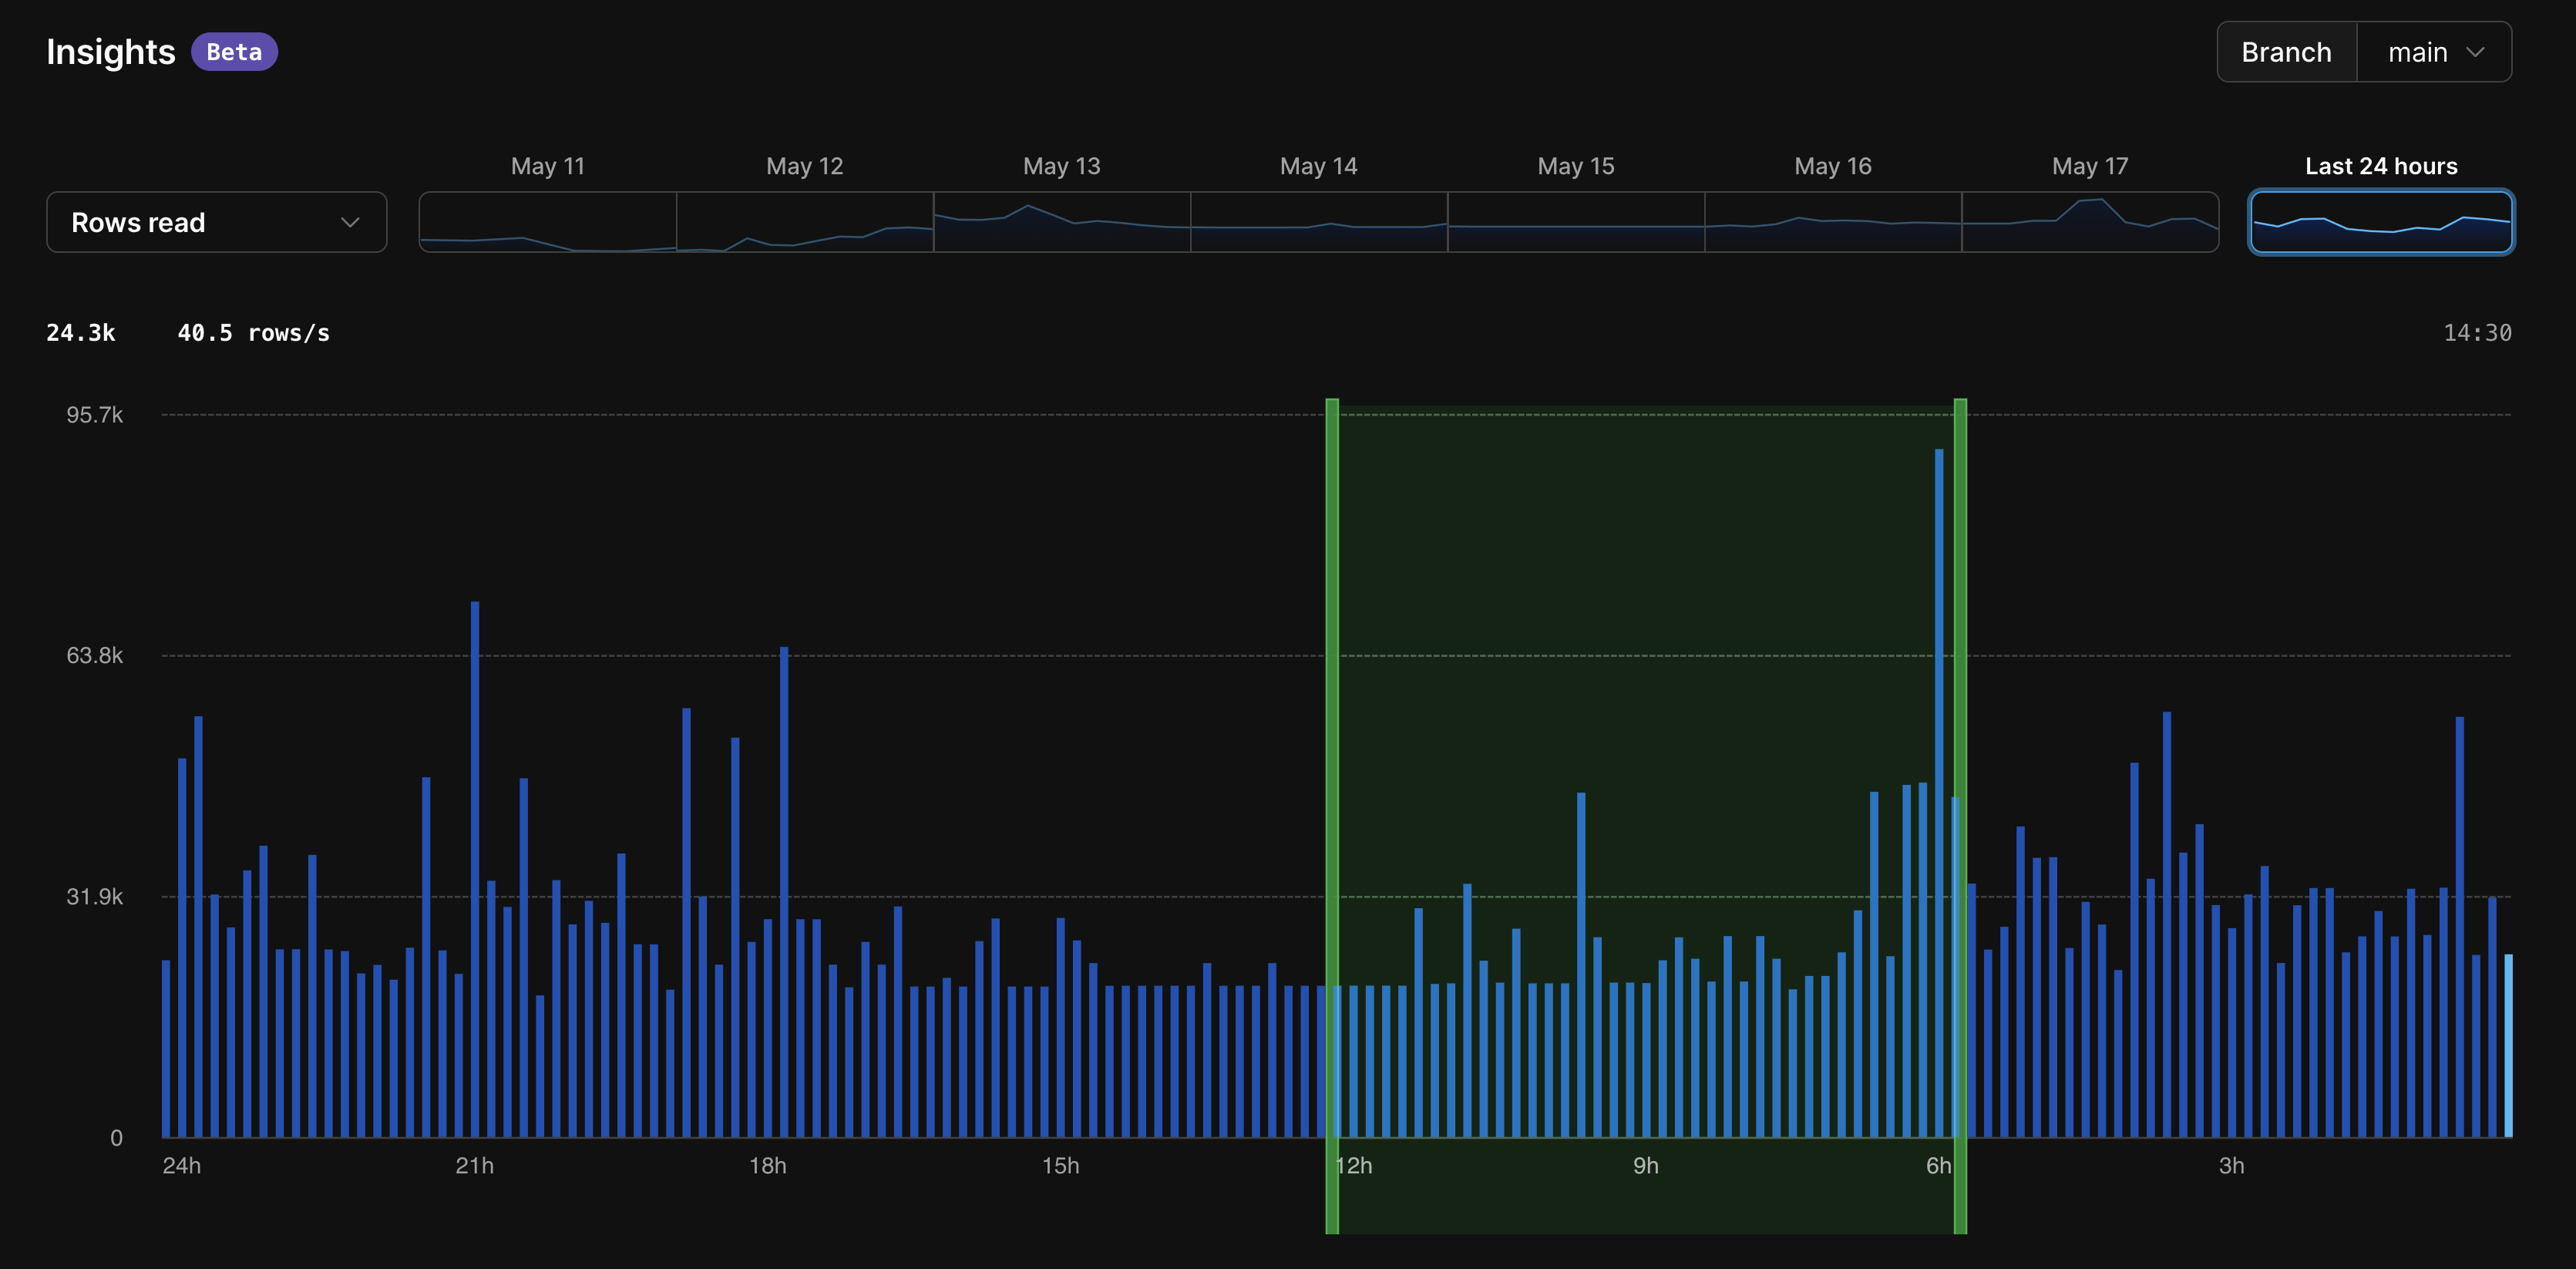
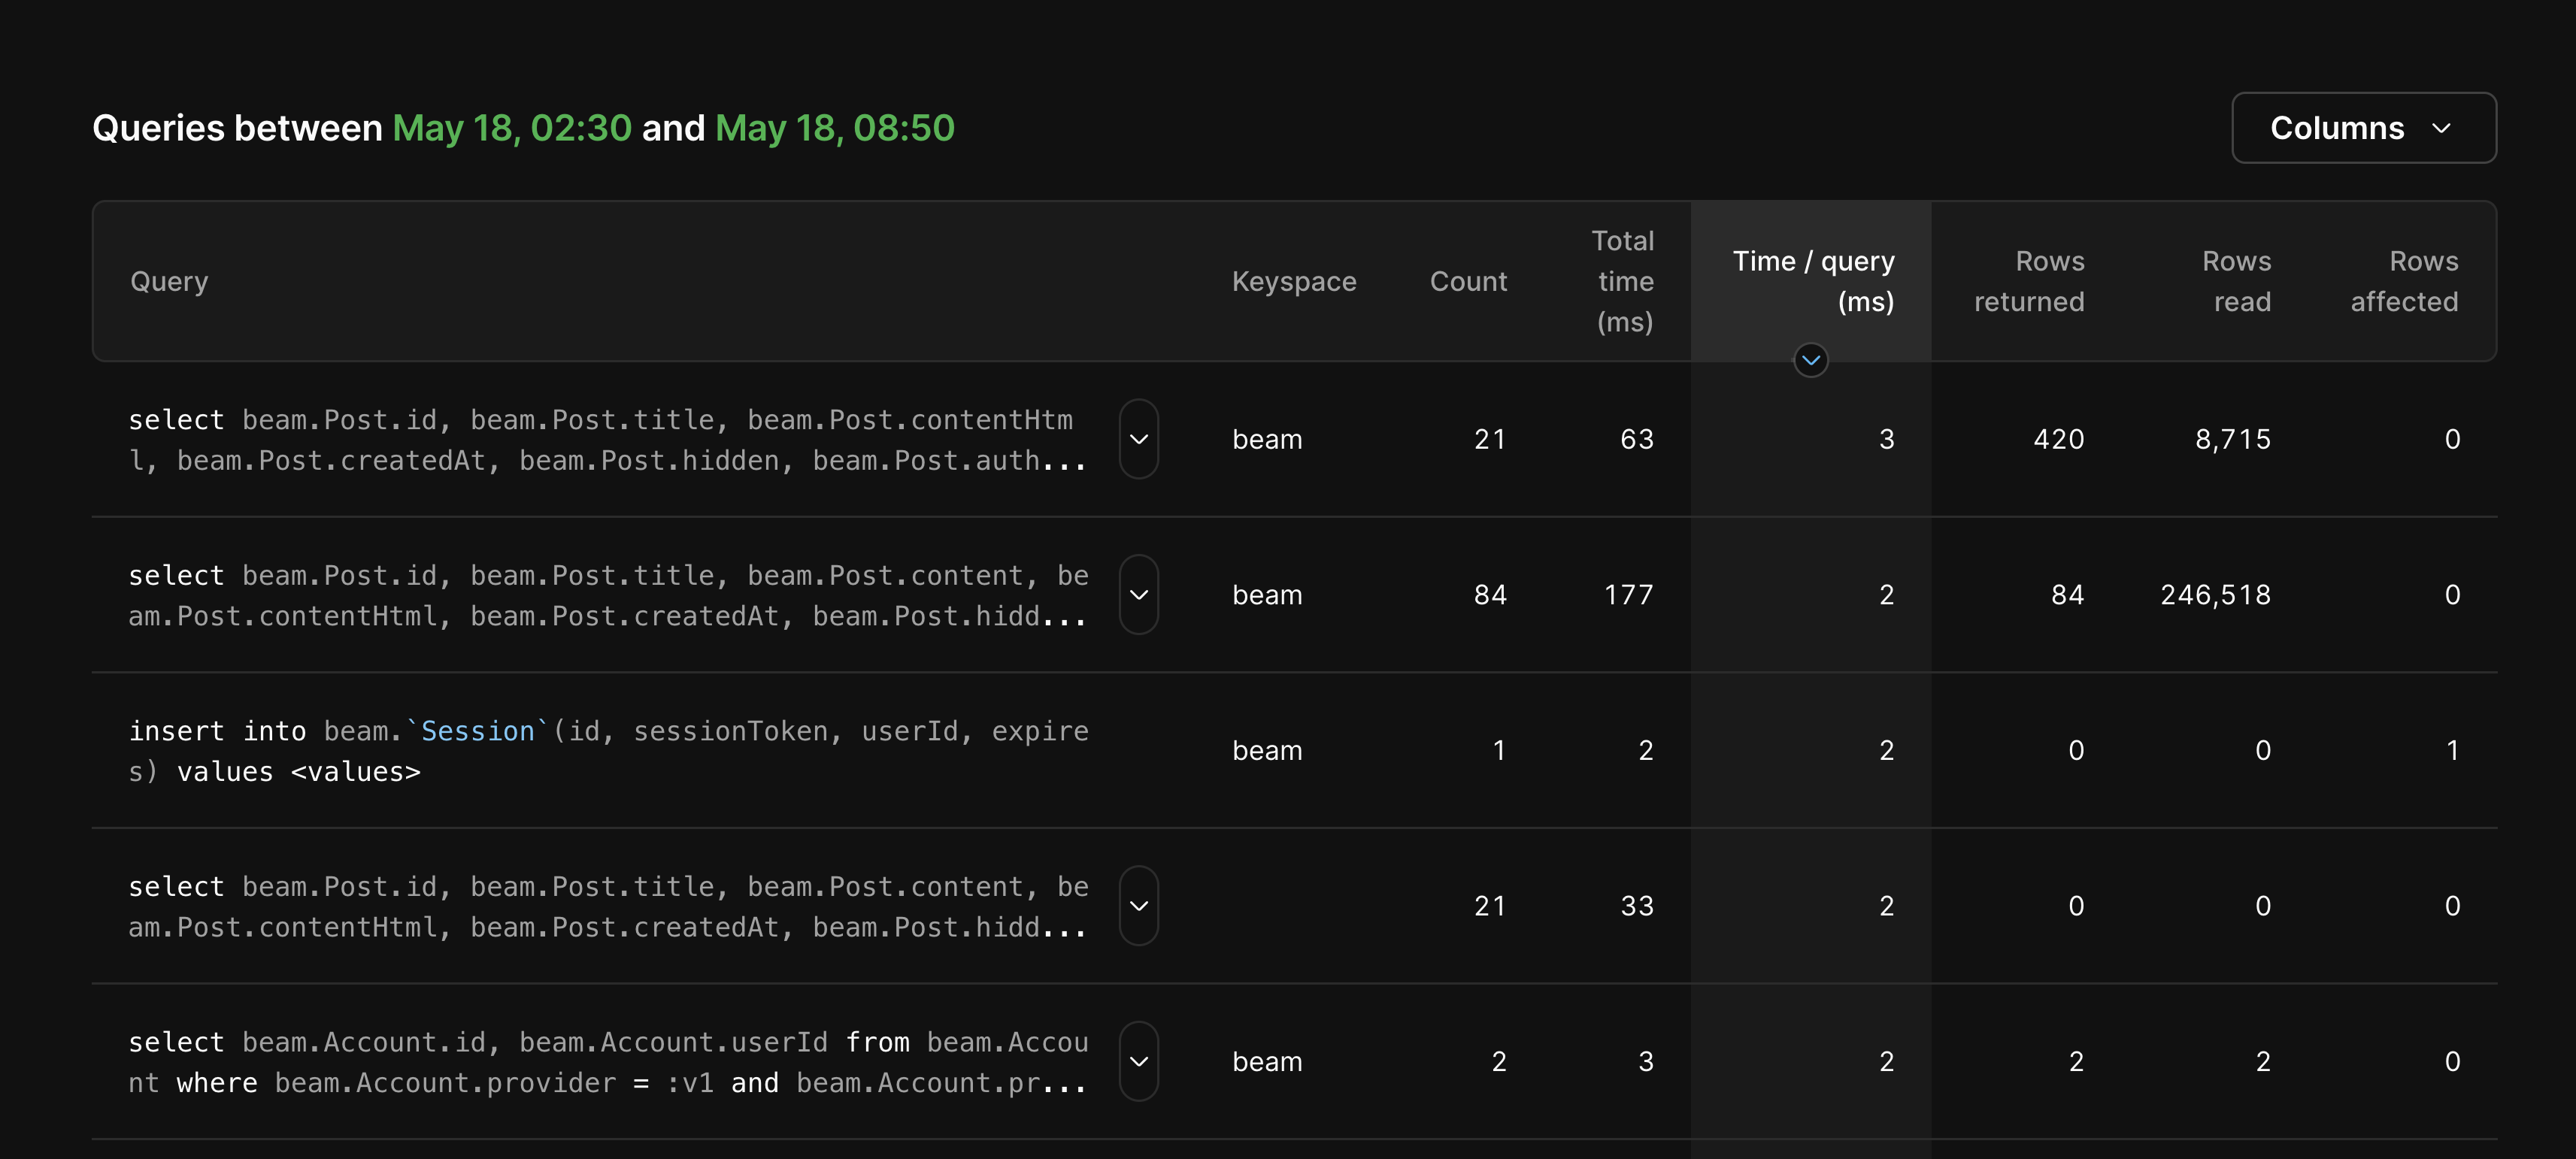
Insights time-based graph
With the new Insights graph, you can monitor the following metrics at a glance:
- Rows read
- Rows written
- Query latency
- Queries per second
You can hover over a point on the graph to see the metrics in 10-minute increments. This will surface the total rows read, rows written, latency, or queries per second during the selected period.
Additionally, deploy requests will show up on the graph, allowing you to quickly see the impact of the latest schema changes.
Queries during the last 24 hours
We’ve also added a new section that shows all queries that have run against your database over the past 24 hours.
If you have a lot of active queries, you can zoom in on a shorter time frame by dragging your cursor on the graph to select the period you want to analyze.
The following metrics are available for each query:
- Number of times the query has run
- Total time the query has run
- Time per query
- Rows returned
- Rows read
- Rows affected
We’re especially excited to surface the rows read per query! One component of PlanetScale billing includes total rows read per month, so Insights is a great resource to help you monitor how your queries affect rows read.
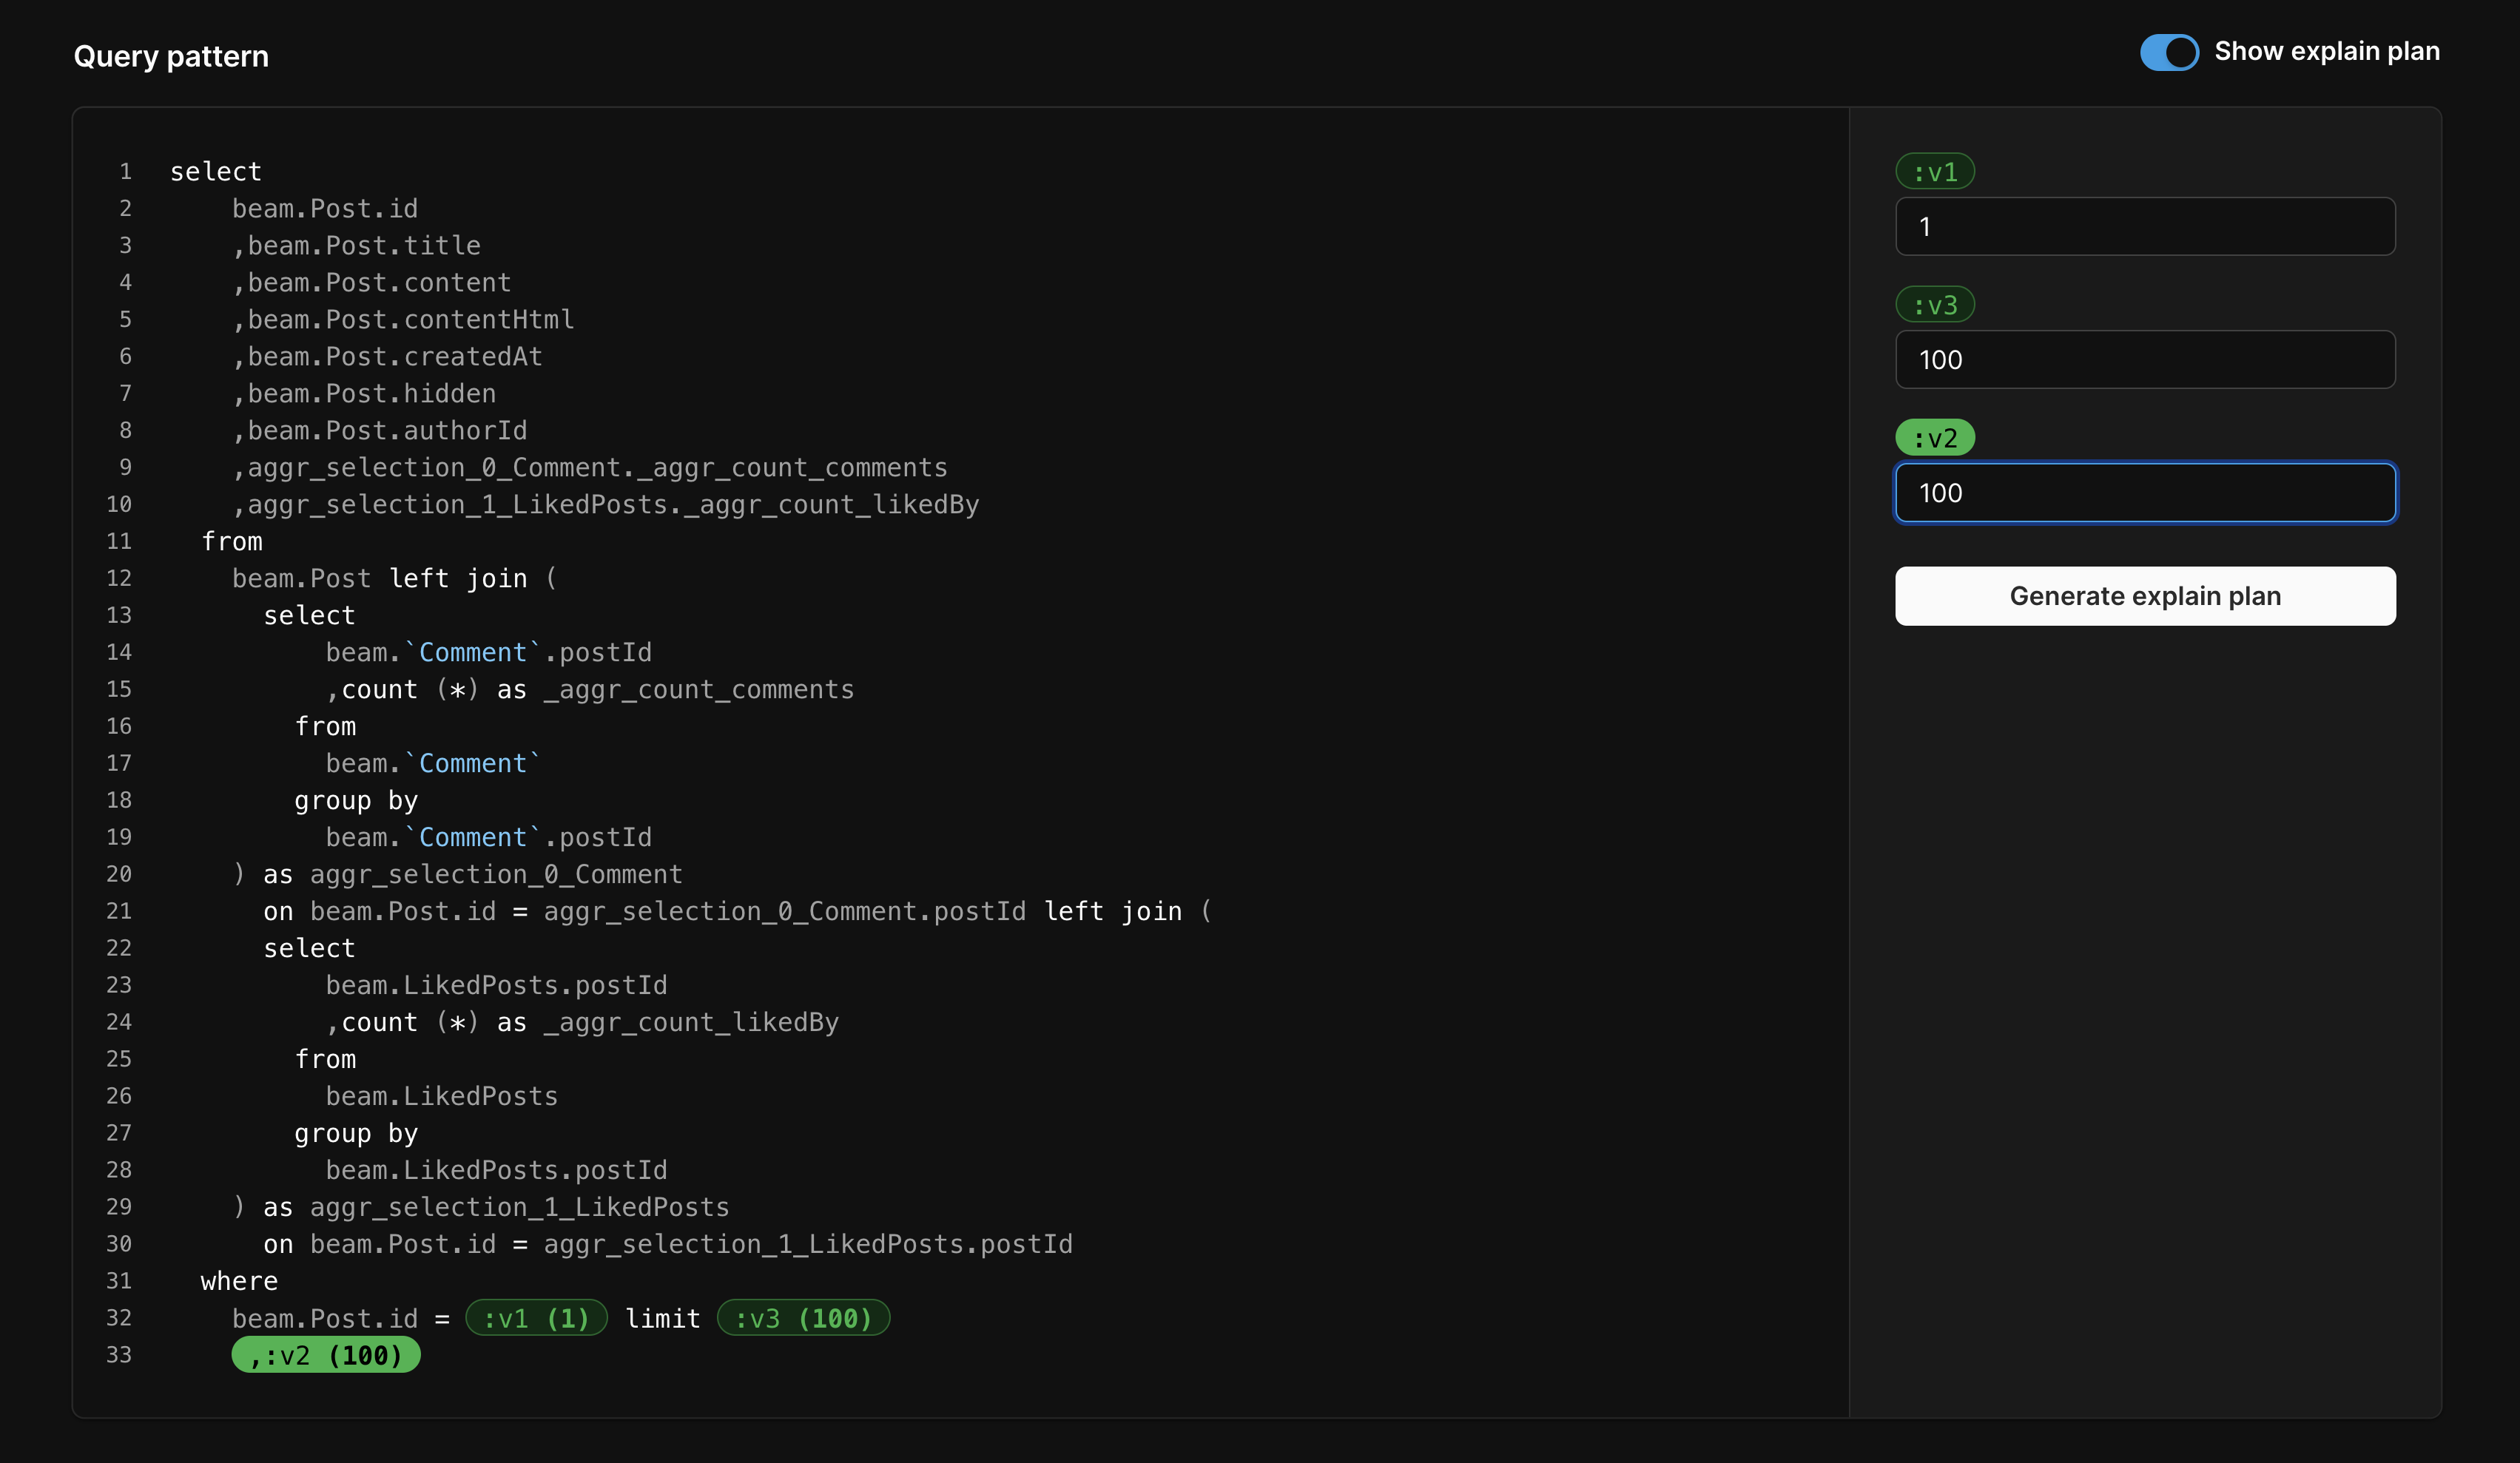
You can also click on a query to drill down even further. On the individual query page, you’ll find slow instances of the query, if applicable. We’ve also included a new UI for generating an EXPLAIN plan for each individual query, with the option to open it up in the web console as well.
Pricing and availability
Plan availability is as follows:
- Scaler Pro — Full Insights access for the previous 7 days
- Enterprise — Customize your retention period
To access Insights, select your database in the PlanetScale dashboard and click the "Insights" tab.
Insights in action
To help drive the power of Insights home, let’s see it in action.
In this example, we’ll walk through a practical use case using our very own database for our open-source Beam project.
Say we deployed a schema change to the production database and later noticed the posts page is loading slower than usual. Instead of spending hours searching for the offending query, we come to the Insights page to begin debugging.
We first look at the graph to identify any anomalies, such as any spikes in rows read or rows written. If this performance impact coincided with a deployment, the deploy request would show up on the graph next to the spike. This provides direct insight into what schema change caused the performance issues.
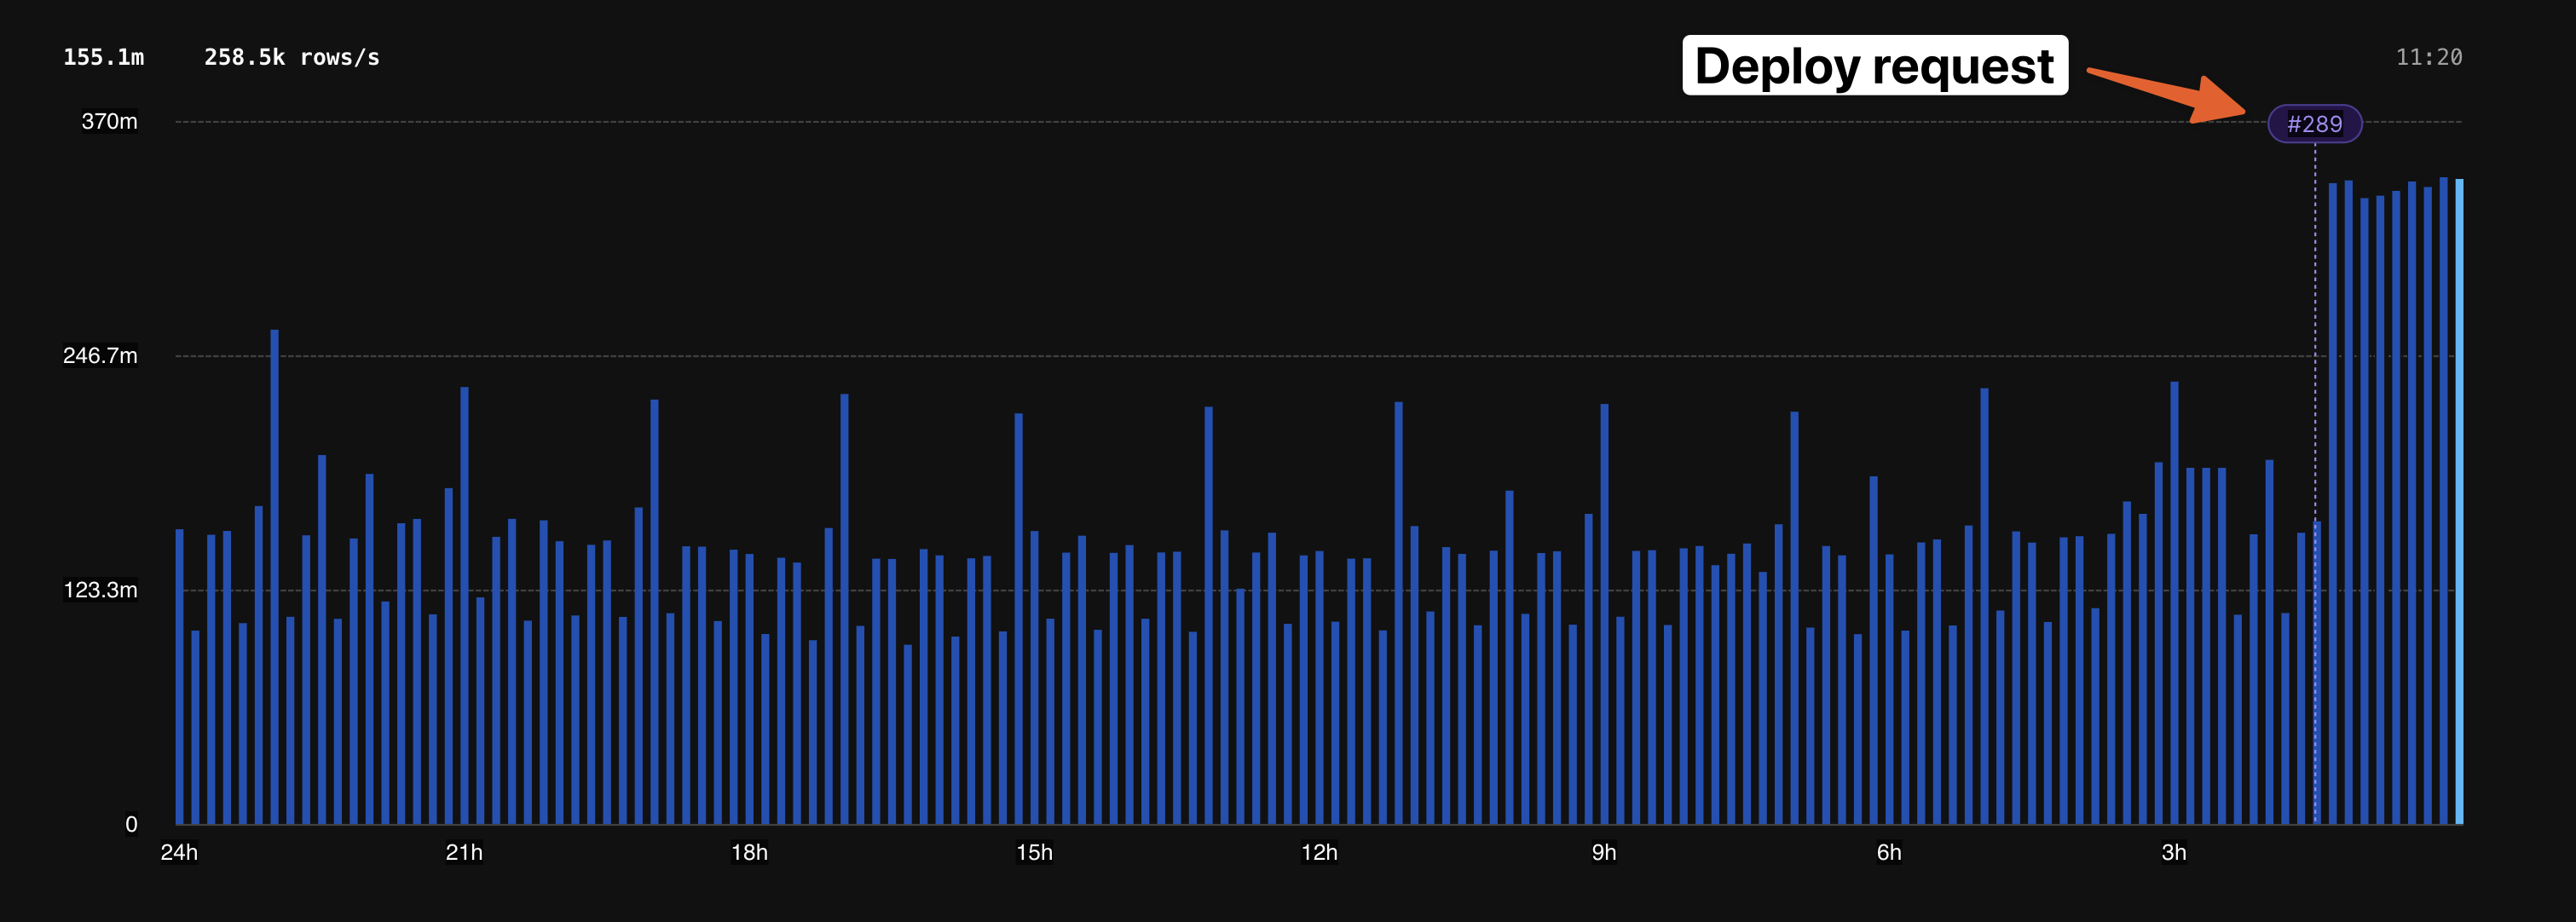
Based on the graph, we can see that there was a large spike right at the time we merged deploy request #289. This information gives us more confidence that this performance impact is indeed a database issue.
Next, we can drill down further by looking at the "Queries during the last 24 hours" table. We’ll sort by "Rows read" to quickly identify our largest queries and attempt to find the one that matches the spike on the graph.
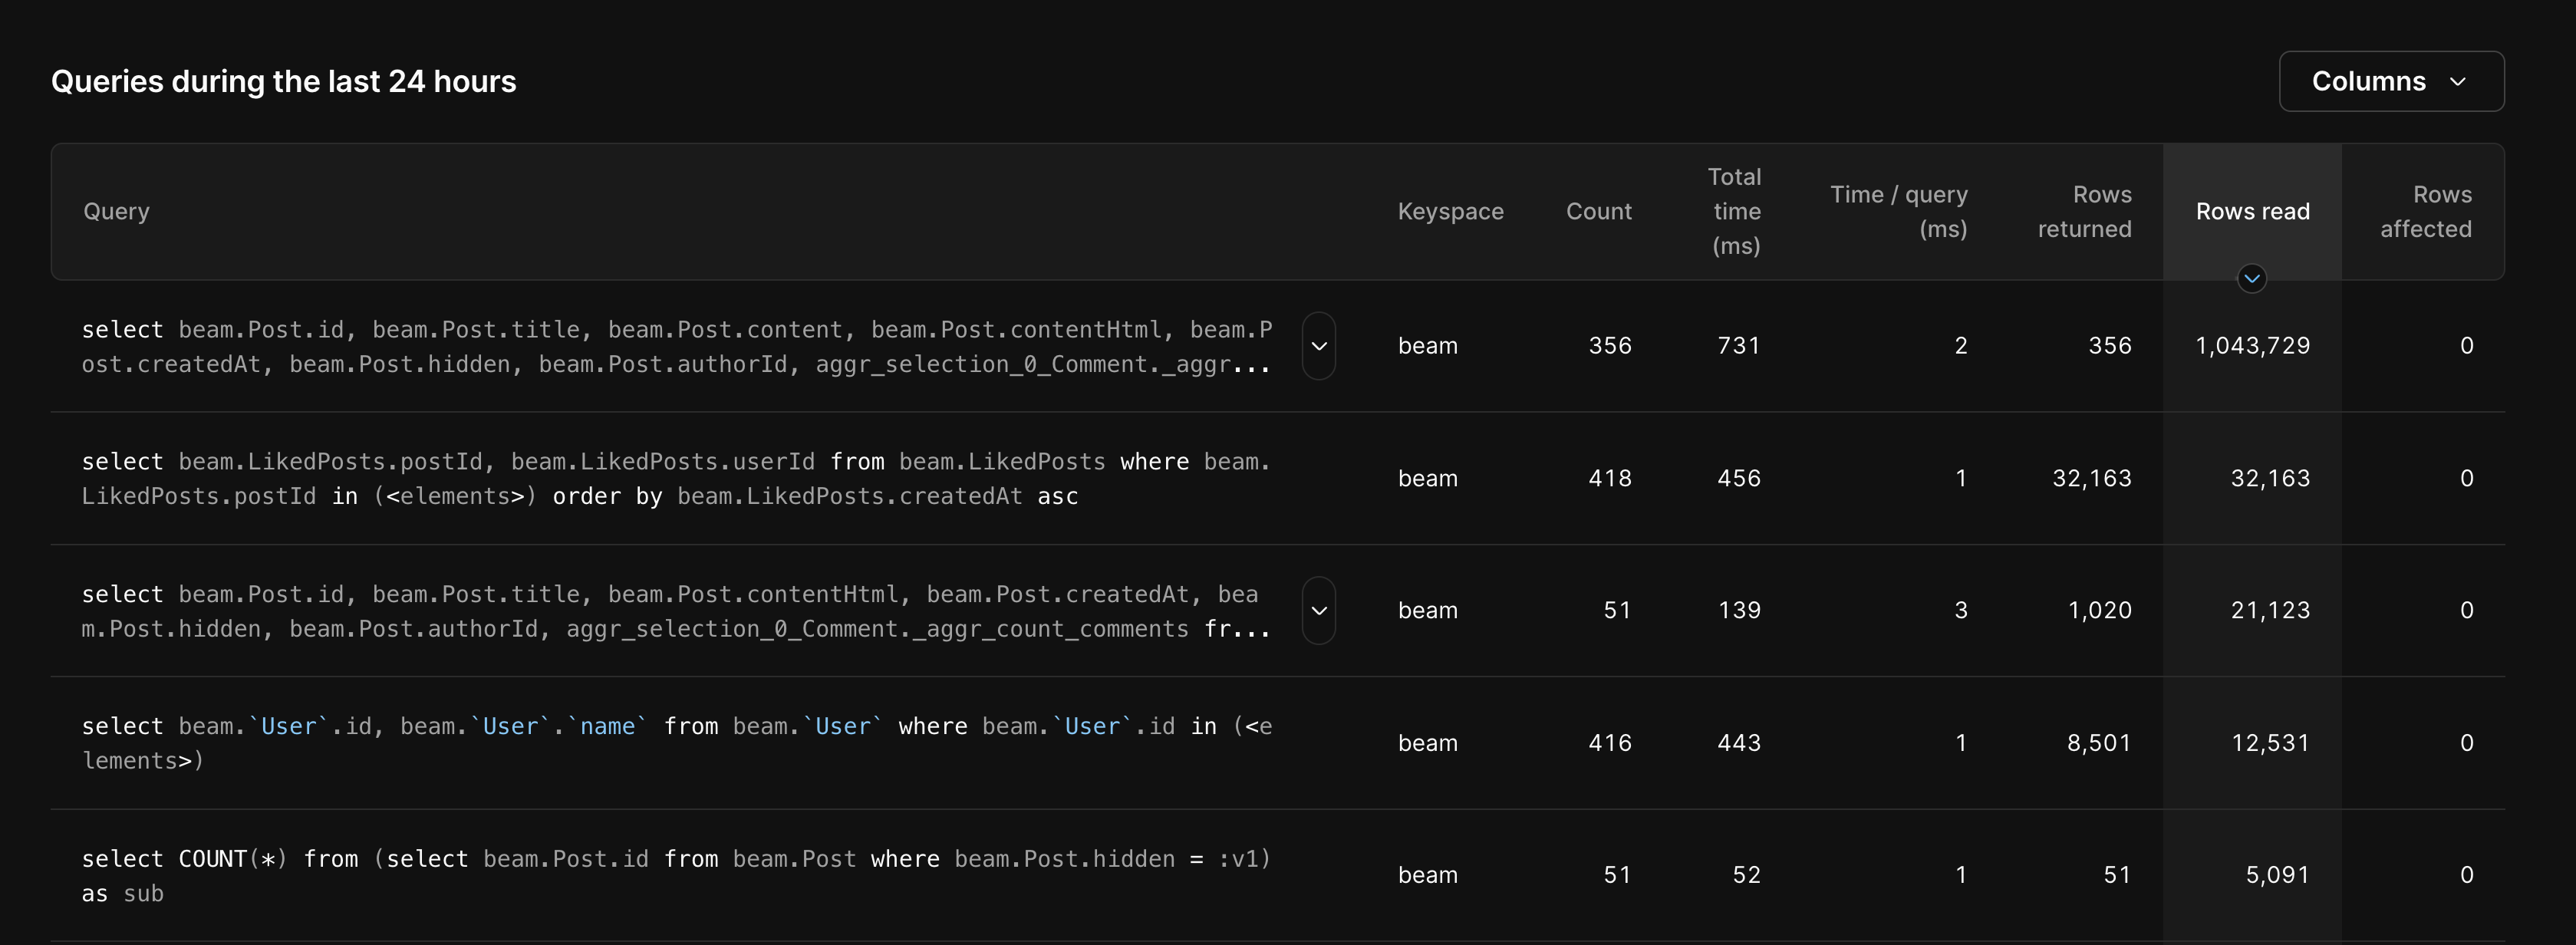
Up at the top, we see one query that stands out. At 1,043,729 rows read, it’s reading many more rows than we expect. Clicking on the query brings up the detailed view, which includes a list of all instances of the query running slowly in the past 24 hours.
Taking a closer look, we notice that this query has been running slowly since the previous deployment that we saw on the graph. We can open that deploy request to see what changed.

We have now identified the problematic query and linked it back to a schema change from our deploy request. With this information, we can create a new development branch where we can attempt to fix the issue. With Insights, we can see performance metrics for any branch, including development branches. As we’re developing the fix, we can come back to the Insights graph to confirm that our changes worked.
Finally, after deploying it to production, we come back to the Insights page to confirm production performance is back to normal.
Try it yourself
You can give Insights a spin today in the PlanetScale dashboard. You can then access Insights by clicking the “Insights” tab from your database overview page.
For more information, check out our Insights documentation. We love hearing from you! If you have any questions or feedback, don’t hesitate to contact us.