Overview
This in-dashboard tool allows you to identify queries that are running too often, too long, returning too much data, producing errors, and more. You can scroll through the performance graph to detect the time of impacted performance, quickly identifying any recent issues. You can also see a list of all queries performed on your database in the last 24 hours. For further analysis, you can sort these by metrics like amount of rows read, time per query, and more. With this built-in tool, you can easily diagnose issues with your queries, allowing you to optimize individual queries without much digging. We will also alert you of any active issues your database may be having in the Anomalies page. This feature flags queries that are running significantly slower than expected.Insights page overview
To view Insights for your database, head to the PlanetScale dashboard, select your database, and click the “Insights” tab. The dropdown on the top left lets you select which branch you want to analyze. You can also choose which servers you want to view insights for: primary or replicas.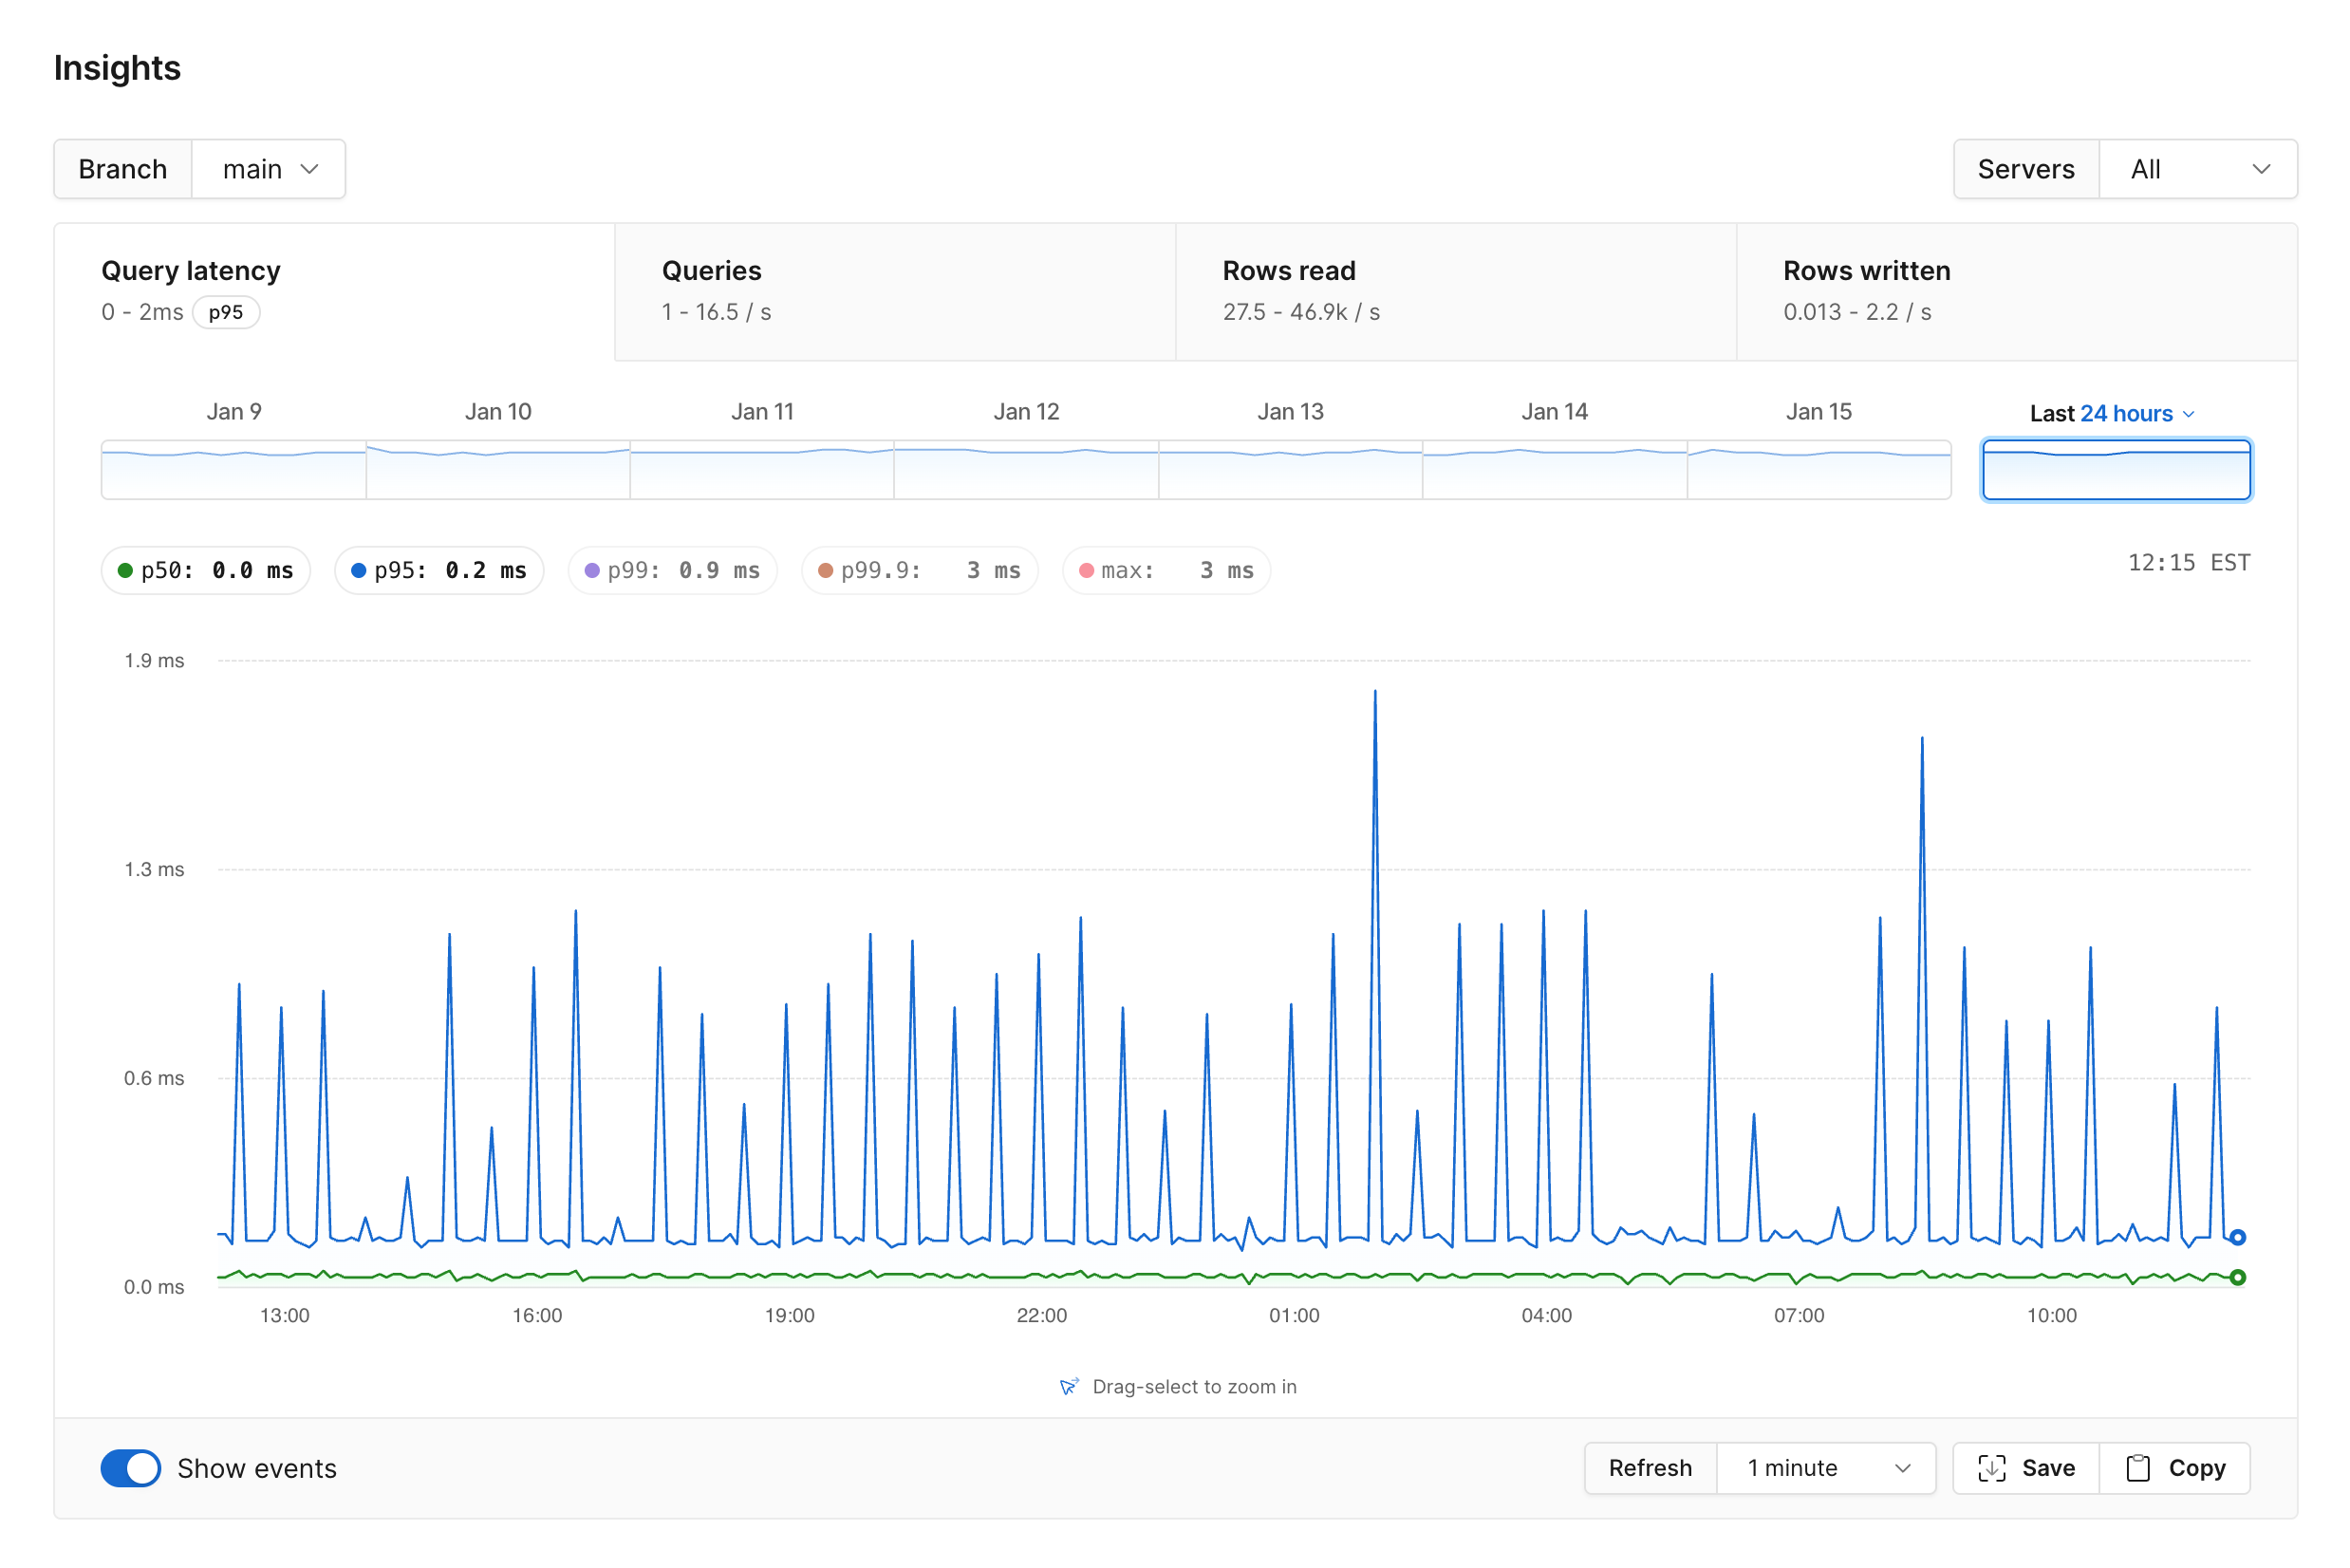
Queries overview table
The table underneath the graph shows all queries performed on your database in the selected timeframe (last 24 hours by default). For more information about how to read and interpret this data, see the Queries overview section.Insights graphs
Once you have selected the branch and server you want to analyze, you can begin exploring the insights for them in the following sections:Query latency
Queries
Rows read
Rows written
Database Traffic Control
Database Traffic Control also lives within the Insights tab. It lets you define resource budgets that limit how much CPU, I/O, or connection time specific queries or workloads can consume. You can create budgets directly from query patterns surfaced in Insights, making it easy to put guardrails around problematic queries. See the Database Traffic Control documentation for full details.MCP server access
Query Insights data is also available through the PlanetScale MCP server. This lets MCP-compatible tools like Cursor, Claude, and VS Code query your Insights data directly — useful for analyzing slow queries, spotting pattern changes, or getting index recommendations without leaving your editor. See the MCP server documentation for setup instructions.Query latency
The default graph depicts your database’s query latency in milliseconds over the last 24 hours. By default, the graph contains two line charts showingp50 and p95 latency. This means 50% and 95% of requests, respectively, completed faster than the time listed. You can also click on the p99 and p99.9 pills to toggle those on, or click p50 or p95 to toggle those off.
Queries
The Queries graph displays insights about all active running queries in your database. The graph displays total queries per second against the specified time period.Rows read
The Rows read graph displays the total number of rows read per second across the selected time period.Rows written
The Rows written graph displays the total number of rows written per second across the selected time period.Queries overview
The table underneath the graph shows queries performed on your database in the selected timeframe (last 24 hours by default).The queries table does not show following statements types:
BEGIN, COMMIT, RELEASE, ROLLBACK, SAVEPOINT, SAVEPOINT_ROLLBACK, SET.- An exclamation point icon indicates that the query is not currently using an index and requires a full table scan.
Available query statistics
You can customize the metrics that show up on the Queries list by selecting columns in the “View options” dropdown.
You can also sort the columns for quick analysis by clicking on the title at the top of each column.
If
Show sparklines is selected, numeric columns in the queries table show a time series graph of the value within the selected time period.
Enabling I/O columns
The % of I/O and I/O time columns require thetrack_io_timing PostgreSQL config setting to be set to ‘on’. This setting can be changed in the “Parameters” tab of the datatbase’s cluster configuration. Note that we only begin collection I/O query performance after track_io_timing is enabled. Enabling track_io_timing may impact query performance.
Query filtering
The search bar above the table allows you to filter queries as needed. You can filter for query SQL, schema (connection schema, and/or schema of tables referenced by the query), table name, query count, query latency, index name, and if the query was indexed. Click on the? next to the search bar for the full list of search syntax.
Query deep dive
Clicking on a query in the Queries list will open a new page with more information about that query. You’ll first see the full query pattern, which displays the query with data normalized away. This query may run several times with different values, which Insights combines into a single query pattern. You can display an LLM-generated summary of the query by clicking “Summarize query.”Additional query information
Beneath the query pattern is a graph with more information about the query. The set of available metrics/tabs include: Query latency, Queries, Rows read, Rows written, Errors and Indexes. The Indexes graph (which is not shown on the database-level page) shows the percentage of queries that used each of the listed indexes in each time bucket. Beneath the time series graphs you will see summary statistics for the query pattern. These data are scoped to the same time period shown in the main query pattern graphs. The available metrics have the same definitions as the query statistics listed in the main insights page. Queries that use an index include a horizontal bar graph that shows the cumulative usage of each index over the complete time period shown in the main query pattern graphs. To change the time period reflected in the graphs and summary statistics, click and drag to restrict the time window, or click on one of the day icons above the graph to select a different day.Notable queries
Underneath the graph, you’ll see a table with more information about notable instances of the query, which are defined as queries that took longer than 1s, read more than 10,000 rows, or produced an error. If any of the selected queries have query tags attached, you’ll see the key-value pairs in the table underTags. See Query tags for how to add tags to your queries.
The table also surfaces when the query started, rows returned, rows read, rows affected, the time it took the query to run (in ms), and the user associated with the query.
Extension configuration
Thepginsights extension is responsible for sending query telemetry to the PlanetScale Insights pipeline. Its parameters, including raw query collection and schema name normalization, can be changed in the Extensions tab on your database’s Clusters page.
For full parameter documentation, see the pginsights extension reference.