DevOps with PlanetScale
PlanetScale was built with continuous integration and deployment in mind. This section of our documentation contains guides and tooling recommendations to use with PlanetScale to enhance your pipelines for a smoother database experience.
DevOps is typically broken down into eight distinguished phases as an operational model. The phases operate in a continuous loop, with each phase providing value to the phase ahead of it as shown in the following diagram in the gray text:
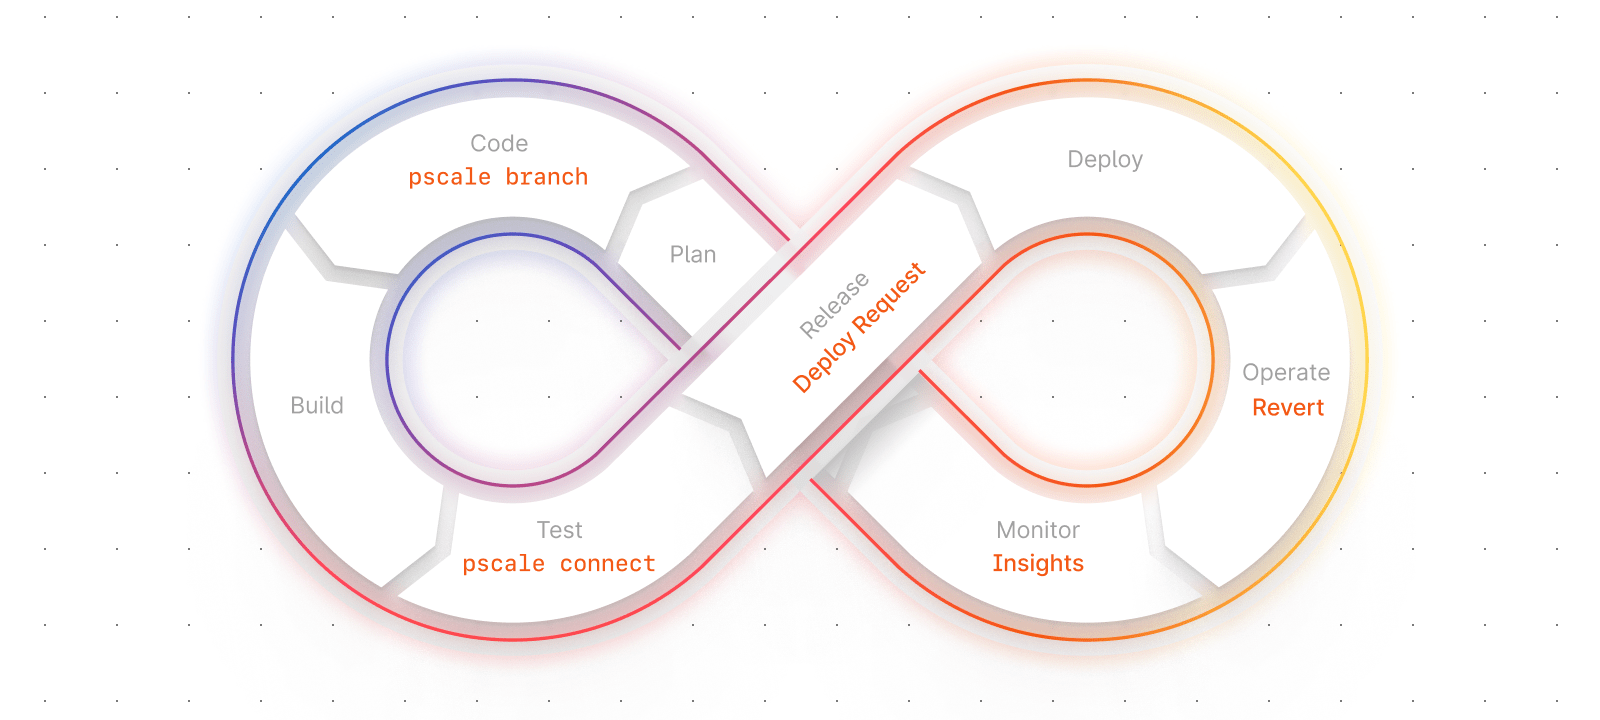
This blog will act as a brief introduction to these phases, with a summary of how various PlanetScale features apply to each phase. Links to the relevant PlanetScale feature documentation will be provided, and additional resources such as practical tutorials with specific products and frameworks will be included as they are built.
Note
These sections are to act as guides.
While DevOps presents the eight phases as an operational model, it's important to understand that these phases are to act as guidelines as opposed to a rigid workflow. As such, building a workflow that fits your business's needs is the important part and your workflow may differ drastically from what others have built.
In each section, you'll find specific recommendations on what features of PlanetScale can be used within that phase, but DevOps is not a "one size fits all" process. You are encouraged to modify the flow and use any features as you see fit, to make the product work for you.
Plan phase
The Plan phase is where the enhancements, changes, bug fixes, or new features are set up for developers to start building out. It is here that project managers and product owners review the feedback gathered from the previous development cycle and use it to determine what backlog items (or items that have yet to make it to the backlog) will provide the most value to end users, be they internal or external. If the team follows an agile development process, it's where sprints are planned and individual issues are assigned to various members of the team.
While PlanetScale doesn't have tools to directly assist with the planning process, there is one key way that our platform can be utilized in this phase, and it ultimately depends on the source control strategy used throughout the remainder of the process. As you'll learn throughout this series of guides, having a good method to automate processes utilizing source control as the backbone for the overall process is critical in determining how simple or difficult it will be to use DevOps within your team.
Database schema branching
If your process dictates that a branch be created for the active iteration before any code is submitted (the focus of the next phase), this is the perfect opportunity to create a new PlanetScale database development branch for the applications you will be working on.
A branch of a PlanetScale database is a completely isolated MySQL instance that has an exact copy of the schema of the upstream database. It allows developers to make changes to the schema of the branch without worrying about affecting the production database. Credentials required to connect to database branches are also unique to each branch. In other words, even branches within the same database environment have unique connection strings. Refer to the documentation on branching to learn more.
Data Branching®
PlanetScale also offers Data Branching® in some pricing tiers. With Data Branching®, PlanetScale will automatically restore the latest version of the backup of a production branch into the new branch being created. This can help create a sandboxed environment for developers to work with that exactly mimics your production environment without affecting production data.
Automate branching via the PlanetScale CLI
If your project management tools allow for automation, you can use either the PlanetScale CLI or our public API to automatically create a branch and credential set whenever a sprint or iteration is created. The pscale CLI is a cross-platform command line application that can be used to interact with PlanetScale databases, and the API is a set of HTTP endpoints that can be used to automate certain functions of a PlanetScale database. Refer to either the pscale documentation to learn more about the CLI, or the API documentation to learn more about how to use the PlanetScale API.
In this guide, we touched on the planning process and how project management software can utilize the pscale CLI to automatically create branches when a new iteration is kicked off. The next step in the DevOps cycle is the code phase, where developers build the functionality set forth by the planning phase.
Code phase
This is the phase developers are likely most fond of. The next iteration has been planned, tasks assigned, and the code is being written for improvements to come. As code is being written by developers on their workstations, changes will be frequently checked into a dedicated source control system that acts as the single source of truth for the codebase. While several different systems can be used, git is the most popular one. Many tools integrate with git, which will be important as we progress through the DevOps phases to follow.
Companies that follow good DevOps practices should have isolated environments outside of production so when new code is being developed, there won't be any impact on the users actively working with the application. This also includes the storage layer of the application, which is where the database lives. There are several ways in which PlanetScale can help developers.
Database Branching
The first way that PlanetScale tooling can help is with the schema branching flow at the heart of PlanetScale databases. As described in the Plan phase, a branch of a database in PlanetScale is a completely isolated database with a copy of the production branch. Any operations performed on a branch will not affect any other branch of that database.
Since branches are separate from one another, a dedicated database branch should be created for developers to build on that is completely isolated from the production database. This same branch can be used later in the DevOps process to simplify merging changes into the production branch using a feature called Deploy requests, which will be expanded on in the Release phase. If a branch wasn't created in the previous step, it should be created now before developers start writing code.
Added security with the pscale CLI
Local configurations can be simplified as well by using the PlanetScale CLI to create a tunneled connection to that branch using the pscale connect command. This could be done in place of sharing connection strings. Account administrators in PlanetScale have complete control over the users who can connect in this manner, reducing the security risk of those connection strings being obtained by a bad actor.
This tunneling process can be run at the same time the local development environment starts by scripting the creation of the tunnel before starting any other dev tools. Since the process uses access-based authentication over connection strings, developers who work at companies where secrets are regularly rotated will not be affected in situations where connection strings for development databases need to be regenerated.
In this guide, we discussed the Code phase and how database branching and the PlanetScale CLI can help developers work a bit easier. The next step in the DevOps cycle is the build phase, where the new code built in this phase is compiled or otherwise set up.
Build phase
Now that the code is written and tested locally, it's time to build it for a production-like environment. Generally, this is an automated process that is triggered by the source control management software used throughout the DevOps pipeline.
When a build is triggered, a subprocess is kicked off based on that event to use a dedicated build server or containers to ensure that the code compiles. The result of the build phase is the artifacts or compiled/transpile versions of the code. These artifacts should be the same files that are used throughout the remainder of the process, including the testing process and deployment to production.
There are three ways that the build process is typically triggered:
- Manually
- When commits are pushed
- When pull requests are approved and closed
PlanetScale offers tooling and features to support many phases of the DevOps lifecycle, however since the Build phase is primarily focused on code compilation and generating artifacts for testing and deployment, there are no practical ways that our system can directly help during this process.
In this guide, we discussed the Build phase and how deploy requests can be used to merge changes to the test branch ahead of the Test phase, where the artifacts generated from this phase are run through a series of tests to ensure they are ready for production.
Test phase
By this point, new code was written and compiled into artifacts that can be used during deployments, but it was likely only tested on the developers' local machines. These development environments are likely not exactly the same as production and, as a result, may not necessarily mean that the same code will work smoothly in production. During the test phase, the artifacts are run through a series of tests, preferably using automation, to ensure the quality and performance of the code, and to maintain interoperability with any other services or infrastructure as required.
There are different types of tests that can be run, but the type that PlanetScale can help with most are integration tests. Integration testing involves testing your software with the different modules or services that also support the application, one of these being the database.
Use a dedicated test branch of the database
Since database schema branches in PlanetScale are isolated copies of your database schema, a dedicated branch can and should be created specifically for this phase. Many organizations configure their environments to move linearly (dev → test → production) throughout their pipeline. This is where the PlanetScale flow deviates from convention a bit. Since development branches can only be merged with branches with safe migrations, and the dev branch (which is development) contains the version of our schema with the most recent changes, you'll need to create a branch from the dev database branch.
Seed with production data
If your tier includes the Data Branching®, you can spin up yet another production-like environment by utilizing data from the most recent backup of the production branch database. This will ensure that your automated tests (as well as manual QA tests) will simulate production as close as possible instead of relying on pre-determined test data. This can provide a greater opportunity for the test to break and need revisiting, avoiding potential issues in production.
Seed data with the PlanetScale CLI
There are times where bringing production data over for testing is not practical. In that situation, you'd may consider seeding the test database branch with the required data, as well as generate the connection strings required by the test environment. Luckily this functionality exists within the PlanetScale CLI and can be automated. The pscale branch subcommand would be used to manage branches for a specific database. The pscale shell subcommand can actually accept a piped in .sql script in exactly the same way you'd use the mysql terminal client. And finally the pscale password subcommand can be used to generate credentials for a given database branch.
Delete the test branch
Once integration tests have completed successfully and all are passing, it is not likely that your test branch needs to remain active. Since the test branch is an isolated MySQL instance, you are safe to drop the branch without retaining any of the data it contains. This can be done manually through the PlanetScale dashboard, or you may use either the PlanetScale CLI or API to automate the process of deleting your test branch.
If you decide to script the CLI in your pipeline, you can use pscale branch delete <DATABASE_NAME> <BRANCH_NAME> to discard the branch and the data it holds. The PlanetScale API offers the /organizations/<ORGANIZATION>/databases/<DATABASE_NAME>/branches/<BRANCH_NAME> to delete branches if you want to use curl or other tools that can send HTTP requests.
In this guide, we discussed the Test phase and dedicated database branches can be used to assist with integration testing. Next up is the Release phase, where the new software is set up for a successful deployment into production.
Release phase
The Release phase is where the 'Ops' part of DevOps starts. In the release phase, the primary goal is to ensure that the infrastructure and environment are set up for a successful launch of the updated software. This can include spinning up or down servers, updating operating system configurations, or setting up any other necessary infrastructure to support the application. At this point, the updated code should have been thoroughly tested and confirmed to be working to the best of the team's ability.
Deploy requests in PlanetScale allow you to safely merge schema changes from a development branch into a production branch with safe migrations enabled. This allows for zero-downtime deployments of a new version of the database's schema. This is the phase where deploy requests will be utilized to prepare for a successful deployment.
Deploy requests
Deploy requests are used to merge schema changes from one branch to another, similar to how pull requests merge git branches. Deploy requests work by creating shadow tables that store the new version of the schema for that specific table and replicating data from the old version to the new one. This includes any writes that may occur during the process. When the data in both tables are synced up, you are presented with the option to cut over to the new version of the table, provided the auto-apply option wasn't enabled.
During this phase, a deploy request should be opened from the dev branch into the production branch of your database but not applied until the Deploy phase coming up next. This will allow PlanetScale to stage the changes that need to be applied to your production database branch without affecting the current production version of your application.
This means that as long as the deploy request is not "applied" to the target branch, PlanetScale will continuously keep the live table (old schema) and shadow table (new schema) in sync until your team is ready to deploy the new artifacts into production.
A note on blue/green deployments
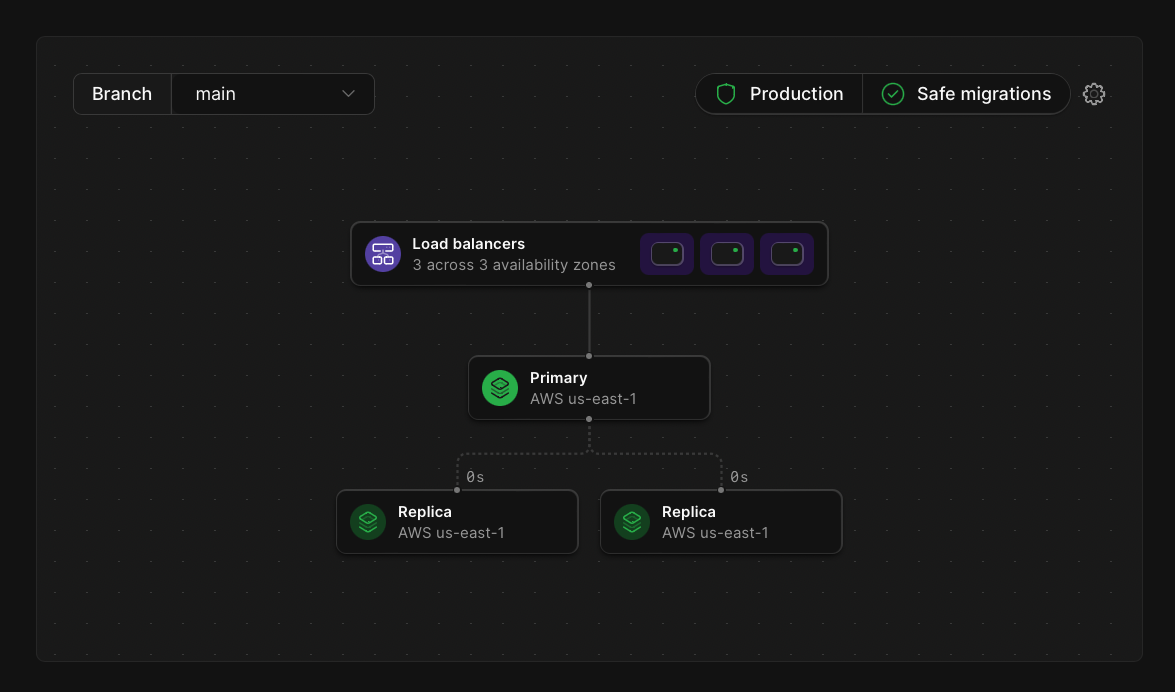
If you are at the Scalar tier and above, PlanetScale databases support multiple production branches. Production branches automatically have an additional failover instance of your database ready behind the scenes to improve redundancy. While there are no tools directly within PlanetScale to assist with blue/green deployments for your database, multiple production branches can significantly reduce the administrative overhead of managing multiple MySQL environments.
In this guide, we discussed the Release phase and how your production database can be set up for a live cutover using deploy requests. Next up is the Deploy phase, where all of the work is deployed to your production environment.
Deploy phase
Everything in the previous phases has been building to this point. It's where all the hard work gets deployed to production for the world to use. The operations team will coordinate to copy release artifacts that have been built & tested to production servers. If your team follows a blue/green strategy, the load balancers will instead start redirecting traffic to the staging server, and the current production environment takes the responsibility for staging the next cycle of application updates.
Branching and deploy requests in PlanetScale are the primary features that enable PlanetScale databases for flexibility in a DevOps environment. During this phase, any open deploy requests should be closed and applied to the production branch. All of the schema changes that were configured during development should now be in production, along with the new code that requires the changes to those tables. If your organization has opted into the schema revert feature, this starts the 30-minute window where you have the option to revert the changes in case something goes catastrophically wrong.
Back out of changes with schema revert
Having a great deployment strategy is key to successfully implementing DevOps, but knowing how to properly back out of changes can be just as important. Many source control management systems can be automatically configured to retain a certain number of previous releases which can be used to roll back application code, but doing so for a database can be difficult without affecting the data it holds.
As stated previously in this series, Deploy request utilizes shadow tables to synchronize data changes between tables with the old version of the schema and tables with the new version of the schema. If schema revert is enabled, we will continue to synchronize changes between the live and shadow tables for a period AFTER the deploy request is closed and changes applied. This enables you to quickly revert the changes made by a deploy request and instantly bring back the old version of your schema. Having this capability can significantly decrease the time to revert changes, as well as reduce the potential for your application to stay in a bad state long term. This alone can increase developer confidence when it comes to applying changes to the database.
In this guide, we discussed the Deploy phase and how any open deploy requests should be closed at this point, as well as how schema revert can help back out of bad changes quickly. The next step in the DevOps cycle is the Operate phase, where the Operations team maintains the infrastructure that powers the application.
Operate phase
Now that everything is deployed into production and confirmed working, the operations team's main focus is keeping everything online. Ideally, this is done with a system that will monitor application load to detect spikes in usage and automatically scale resources up to keep up with the traffic. This can be accomplished with platforms like EC2 in AWS, but also on-premise with Kubernetes.
All PlanetScale tiers eliminate the need to maintain your MySQL infrastructure by allowing us to do it for you. Additionally, any production branches automatically have failover replicas so even if something fails with one instance internally, a backup is always available to take over while any necessary maintenance is performed by our teams.
On top of reducing the necessity of maintaining a MySQL environment, PlanetScale offers additional features that can simplify the jobs of the operations teams.
Backup and restore
Any well-run operations teams know that backing up and restoring data is a critical task that must be taken seriously. A time will inevitably come when data is lost whether that is due to bad code or mistakes during the deployment process. Having a way to retain snapshots of your data at specific points in time for recovery is critical, and this functionality is built into PlanetScale databases. All databases on our platform have a daily backup configured automatically, regardless of which tier you are on. Additional backups and retention periods can also be configured, with the only additional cost being the storage used by the backups.
One thing that can be overlooked is the fact that backups are pointless if the data within them doesn't restore properly. Since we support the concept of database branches, and those branches are isolated instances of MySQL, restoring a backup will create a dedicated branch for the data to reside. This can vastly simplify the process of performing test restores. If you can quickly configure new environments using Infrastructure as Code tools, you can easily spin up entire production-like environments to fully test your application, which can dramatically improve the confidence of the operations team.
Horizontal scaling
PlanetScale is built in Vitess, which is an open-source project that enables horizontal scaling for MySQL databases. Sharding, available on our Base plan, further reducing the load on individual nodes as well as increasing performance and resiliency.
Read-only regions
When creating databases or branches, you'll be presented with the option to select which region you'd like your database created in. After creation, you'll also have the option to create read-only regions. This adds a replica of your database in a specific geographical location to more quickly serve queries by users in that area. Traditionally this would require operations teams to set up additional data centers linked by VPN tunnels or private ISP networks to securely synchronize data, but this is all handled by PlanetScale without such complexity.
In this guide, we discussed the Operate phase and discussed features that PlanetScale offers to make the lives of Ops members easier. The last step in the DevOps cycle is the Monitor phase, where feedback and metrics are gathered for decision-making before the next iteration.
Monitor phase
The last phase of the DevOps cycle is to monitor the entire application. This can be by gathering feedback from customers that use the application, but also to monitor performance metrics that the application tracks. This feedback should be used in decision-making when the team inevitably comes together again to plan the next cycle.
One important metric of your application's performance is how quickly your queries are executed. Slow-running queries can bring an application to its knees.
PlanetScale Insights
PlanetScale offers Insights with every database that is hosted on our platform, which is a visual way to see how well your queries are performing. Performance data is automatically tracked in real-time and displayed on a graph so you can see periods of high usage. You can also see which queries are executed most frequently or are taking the longest to return data.
If your database is enrolled in the schema-revert feature, the metrics gathered by Insights could help in making a data-driven decision on if the schema you just deployed to production is experiencing issues and needs to be rolled back. While having your own logging and monitoring platform to analyze errors in your code is definitely a best-practice, this would act as an additional layer of analytics and may help in reducing downtime overall.
PlanetScale Connect
PlanetScale Connect is a feature provided to our databases that allows you to extract data from the database and safely load it into remote destinations for analytics or ETL purposes. Using Connect with our supported destinations can enable you to further process the data in any way your organization may need. This can help provide detail as to how users are using your application based on the data that's written to your database and assist in driving decisions in the next planning cycle.
We currently support loading data into Airbyte and Stitch destinations, with more planned for the future.
Datadog integration
If you are a Datadog customer and use their platform to centralize your analytical data, we offer an integration with the service. Our integration will gather similar data that is displayed in Insights and forward it to a PlanetScale dashboard that is automatically created when the integration setup is complete. Refer to the Datadog integration article for more details on how this can be configured for your PlanetScale database.
While the Monitor phase is what concludes the typical DevOps cycle, it loops back into the Plan phases for the next iteration to be set up. At this point, you should be well-equipped to make intelligent decisions on how to integrate PlanetScale into your existing pipelines, or understand how to get started with DevOps altogether!
Feel free to explore more of our documentation to further your understanding of the platform.
Real-world scenario
DevOps is very much a "choose your own adventure" set of guidelines and that can make it confusing for teams to properly implement it given the number of choices available from code language, tooling, process, etc. The following section describes a fictitious team as they implement a new feature in their codebase. Throughout the section, we'll call out specific tools that are common in the industry to implement much of the process described in the above sections. As expected, the various features available by PlanetScale will also be described as the story progresses.
This section is about a fictitious company that uses a PlanetScale database to back its application and utilizes many of the techniques discussed in the phase-specific articles in our documentation.
Background
The story follows Mechanica Logistics, a small warehousing and transportation company with a web application that their customers can use to place new shipping orders or track the status of existing orders. Since they are a small business, its tech team has a size to match. Jenny is their Architect and Lead Backend Developer. She primarily works with the other backend developer, Ricardo, when working on their API written with Go. Malik is the team’s designer and front-end developer and he is responsible for maintaining the React web application used by customers. Finally, Ainsley is the company’s sole Systems Engineer, responsible for maintaining the AWS infrastructure performing well.
Mechanica uses the following tools in its tech team:
| Tool | Use case |
|---|---|
| Jira | Organize and assign work, and create development iterations. |
| GitHub | Source control management. |
| Slack | Team messaging and system notifications. |
| Jenkins | Builds, tests, and deploys the application updates. |
| Datadog | Provides a dashboard to monitor application and infrastructure performance. |
| PlanetScale | Hosts their MySQL databases. |
| Terraform | Automate AWS infrastructure management. |
| Atlas CLI | Perform schema migrations. |
Infrastructure
Mechanica uses AWS as its primary cloud provider, with the exception of using PlanetScale for its MySQL database. Their React front end operates as a single-page application and is stored in a dedicated S3 bucket. A CloudFront instance is used in front of it to use a custom domain name, as well as cache the front end as close to end users as possible. The API is written in Go and is running on two Linux EC2 instances in production. A technique called “blue/green” is used with the API, so one instance is always live and the other is used as the staging server.
There are three environments active at any time. A development environment is used for building and testing new functionality by the developers. A test environment is used by Jenkins to run automated tests to ensure that everything is built according to spec. Finally, there is the production environment that's used by Mechanica customers. Although there are three separate environments, a single PlanetScale database is used, with a separate database branch configured for each environment. The production database branch also has safe migrations enabled. This prevents accidental changes to the schema by enforcing the use of the PlanetScale flow, requiring that schema changes be made using branching and deploy requests.
The request
One of Mechanica’s biggest partners, Empress Products, recently experienced large unexpected growth and their shipping orders likewise increased. Due to the increase in orders, the systems at Empress were struggling to continuously poll for order status using Mechanica’s API and needed another solution. The tech team at Empress submitted a request that Mechanica figures out a way to send them updates on order status whenever things change instead. Since Empress was one of their largest customers, they decided to prioritize it and address it during the next development cycle.
Plan and Code
Early Monday morning, the team at Mechanica assembled as they do every two weeks to decide what needed to get done in this development cycle. Jada, the company project manager, was also present as usual to provide insight on the feedback they’ve gathered from Mechanica customers. Jada informed the team of the request from Empress. After some brainstorming among the technical team, they settled on building a system that used webhooks, a way to allow the systems at Mechanica to submit status updates to any HTTP endpoint at the point when an order changes, in near real-time. As the planning concluded around the new system, the team identified the following required changes:
- Update the front end to allow customers to register webhooks.
- Update the
Customerstable in the database to add columns for storing the webhook endpoints and signing keys for the webhooks system. - Create a new serverless function to process outgoing webhook messages, signing the messages and sending them to the customer endpoint.
- Add a message queue to offload messages to buffer messages between the API and serverless function to reduce API load.
- Identify anywhere in the current API that order statuses change to submit a message to the message queue.
As soon as the Sprint was created and confirmed, a Jira automation would use the PlanetScale API to create a fresh dev database branch for the team to begin working with. The most recent backup would also be specified to seed data into that branch, giving the team an isolated environment that mirrored production.
Each member of the team was assigned work relevant to their expertise. Malik built the necessary views required for the React application. This included views to create webhook endpoints, manage and delete existing endpoints, and generate signing keys as needed.
Jenny and Ricardo worked on building the backend components. The new serverless function would be written in Go and would be responsible for using the signing key to sign webhook messages and POST them to customer endpoints. The two were also able to identify where changes in the existing API code were needed to allow the API to dispatch messages into the message queue.
Ainsley takes the security of Mechanica databases very seriously and they do not give out connection strings, even to developers in case one of their systems gets infected. Due to this policy, Jenny and Ricardo proxy connections to the PlanetScale database using the pscale connect command of the CLI. When Jenny and Ricardo are working on the backend services, they simply run pscale connect to set up a tunnel to the database before they start their local development instance of the APIs. This allows the locally running instances of their APIs to connect to localhost, where the PlanetScale CLI will redirect the queries directly into the database without having to use connection strings.
The backend team also updates the schema definition file to add the new table that was required and used the Atlas CLI to apply the database changes to the dev branch of their database. This will ensure that the state of the database is always consistent and reviewable by the team (since the definition is managed by source control) instead of having developers apply changes manually and make mistakes.
Ainsley worked to build out a Terraform definition that would be used to not only create the new infrastructure components in AWS but maintain them going forward so that they didn't have to manually tweak settings as things changed over time. Along with Jenny’s help, the two of them were able to quickly update the configuration file for the API to add credentials allowing the API to submit messages to the queue, as well as deploy the new serverless function into the development environment for some live testing by the developers.
Once everything was built and manually tested by the developers, it was time to open a pull request for the monorepo and review all of the changes as a team. Since the team had been working together for several years at this point, only minimal changes needed to be made before the pull request was closed and it could move into testing.
Build and Test
At the moment the pull request closed, GitHub used a webhook to notify the Jenkins server to build the newest version of the code. Jenkins then cloned down the repo from GitHub at that specific commit where the PR was merged and compiled the API project and the new serverless function into their respective binaries and uploaded the artifacts to a dedicated AWS S3 bucket to store for usage throughout the pipeline.
Once the build stage of the pipeline was completed, it was time to move on to testing. Ainsley had previously spent weeks ensuring that the entire testing process was also automated by Jenkins. Since the team had taken a test-driven development approach to build the code, it had plenty of unit and integration tests built to ensure that the new code met the business requirements set during planning.
The process kicked off by running a Terraform command that would spin up the necessary infrastructure in AWS for testing. This would create an SQS queue in a dedicated AWS test account that could be used during integration testing to make sure the webhooks feature was built to spec. Next up would be building out the test database infrastructure.
Using the PlanetScale CLI, Jenkins would create a replica of the main production database branch by creating a new branch called test. This would automatically create an isolated MySQL environment where integration testing could be performed without affecting production. In the past, the team used to have a .sql script that would seed test data to their test branch for running this process, but more recently they’ve been using the Data Branching® feature set to restore the most recent backup of the main branch into test, creating an identical copy of their production database. To finalize the setup of the database, Jenkins would run the Atlas CLI to sync up the new table from the dev branch into test. Now the database looks exactly as it would once all of these changes make it into production.
Before running the test, the proper credentials needed to be generated and added to the project configuration. Jenkins would again use the PlanetScale CLI to generate a connection string and store it alongside the project. Next, Jenkins would use the cloned repository and run the go test command to execute all of the tests the team had written. This would not only be the unit tests that would validate business logic, but also the integration tests that would perform CRUD logic for storing and reading webhook configuration from the database, as well as simulating an order to check that the message gets processed as expected.
Once the tests have concluded and all have passed, Jenkins would use Terraform to tear down the test infrastructure in AWS and the PlanetScale CLI to delete the test branch since it is no longer required. Finally, Jenkins would once again use the PlanetScale CLI to open a Deploy request from dev into main, then notify the team using Slack so they could prepare for deploying the latest version of their application to production.
Release and Deploy
After Jenny, Ricardo, Malik, and Ainsley reviewed the test results and confirm everything went smoothly, they approve the Deploy request so PlanetScale can start synchronizing the changes from the development environment into production. Since this process uses shadow tables to effectively stage changes without making them live, the actual process of going live happens quickly and painlessly.
At this point, the latest version of the code has been thoroughly tested and the schema changes have been staged for the database. Ainsley logs into Jenkins and approves the final phase of the pipeline to deploy all of the changes to production. This kicks off a process where Jenkins utilizes deploy agents installed on the production EC2 servers to download the latest artifacts from S3, replace the old binaries, and restart the service that keeps the API alive. The script also creates the necessary SQS queue in AWS using Terraform and uses the PlanetScale CLI to apply the schema changes from the deploy request, which effectively cuts over the application to use the new version of the schema. Finally, the load balancer is updated to reroute traffic to the newest version of the application. After a week and a half of hard work, the changes are now live and can be used by Mechanica customers.
Operate and Monitor
Although the code has already gone through a rigorous testing process, it's inevitable that certain issues can occur once the application hits production as there are certain variables that simply can't be accounted for in testing. Upon deployment, Ainsley starts to monitor the Datadog dashboard configured to store the logs forwarded from AWS as well as Insights data forwarded from PlanetScale. This was important since the window to revert schema changes is open for 30 minutes, allowing for quickly rolling back changes.
The dashboard includes metrics detailing the operating capacity of the EC2 servers, network traffic, application errors, and query performance metrics. Since moving to PlanetScale, the team hasn’t had much to worry about regarding the database infrastructure since that is completely managed for them. This has freed much of Ainsley’s time to focus on optimizing the performance of other infrastructure components, so nearly all issues have been ironed out.
As the new feature started to be utilized, Ainsley did notice that some queries weren’t performing as expected based on analytical data being forwarded to Datadog from PlanetScale. Ainsley opened the Insights tab of the database to validate the data in their dashboard and indeed notice that the query for webhook configurations was performing a scan on the entire table instead of just the necessary rows. They decided to add a new issue to the Jira board to address it in the next cycle.
Although there was minor room to improve, the feedback from Empress Products on the new feature was overwhelmingly positive, and that they wanted this same functionality built into many other areas of the application. Jada took the feedback and added yet another issue in Jira to make in the future.
Conclusion
Although this story is fictional, it demonstrates how DevOps and PlanetScale can help streamline team processes and ease the pain of deploying applications into production. After reading this, you should have a better understanding of how these practices can be used within your organization.