Much of database debugging eventually turns into carefully inspecting what each connection is doing. In Postgres, this means watching pg_stat_activity in a loop. In Vitess, it means watching SHOW FULL PROCESSLIST the same way.
Tools like Query Insights are useful for exploring the recent history of queries. They can tell you what was slow, what's consuming resources, and where to spend tuning effort.
But during an active incident, the questions are more immediate. What's happening this second? Did the last thing I changed fix it?
Manual monitoring
Here's a manual version of this workflow in Postgres:
SELECT pid, state, wait_event_type, wait_event,
       now() - xact_start AS tx_age,
       pg_blocking_pids(pid) AS blocked_by,
       left(query, 60) AS query
FROM pg_stat_activity
WHERE state <> 'idle'
ORDER BY tx_age DESC;
Run it over and over again in a terminal and it's a pretty effective view of the database.
It's also a rough interface.
You're scanning rows as they move around, trying to reconstruct what's blocking progress, and hunting for the one detail that actually matters for the fix.
The worst version of this problem is when you can't connect at all because the database has exhausted all of its connections. You can't fix what you can't connect to.
That workflow shaped the design of Connections, a new feature of the pscale CLI available today for PlanetScale Postgres and Vitess (MySQL) databases.
Simpler debugging with Connections
Here's that same debugging flow using the new pscale branch connections top functionality with a Postgres database, instead of pasting that pg_stat_activity query in a loop and comparing output:
pscale branch connections top <database> <branch>
Connections opens an interactive live view that refreshes about once a second and sorts the sessions most likely to matter toward the top. There are keyboard shortcuts to navigate the list of connections and inspect each one in more detail.
Columns in the list include the Process ID (PID), status, number of blocked queries, why they're waiting, and more.
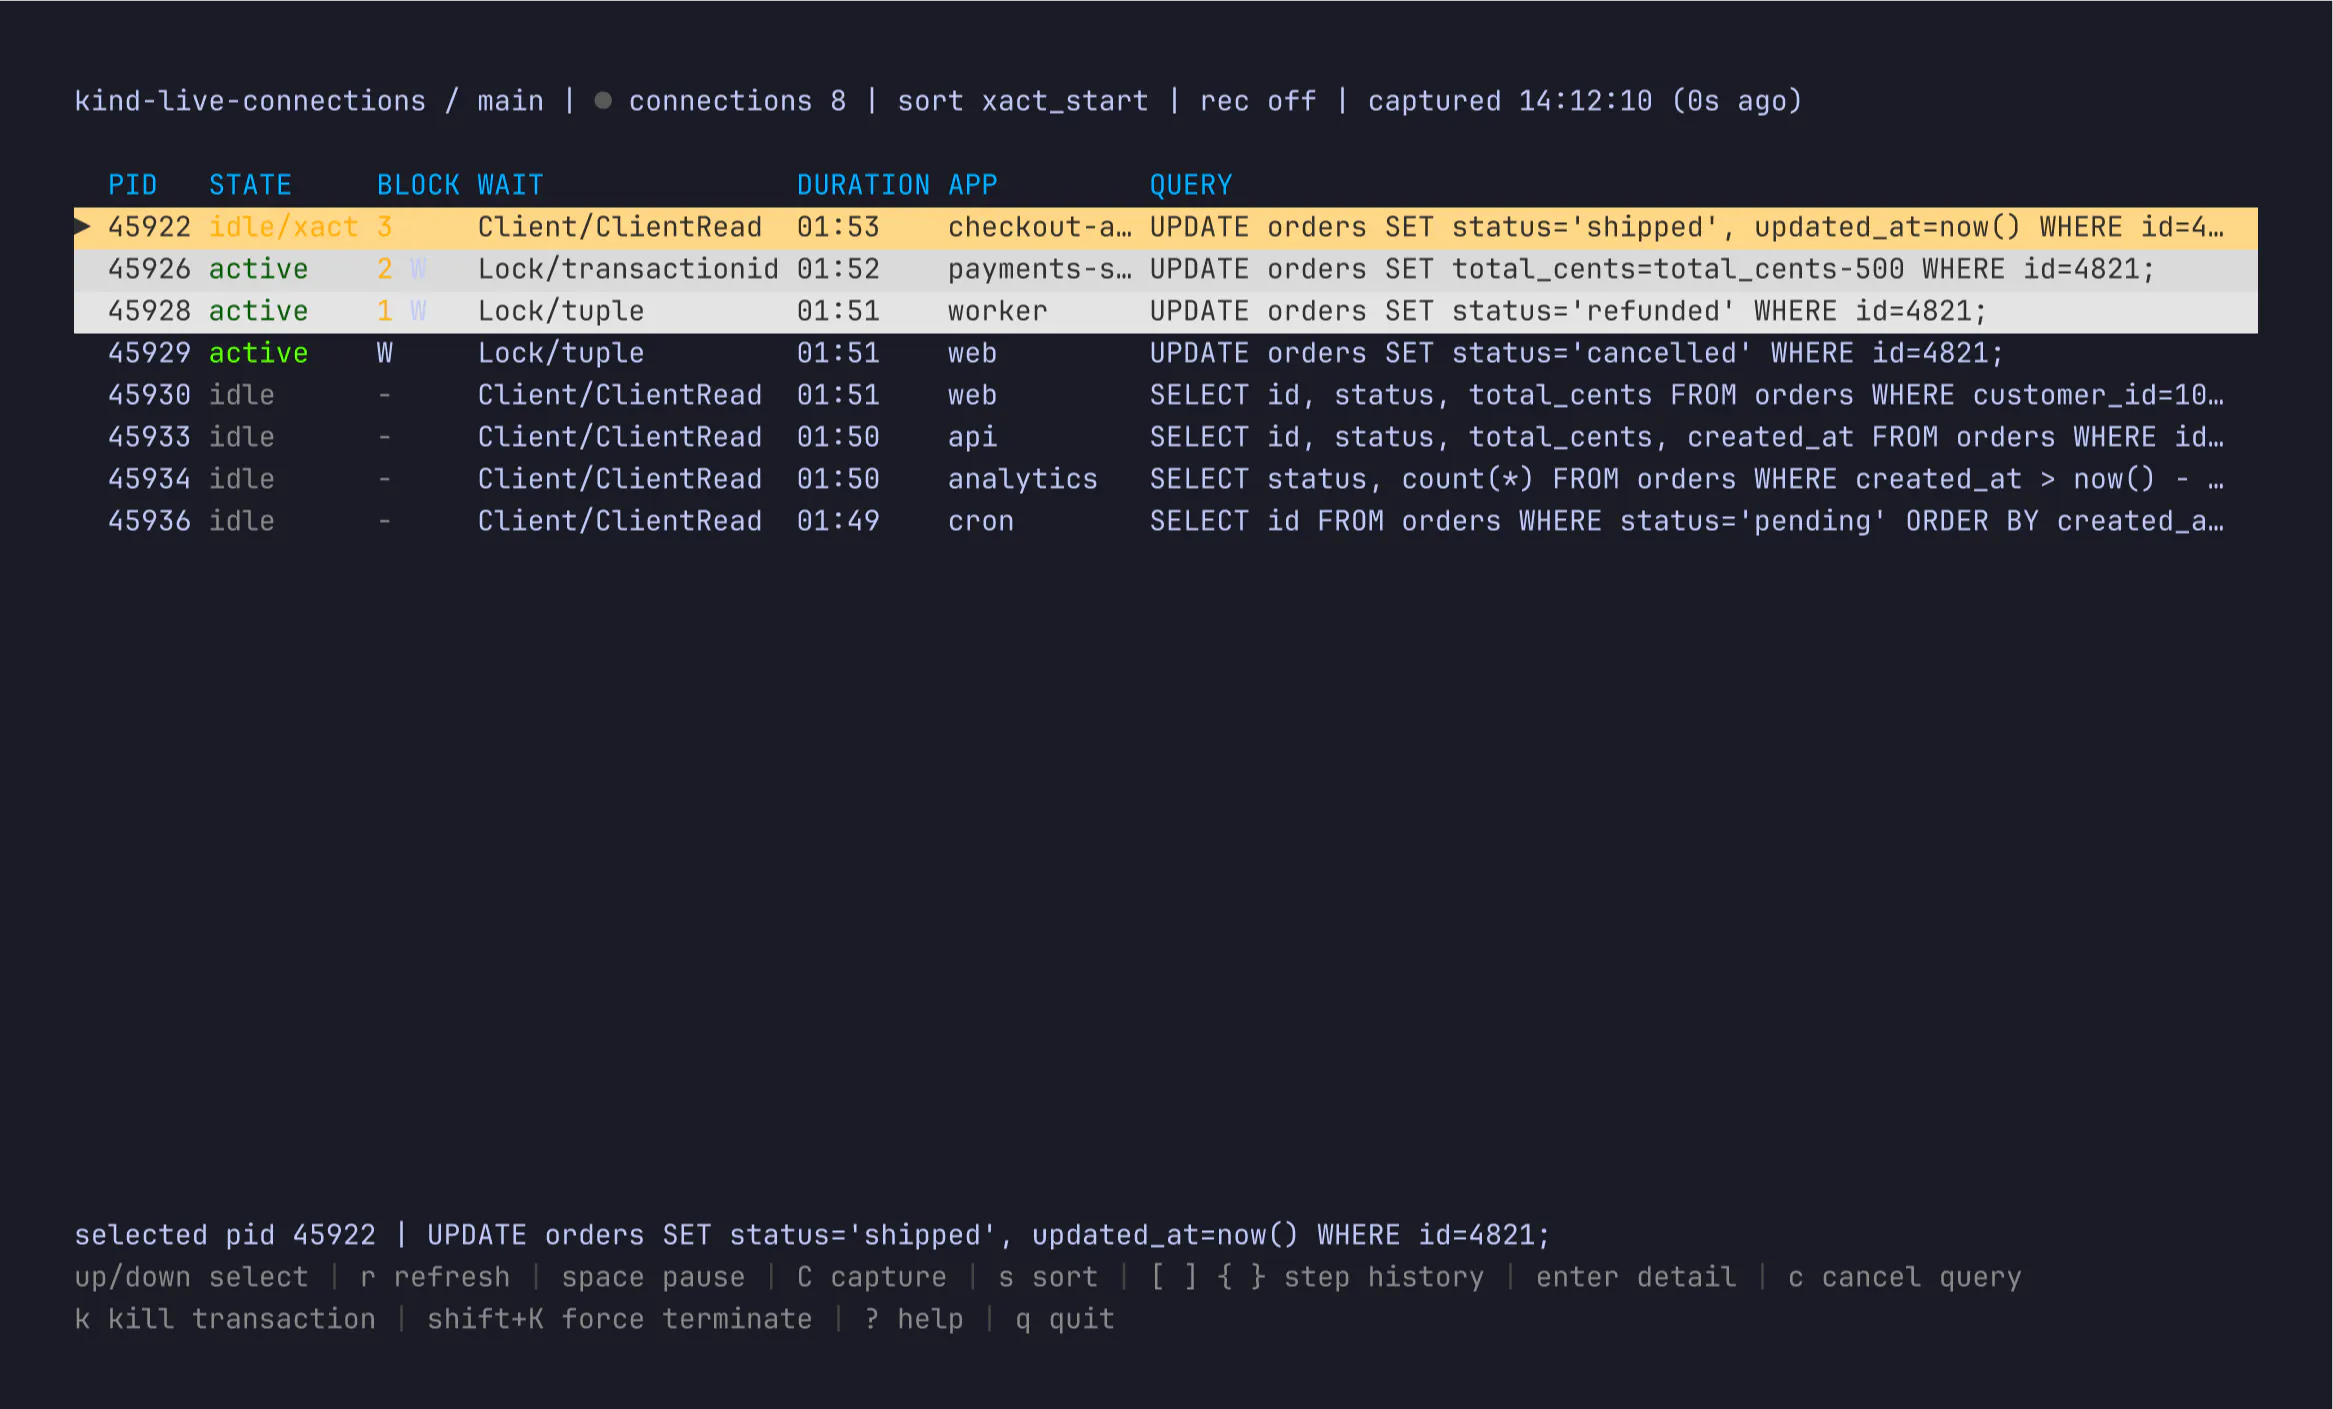
Say your writes are backing up and the app is timing out. In this example, an idle transaction from checkout-api is holding up three other writes. Open the row, and the blocker tree shows the queue behind it:
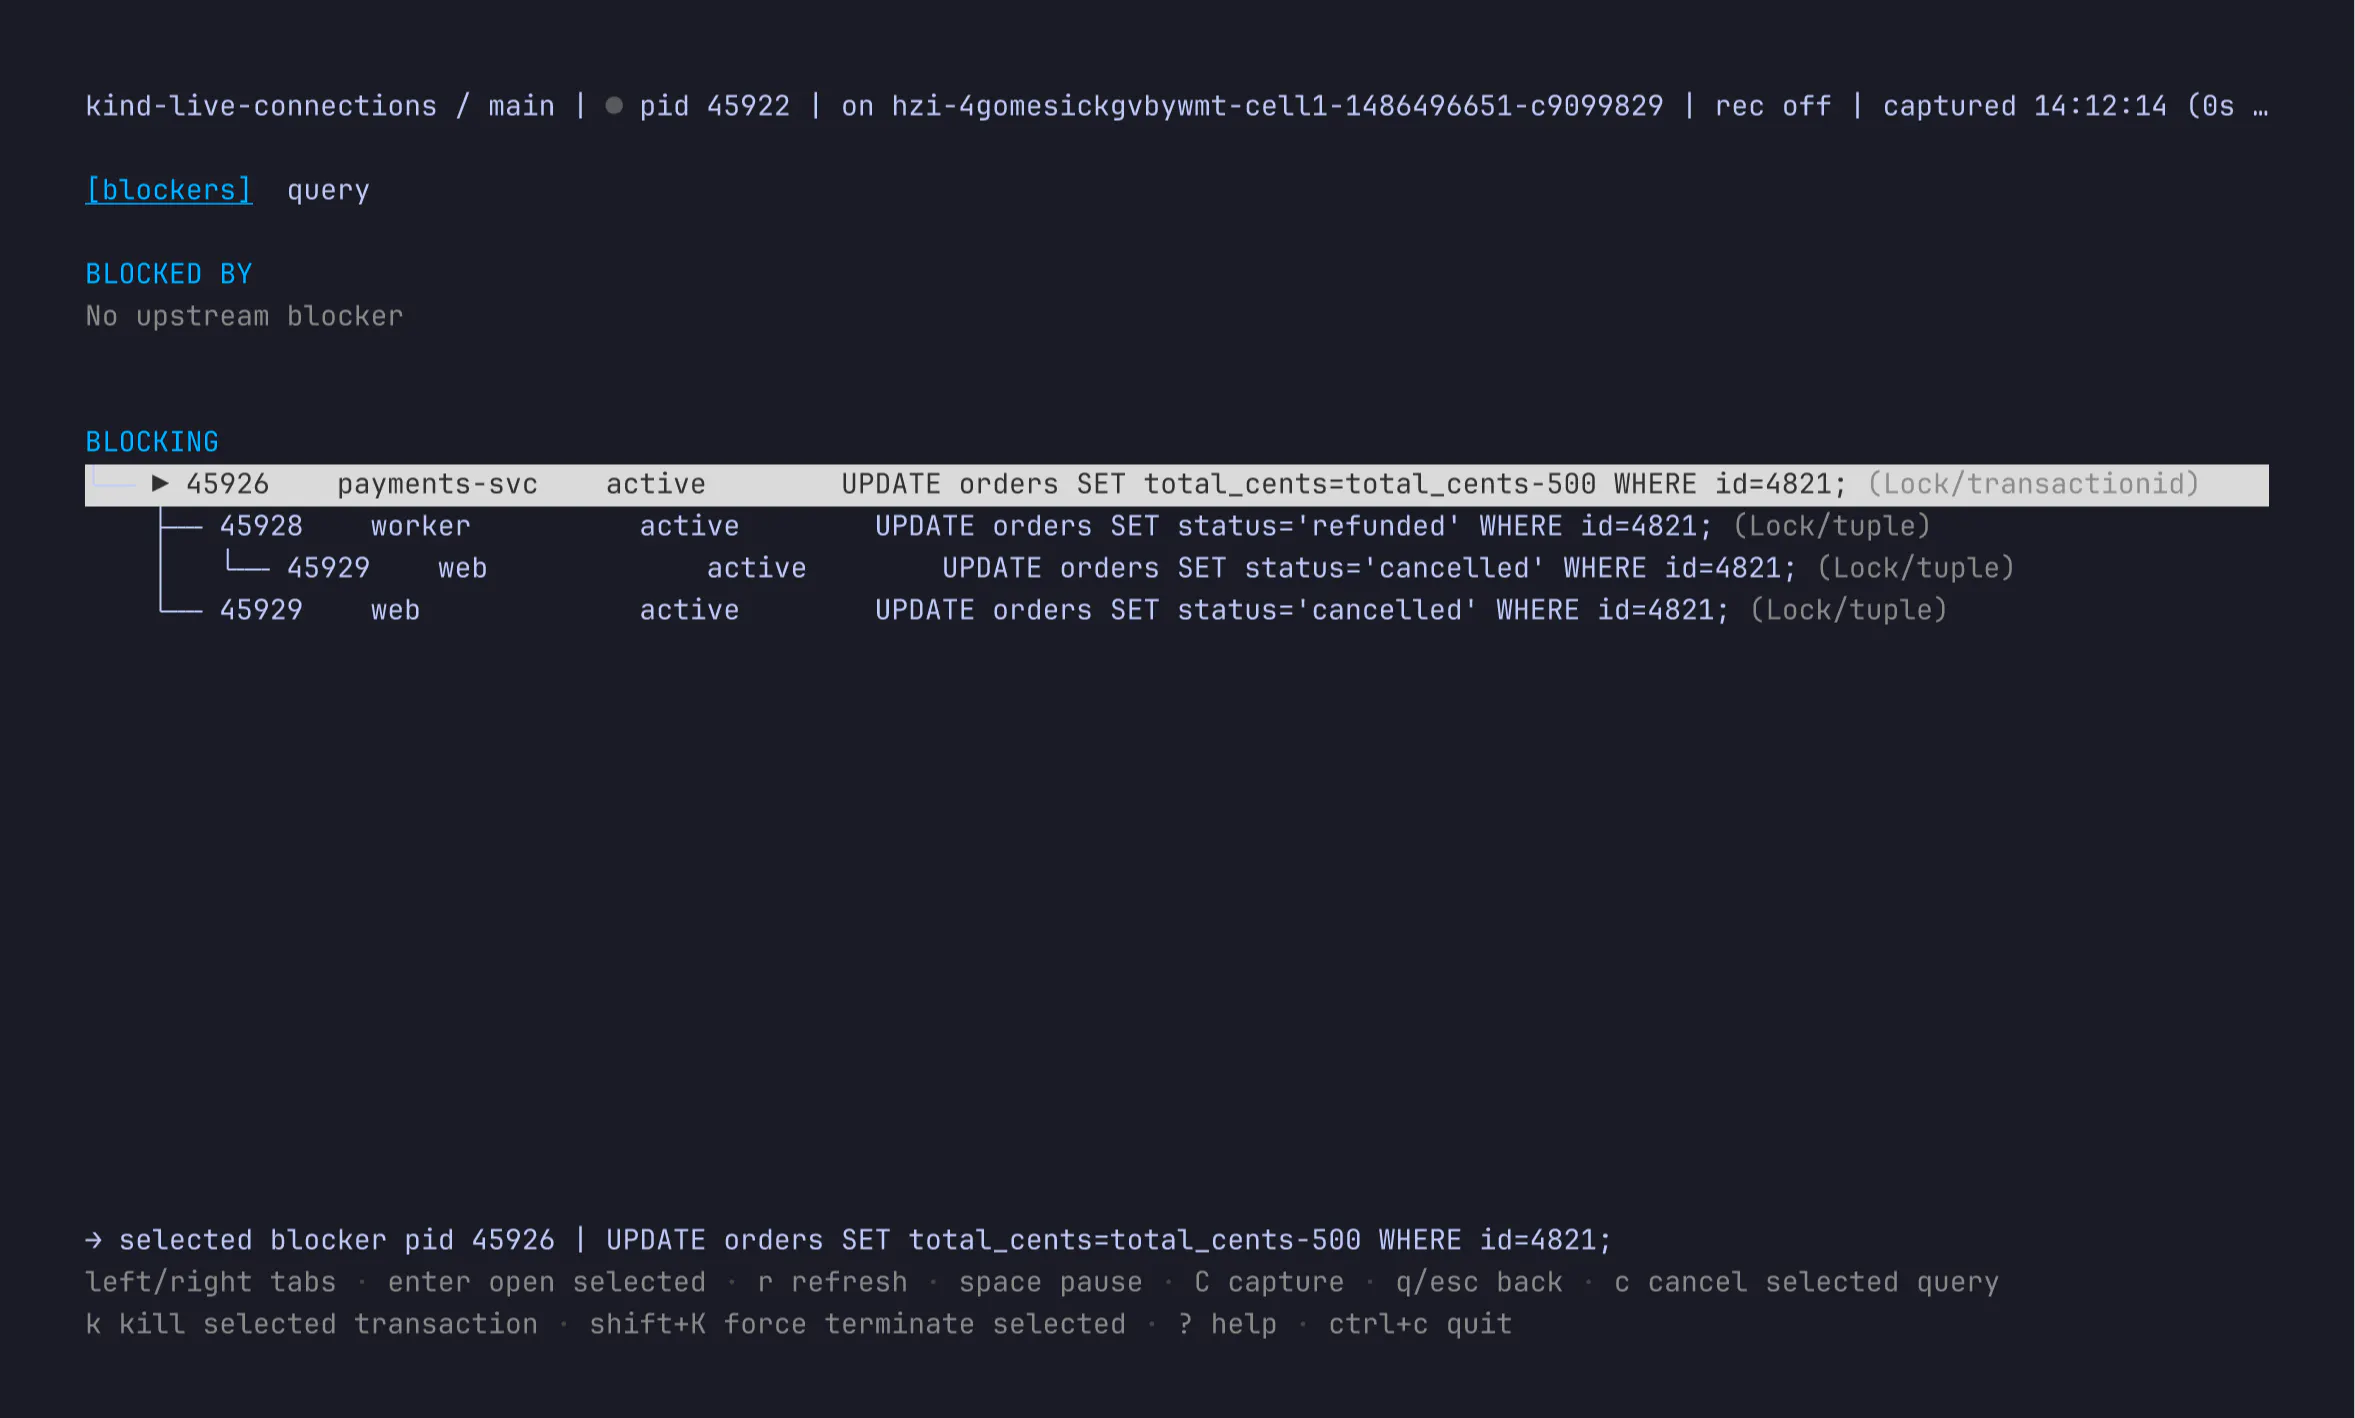
From there you can decide whether the right fix is to cancel a query or terminate the connection. You no longer need to remember the syntax of pg_stat_activity, retrace the blocker chain by hand or copy and paste PIDs around.
Keep enough history to see the pattern
Another problem with running that query in a loop is that the interesting moment flies by. Connections keeps a recent rolling history, so you can pause, step forward and backward with [ and ], and see how the state has changed.
You can also capture a session to a file. You can record everything you see in Connections by pressing C. This includes the recent history already buffered in memory and keeps appending from there. Perfect for handing off logs to agents to assist with debugging.
That also makes it easier to write a postmortem, share what happened with a teammate, or replay the same view later instead of describing it from memory.
Available even when connections are exhausted
The stress of debugging an active incident is worse when you can't even connect to the database yourself.
Connections uses a reserved administrative connection, so the inspection path still works when regular application connections are exhausted.
Managed databases should remove the need to SSH into a box, not remove your ability to debug an incident.
You can still get in, see what is running, and act from there.
For Postgres and Vitess
The PlanetScale CLI's new Connections feature also works with Vitess databases (MySQL). In this case, the live view is the PlanetScale version of watching SHOW FULL PROCESSLIST, with the ability to cancel the current query or terminate the connection from this unified interface.
The main difference is scope. Vitess connections are shown for one keyspace (and one shard) at a time. If a branch has multiple keyspaces, or a sharded keyspace, pass --keyspace and --shard to choose the tablet:
pscale branch connections top <database> <branch> --keyspace <keyspace> --shard <shard>
The same live monitoring, pause, history, capture, and replay workflow applies. The actions are MySQL-specific: canceling a query runs KILL QUERY, and terminating a connection runs KILL. See the Inspect live Vitess connections guide for the full command behavior.
Try it today
Connections is available for PlanetScale Postgres and Vitess. Update to the latest version of pscale and run:
pscale branch connections top <database> <branch>
See the CLI reference, the Inspect live Postgres connections guide, and the Inspect live Vitess connections guide for more details.
Try it next time you need to troubleshoot active database connections.