Overview
Thepscale branch connections command shows what is happening inside a Postgres database branch right now, including which
sessions are active, which queries are running, what they are waiting on, and which connections are blocking others.
If something is stuck, you can cancel the query or terminate the connection directly.
It is the live equivalent of reading pg_stat_activity on a self-managed Postgres, with the ability to act on what you
find. This guide covers Postgres branches; the same command works for Vitess branches, with the differences described in
Inspect live Vitess connections.
There are two ways to use it:
- Interactively, with
pscale branch connections top— a terminal UI for watching activity live, drilling into blocker chains, and taking action from the keyboard. - From scripts or AI agents, with
pscale branch connections showplus thekillandkill-transactioncommands — one-shot, structured output designed to be safe to automate.
connections CLI reference.
Watch live activity with top
Run top in an interactive terminal to launch the live view:
space to pause. You can also scrub back through the recent in-memory
history without leaving the live view: [ and ] step one sample at a time, { and } jump to the oldest or newest,
and } returns to live-follow.
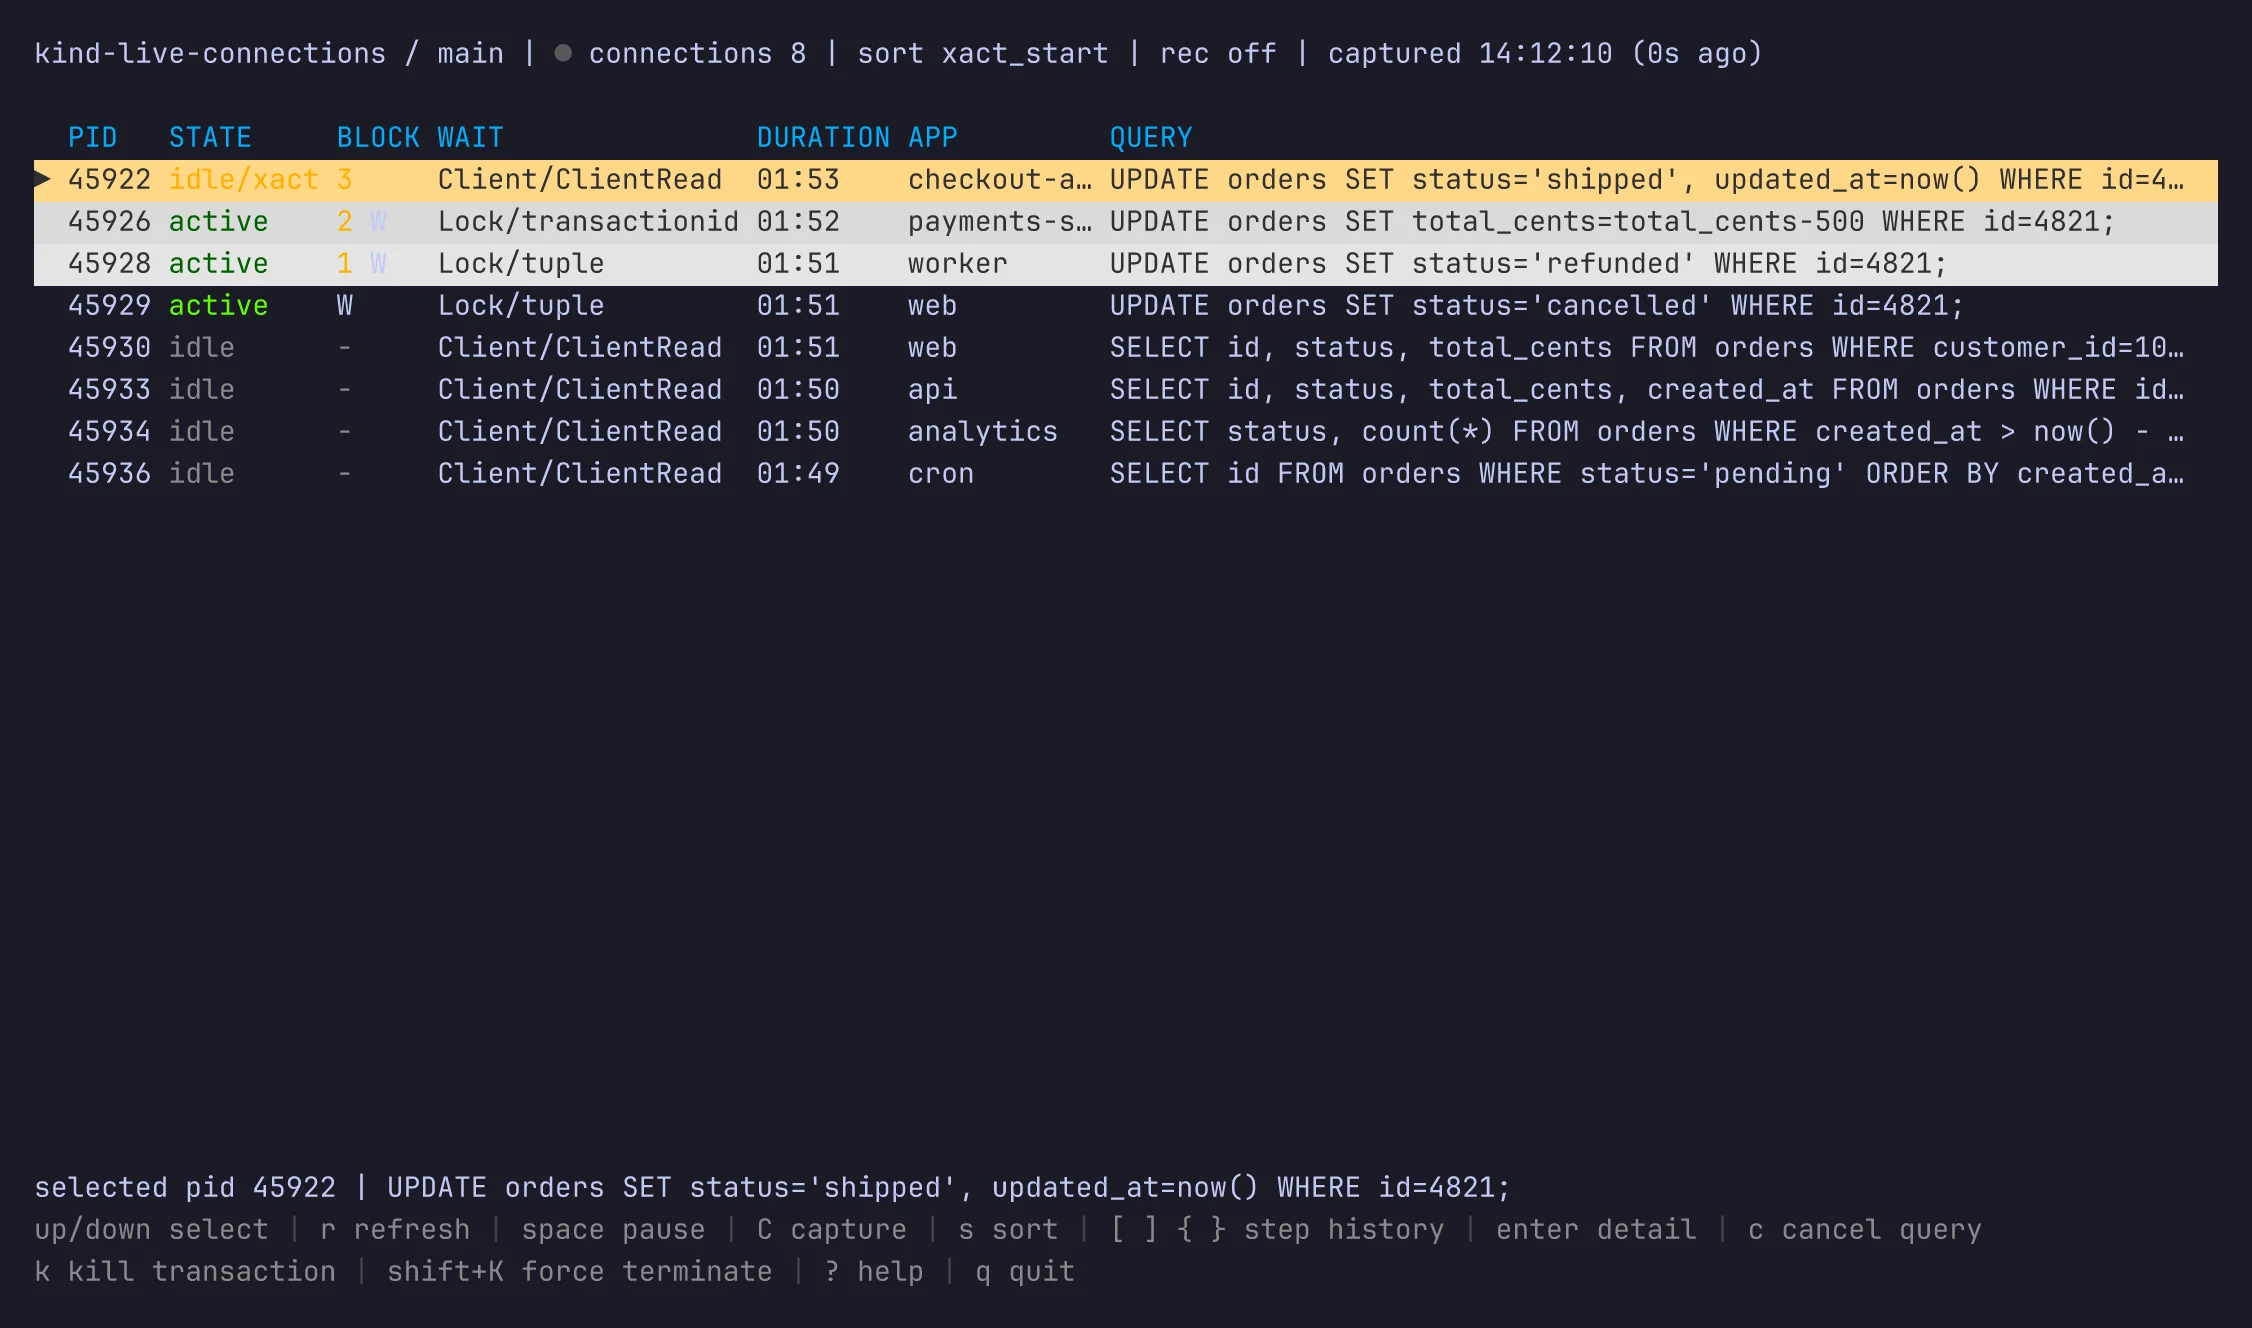
Reading the table
Each row is one Postgres backend connection. The columns are:
State is color-coded so trouble stands out: active queries read clearly, idle sessions are muted, and idle-in-transaction
sessions are highlighted because they tend to hold locks. Rows that are blocking other sessions are
shaded more heavily as the blocking chain deepens.
Press
s to cycle the sort order between transaction start, duration, and blocking impact.
Header and freshness
The header shows the target (database / branch), a live connection count, the current sort, and how fresh the data is
— for example captured 17:10:46 (2s ago). If the data ages past a few refresh intervals it turns yellow, and if it becomes
badly stale it turns red, so you always know whether you are looking at the current state. When you pause, the header
still shows the data’s real age and adds a paused indicator.
If some instances in the branch are unreachable, a banner reports how many, and the rest of the rows still load.
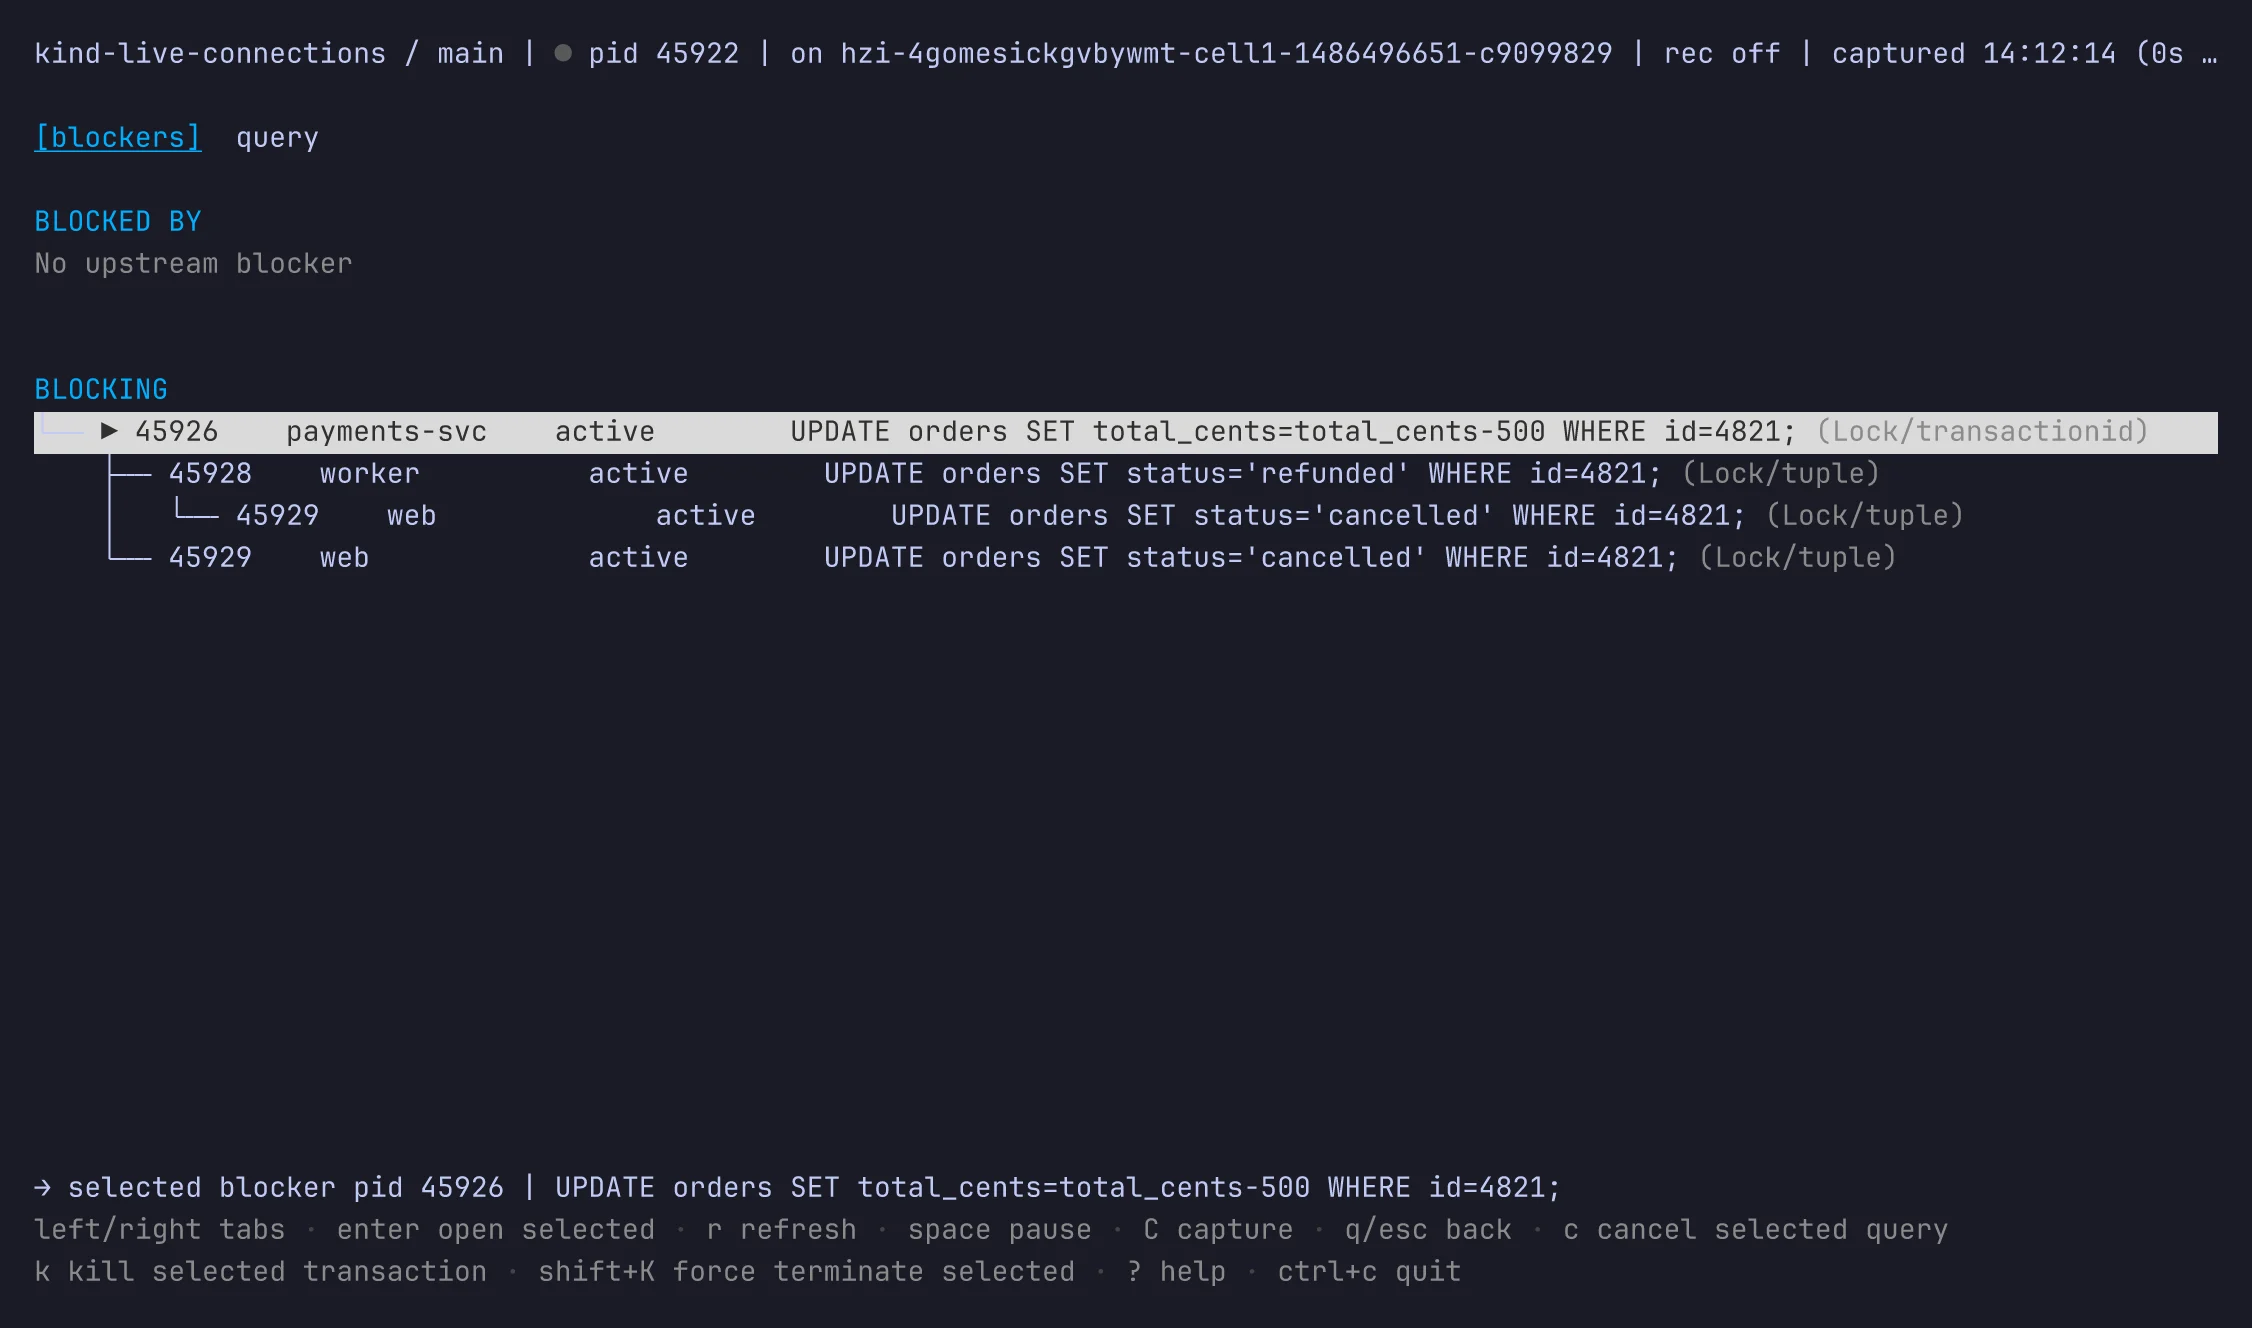
Drilling into blockers
Pressenter on a row to open the detail view. It has two tabs:
- Query — the connection’s full metadata and complete query text, scrollable and never truncated.
- Blockers — the blocking graph: what this connection is blocked by upstream, and what it is blocking downstream.
left and right switch between the two tabs, and b jumps straight to Blockers. From the
table you can also open a row directly onto a tab: v opens it on the Query tab and b opens it on the Blockers tab.
On the Blockers tab, press enter on a session in the chain to re-center the detail view on it, so you can walk a lock
wait all the way to its root cause. Press esc to go back, and ? at any time for the in-app key reference.
Capture and replay
You can record a session to a trace file and review it later:C to start or stop capturing on the fly. A capture started this way includes the recent
history already buffered in memory — up to the last 300 samples, about five minutes at the default refresh interval —
not just from the moment you pressed C, so you keep the lead-up to whatever you just noticed. The same [ ] { }
history keys work in replay to move through the recording.
When you start a capture with
C and did not pass --capture, pscale writes the trace to
connections-<timestamp>.jsonl in the directory you launched from. These files hold the full buffered history, so
they can reach a few megabytes. Clean them up or pass --capture <path> to control where they land.Take action on a connection
connections offers three actions, ordered by how much they disrupt the client — from cancelling one query to dropping the whole connection:
In the TUI, the action applies to the selected connection (or, on the Blockers tab, to the highlighted session in the
chain).
Every action verifies it is hitting the connection you saw. Each one carries a guard from the snapshot: cancel
query checks the query, kill transaction checks the transaction’s start, and force terminate checks the connection’s
backend start. So kill transaction only fires if that exact transaction is still open — if it has committed or rolled
back, the action is rejected and you re-list and try again. Force terminate has no such transaction check. It drops
the connection no matter what it is now running while confirming the backend is the same one you saw. Reach for kill transaction
first; use force terminate when a connection is fully idle or you specifically want to drop it.
show again to confirm the outcome either way.
Inspect and act from scripts or AI agents
For automation — including AI agents that cannot drive an interactive UI — useshow with --format json, then act
with the server-issued IDs it returns.
captured_at, the instances in the branch, and the connections. Each connection
carries opaque query_id, transaction_id, and connection_id fields. Pass those to the action commands:
1
Show
Run
show --format json to get the current snapshot.2
Inspect
Read the row you care about.
connection_id is always present; transaction_id is null when the connection has
no open transaction. So an idle connection can be ended with kill but not kill-transaction.3
Explain and confirm
For a destructive action, describe what you are about to do and get a human’s approval before running it.
4
Act once
Run exactly one action command, targeting the connection by its server-issued ID.
5
Verify
Run
show again to confirm the result.show again and retry.
Permissions
Access to Connections is tied to your user account and your role on the database, and what you can do depends on whether the branch is a production branch. It is available to signed-in users (for the CLI, authenticate withpscale auth login), not to service tokens.
There are two levels of access:
- View — see the connection list and the
topview. - Act — cancel a query or terminate a connection.
In short: any organization member can view and act on development branches; viewing a production branch requires Analyst or higher; acting on a production branch requires Administrator.
Database Administrator access can be granted directly or through a team — everyone on a team that includes the database has Database Administrator access to it.
If you do not have the required role, the command returns a permission error (HTTP 403) for the action you attempted. See Access control for the full role and team model.
How fresh the data is
connections polls about once per second, and snapshots are cached for roughly a second on the server, so the data
you see can be up to about a second old. The captured_at timestamp (and the freshness indicator in the TUI header)
always tells you exactly how old the current snapshot is. After you take an action, you may briefly see the connection
in the next show because of that caching window; run show again a moment later to confirm.
If the server is briefly busy refreshing its view, show retries automatically for a couple of seconds. If it still
cannot get fresh data, you see server is warming up, please retry in a moment.
What the data maps to
If you know Postgres, these map to what you would expect:- A connection (or session) is a Postgres backend process, identified by its
PID. - A query is the statement that connection is currently running. Cancel it with
kill --query. - A transaction is the open transaction on that connection. End it with
kill-transaction. - A blocker is a connection holding a lock that another connection is waiting on. The
BLOCKcolumn and the Blockers tab show these relationships. - An instance is a database server in your branch — your primary and any replicas.