Analyzing the performance of your database can be a tricky business. Even if your database is healthy and the majority of queries are fast, a handful of slow or improperly indexed query patterns can frustrate your users or spiral into bigger problems as your dataset and traffic grow.
To help developers identify and troubleshoot problematic queries, PlanetScale Insights now shows time-series metrics on a per-query pattern basis.
Query patterns
The fundamental unit of analysis in Insights is a query pattern, so it's worth discussing how and why Insights defines this concept. As you probably know, relational databases receive queries in the form of SQL statements:
select * from users where id = 123
Because PlanetScale databases often receive thousands or even millions of queries per second, reporting performance stats for every individual query isn't usually what we want. Instead, we'd like aggregate data for similar queries over time. It's better to know “This is how long id-based user lookups took over the last hour” versus “This is how long it took to look up user 123.”
To establish what queries should be grouped together, we use Vitess's SQL parser to find a normalized pattern for every query. The Vitess query serving layer converts SQL into an abstract syntax tree, which we then walk to replace literals with generic placeholders. Applied to the query above, we find the following normalized representation.
select * from users where id = ?
Beyond literal extraction, Vitess's AST normalization also helps eliminate surface-level syntactic differences, such as casing differences or the presence of redundant parentheses. With the normalized query in hand, we can calculate a fingerprint (a hash of the normalized SQL) and use it to group queries and emit aggregated telemetry, such as the number of queries, total execution time, and total rows read, returned, and written. We also send along a sketch of query execution times that allows us to show error-bounded percentiles (e.g., median and p95).
Time-series query data in action
To get an idea of how this data is useful, let's walk through a situation where PlanetScale engineers used this feature to troubleshoot a query in our primary production database.
As a matter of regular maintenance, we regularly review the most expensive and frequently executed queries in our production database. During this process, we noticed the following query, which deletes chunks of expired rows from a fairly large table. From the main Insights tab in PlanetScale, this query takes approximately 8 seconds to run on average.

Clicking on this query, we see a graph of performance (median and p95 latency) over the last 24 hours. Looking at the median and 95th-percentile query latency data, we see an interesting pattern:
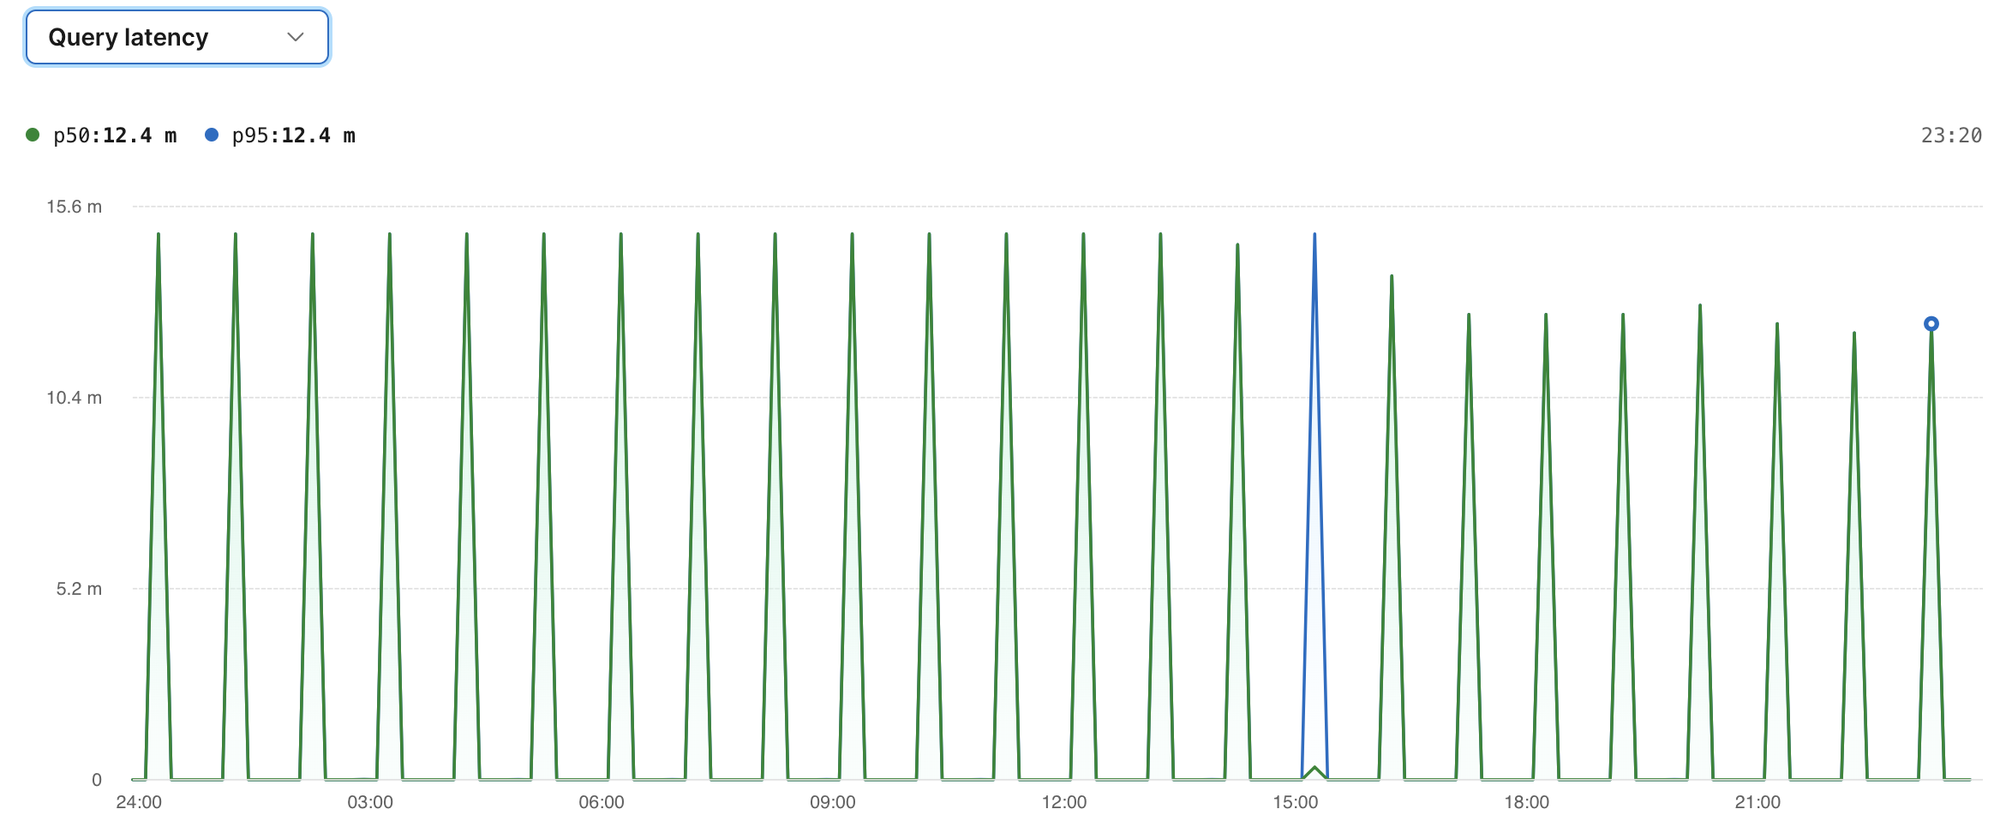
The background jobs to delete expired data are kicked off at 10 past the hour. For the first 10-minute period after the kickoff (10–20 past the hour), the mean and p95 latencies are fairly low — a few hundred milliseconds. In the next bucket (20–30 past the hour), however, the execution times explode to almost 15 minutes. There's definitely room for improvement here!
The query in question is a delete with a where clause and a limit that specifies only the first n should be deleted. The limit is added to avoid long-running deletes that could slow down other queries. In our case, the limit is set to 500. When the hourly run starts, there are many rows that meet the conditions in the where clause, so the first 500 matches are found relatively quickly. As the job progresses, and more and more of the matching rows have already been deleted, it becomes more expensive to find deletable rows. Toward the end of an hourly run, the query approaches needing to do a full table scan for each execution. Since there are over 100 million rows in the table, this operation becomes untenably expensive.
So what can we do to speed this up? Add an index, of course! Adding an index to the minute column lets the database quickly identify and delete the rows that match the where clause. Since we're using PlanetScale, it's easy to add an index without a performance hit or downtime while the index is building, even on busy tables with hundreds of millions of rows. After opening a deploy request with the index, getting approval from our team, and clicking “deploy changes,” our database starts building the index. When it's finished, we see a deploy marker on the query latency graph, labeled #505 — our 505th deploy request to this database. From this graph, we can confirm that query latencies have dropped so dramatically that they're not even visibly discernible from zero on the graph: 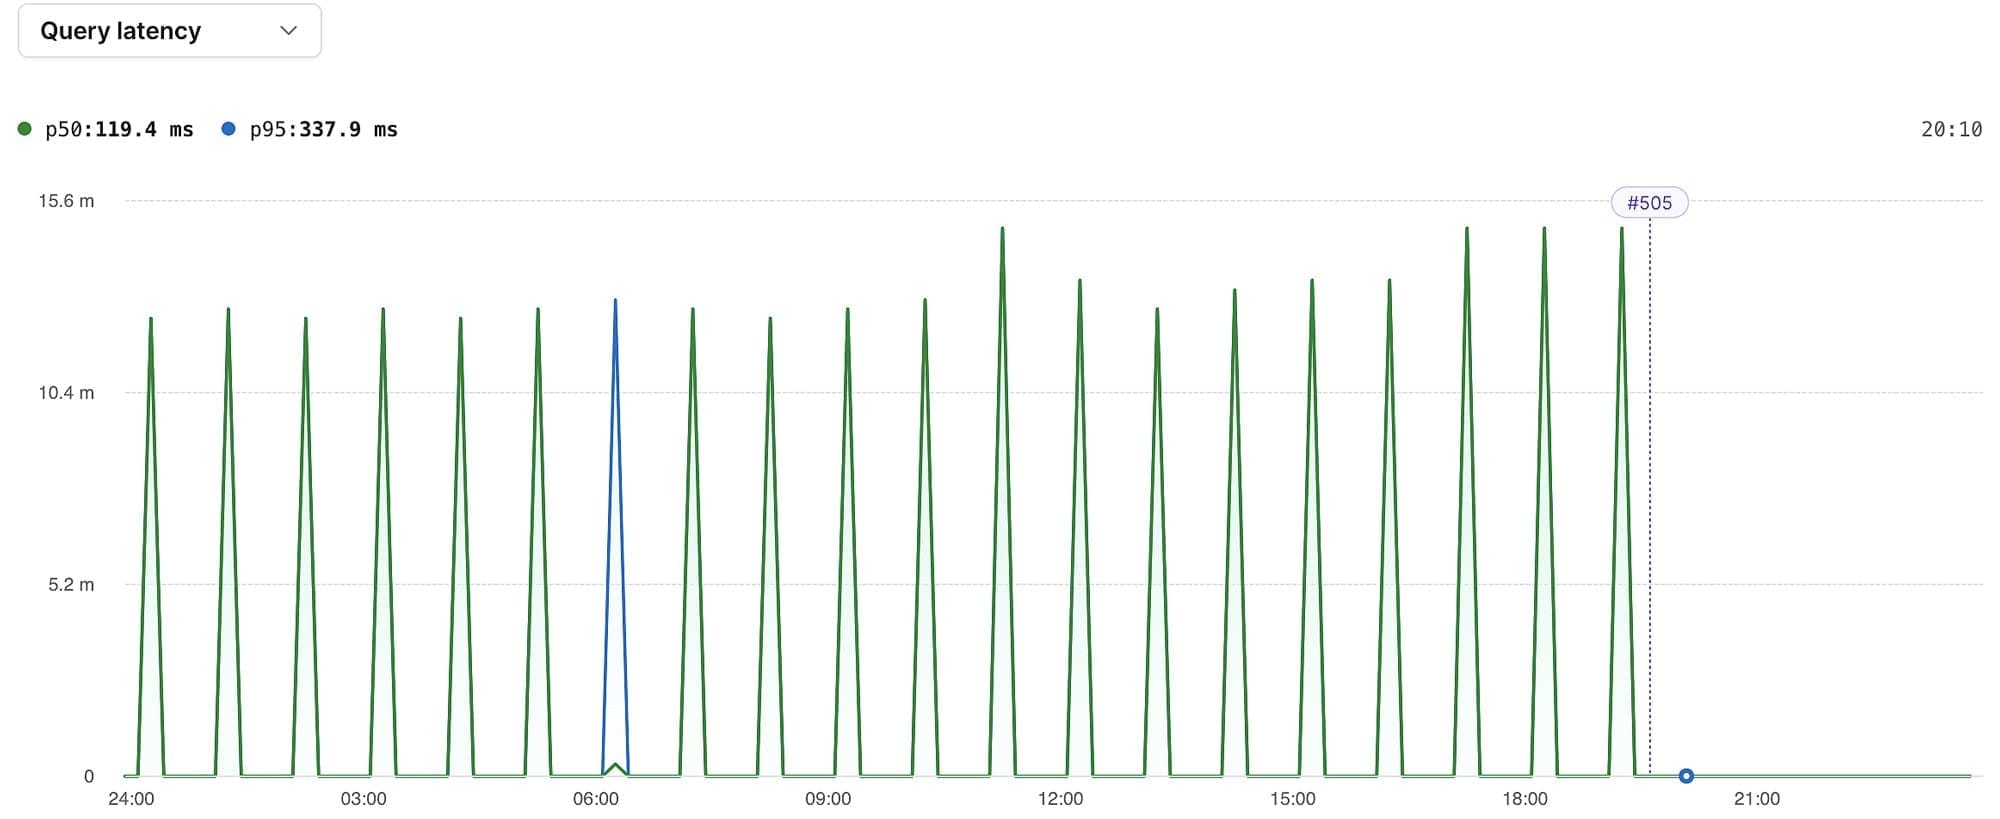
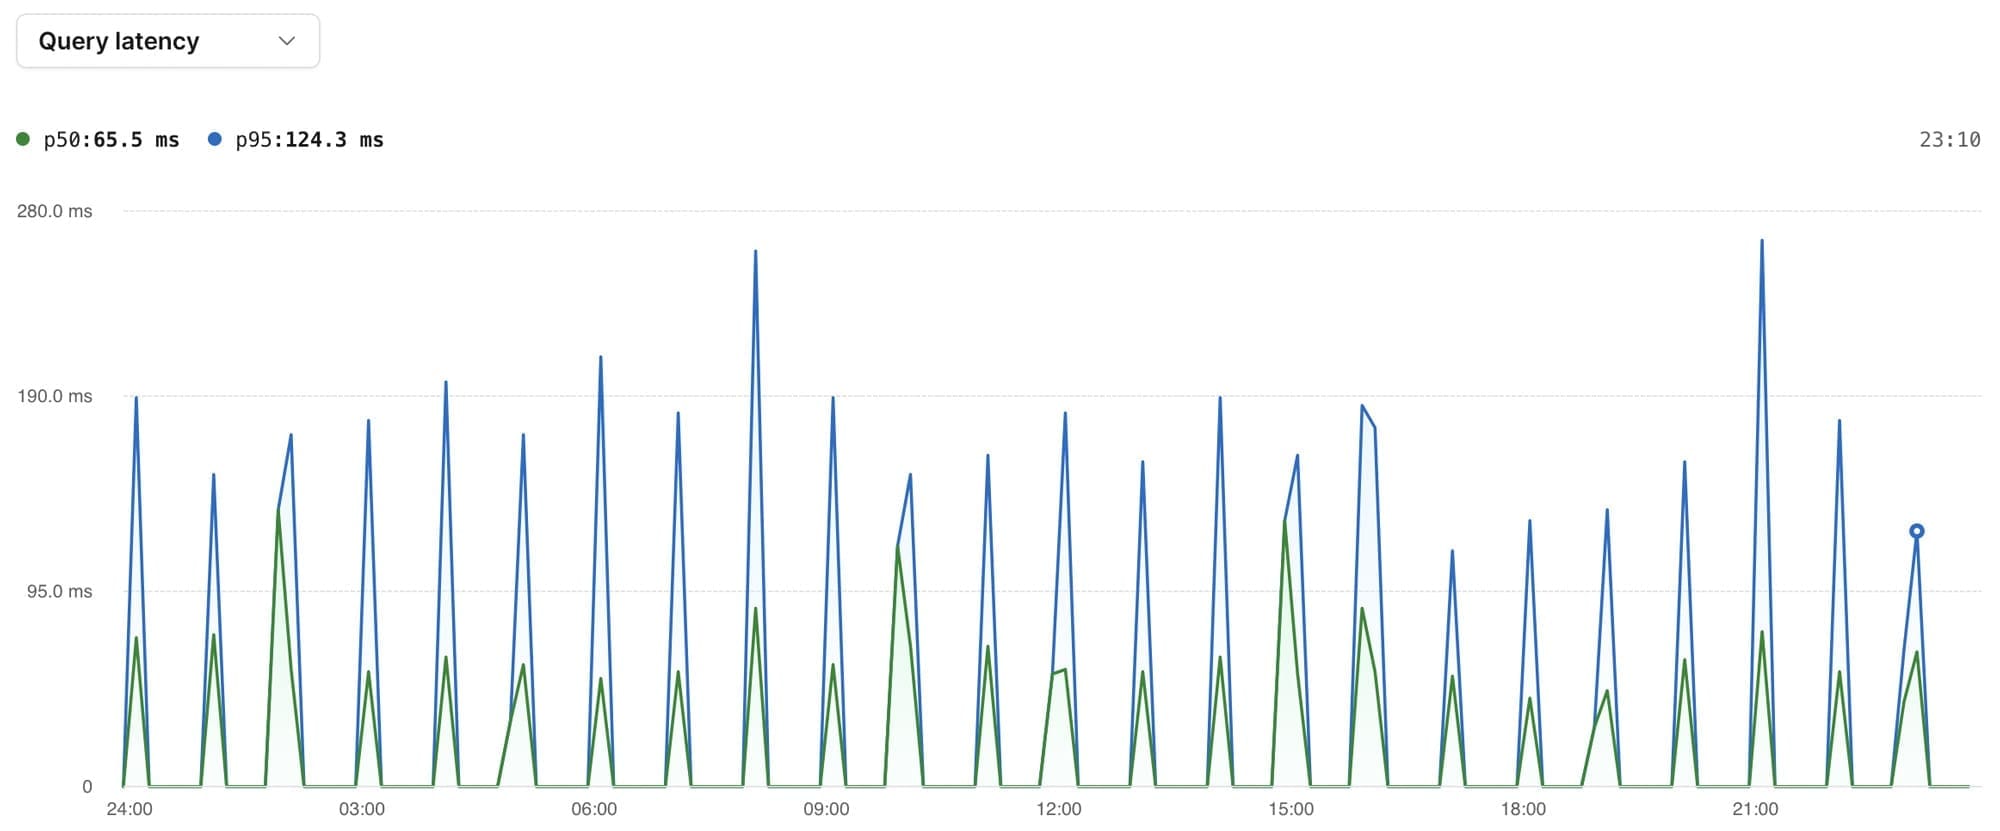
If we fast forward to the next day, we see that query latencies are consistently under a few hundred milliseconds. Success!
Try it out now!
We've found that the ability to easily analyze time-series data for query patterns is a powerful tool for identifying and troubleshooting performance issues. Having this ability automatically built into your PlanetScale database makes it easy for teams of all sizes to decide where and when to optimize their database usage.
To see query pattern metrics in your database right now, click on a query from the table in your databases' Insights tab. Try it out, and let us know what you think!
For more information, check out the Insights docs.