Pulling back the curtain: the new database overview page
By Holly Guevara |
Have you ever wondered what's actually under the hood of a PlanetScale database? Starting today, you no longer have to wonder! We just released a huge update to your database overview page in the PlanetScale dashboard.
The power of PlanetScale
Our goal at PlanetScale has always been to provide the most powerful, yet easy-to-use database that "just works." We've packed a ton of power under the hood, and with this newest release, we're pulling back the curtain to make it clear exactly what you're getting with your PlanetScale database.
To start, we've moved some elements around so you now have a complete overview of the state of your database, database health, and important metrics, all on a single page:
- Recent deploy requests
- Query insights graph including latency, QPS, rows read/written, and errors
- All queries during the last 24 hours
- If safe migrations is enabled
- If the selected branch is production or development
Tip
The "Connect" button where you previously found your connection strings is now labeled "Get connection strings".This view is included for every branch of your database. You can select which branch you want to view from the dropdown in the top left of the interactive diagram.
In addition, we've added some new information: load balancers, primary, replicas, and shards. Let's dive into each of these.
Load balancers
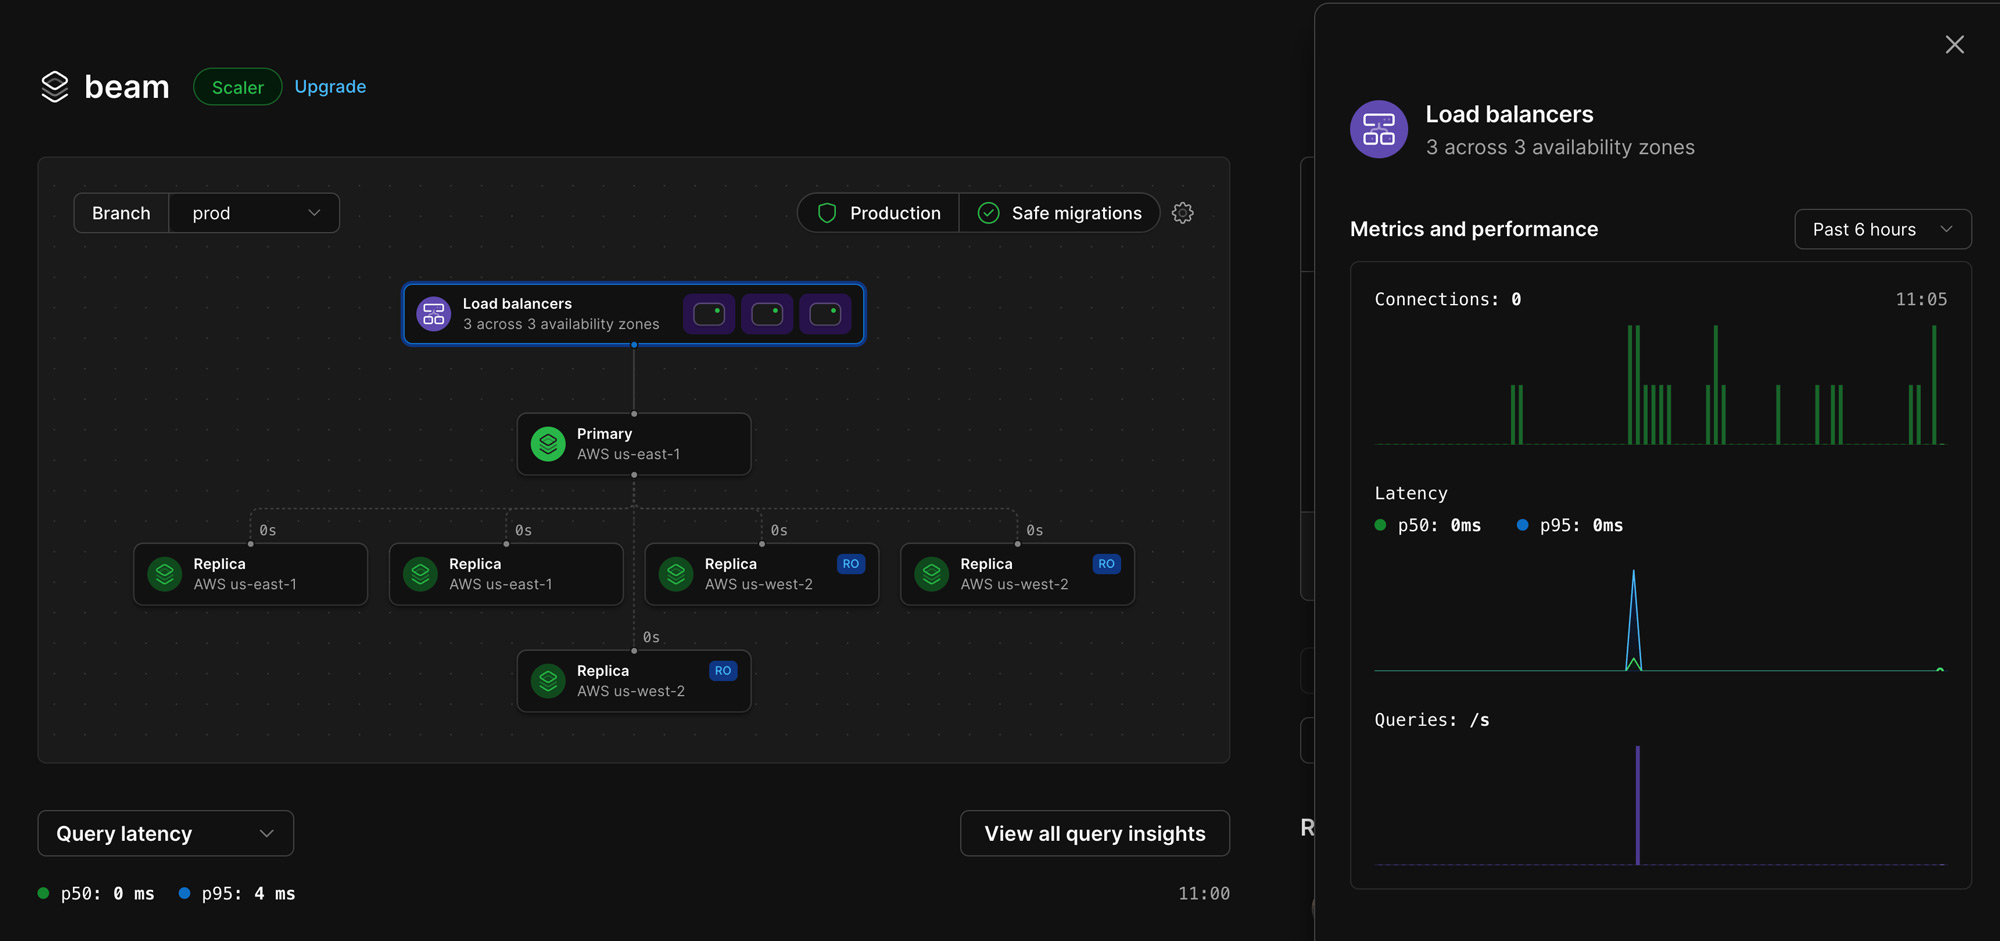
In the diagram on your database overview page, you'll see the number of load balancers included with your database as well as the number of availability zones.
Click on "Load balancers" to see a more detailed breakdown of metrics and performance: number of connections, latency, and queries per second.
Primary, replicas, and read-only regions
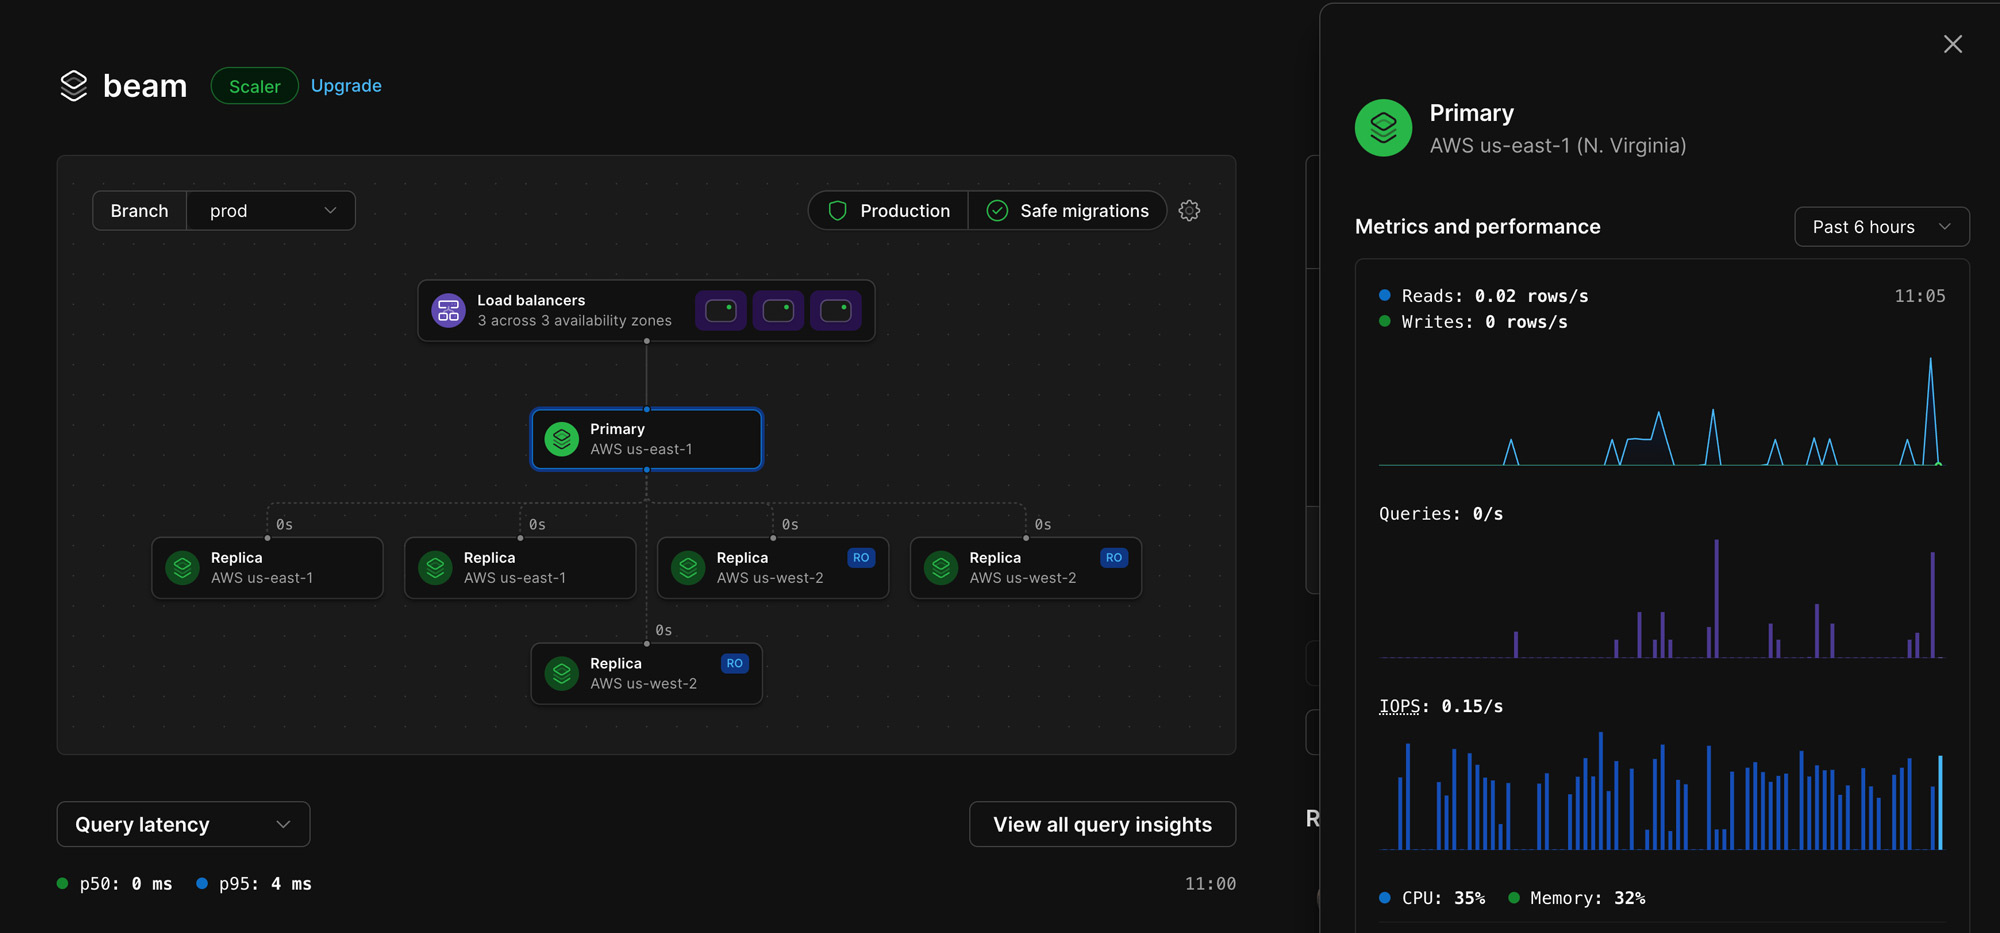
Underneath "Load balancers" in the diagram, you'll see it branching down to your primary database. Here, you can see which region your primary database is in, and if you click on that, we show you some more metrics for your primary database: reads/writes per second, queries per second, input/output operations per second, CPU, and memory.
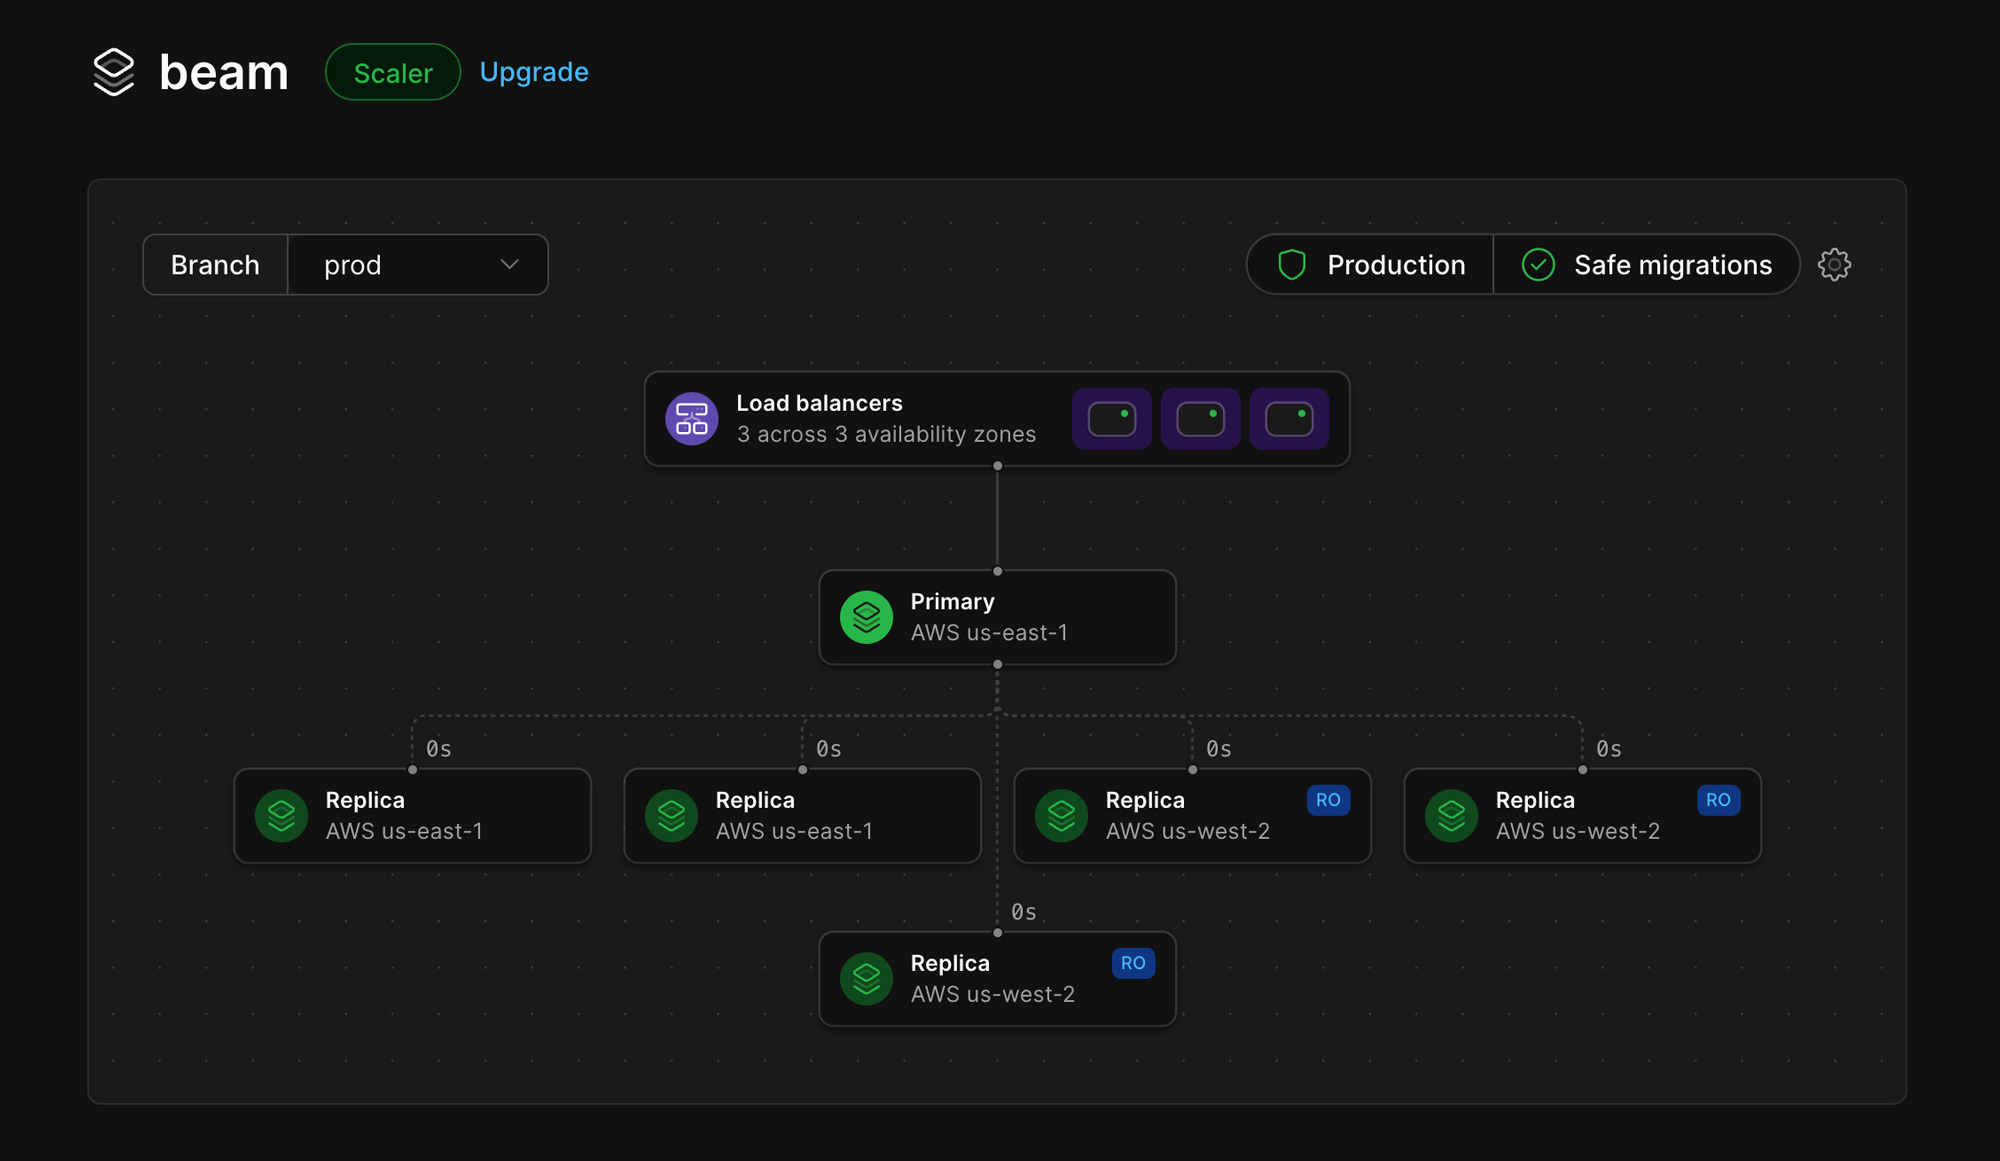
Below the primary database, you'll see branches down to all replicas. Every production branch in a database comes with at least one replica. You can click on each replica to check the performance of those as well.
Note
This diagram reveals why we recommend using a production branch for your production workloads. Production branches include additional replicas and load balancers to handle the increased workload of your production database.Above each replica (0s in the image below), you can see the replication lag.
Additionally, if you have read-only regions, those will appear in the diagram as well with the label "RO".
Sharded databases
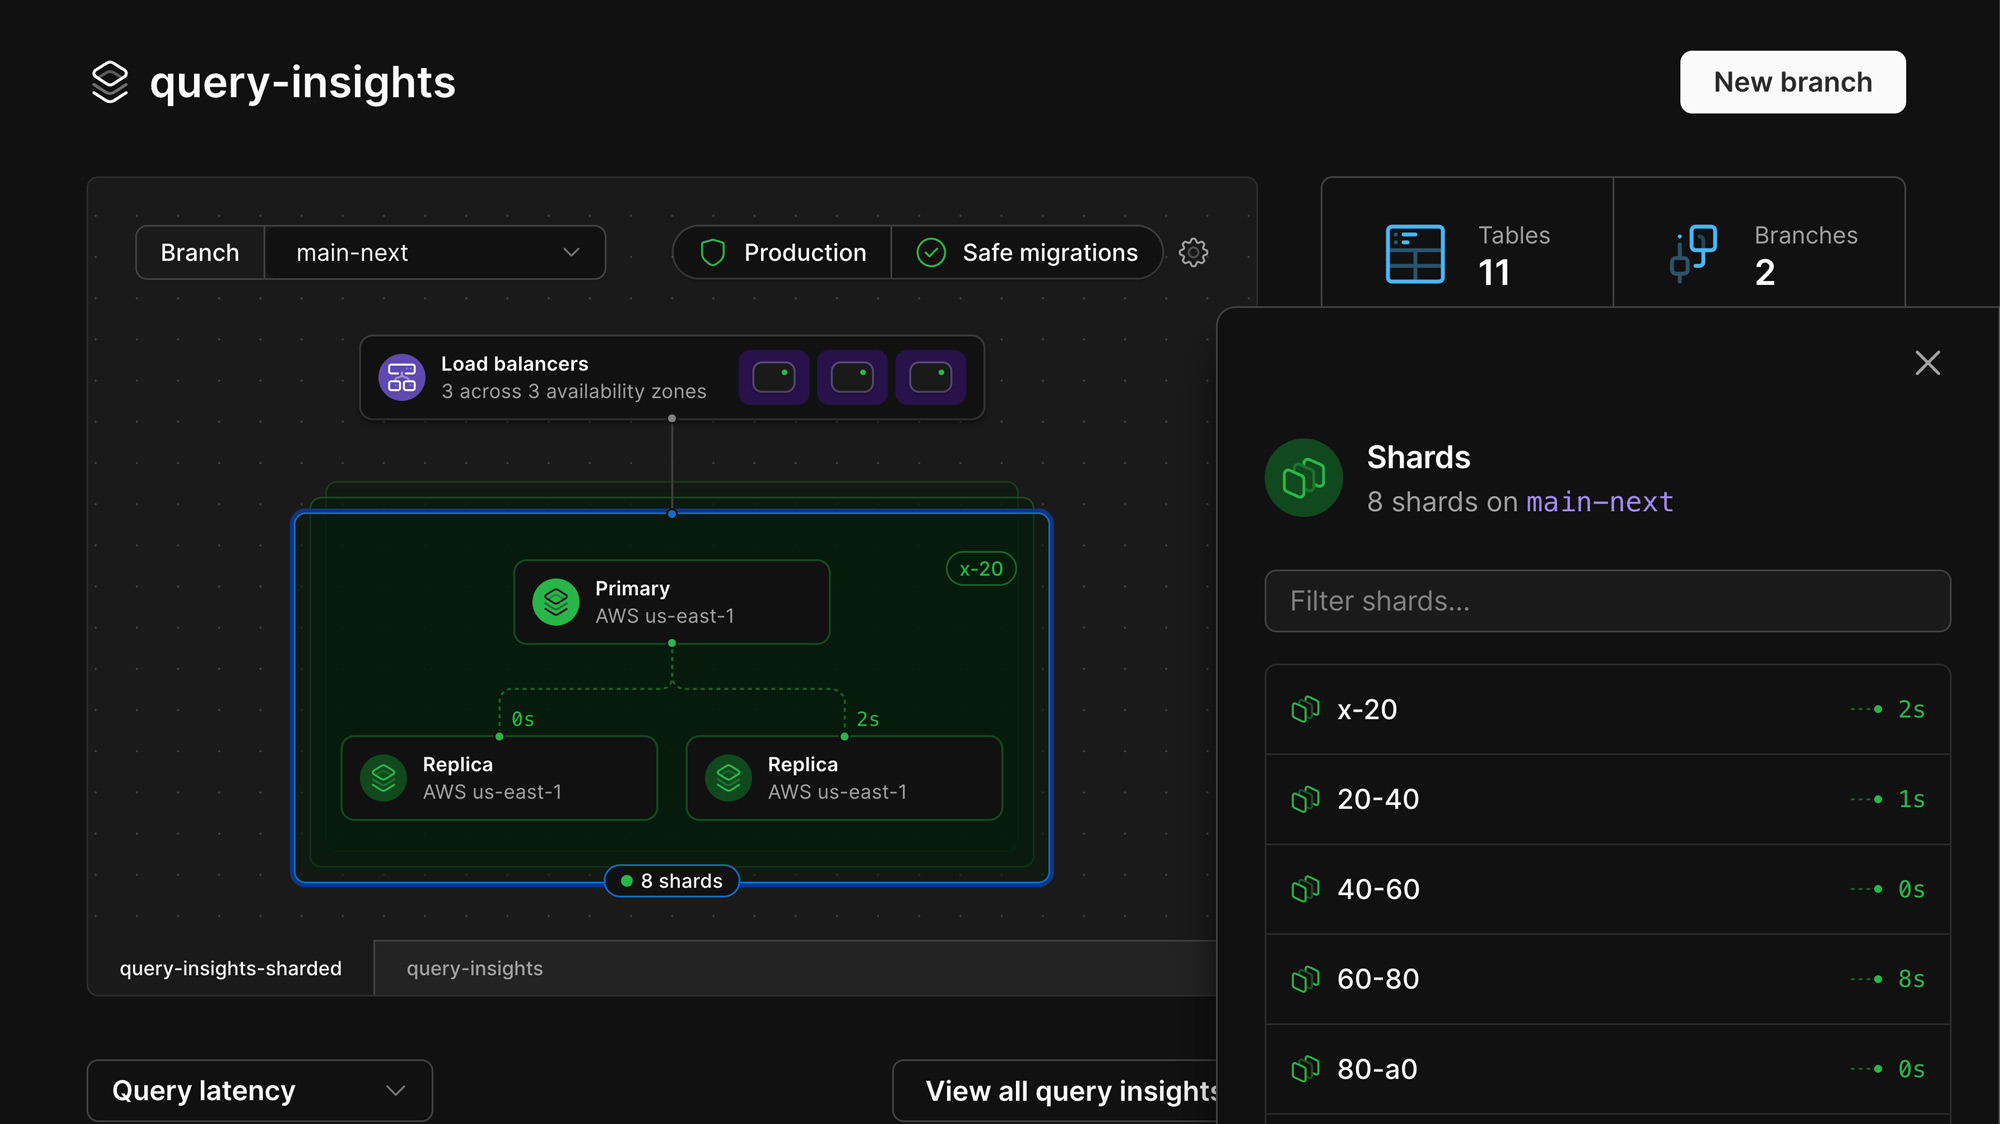
If your database is sharded, we include a breakdown of this on the overview page as well. You'll see tabs at the bottom of the diagram where you can click through your different keyspaces, if you have more than one.
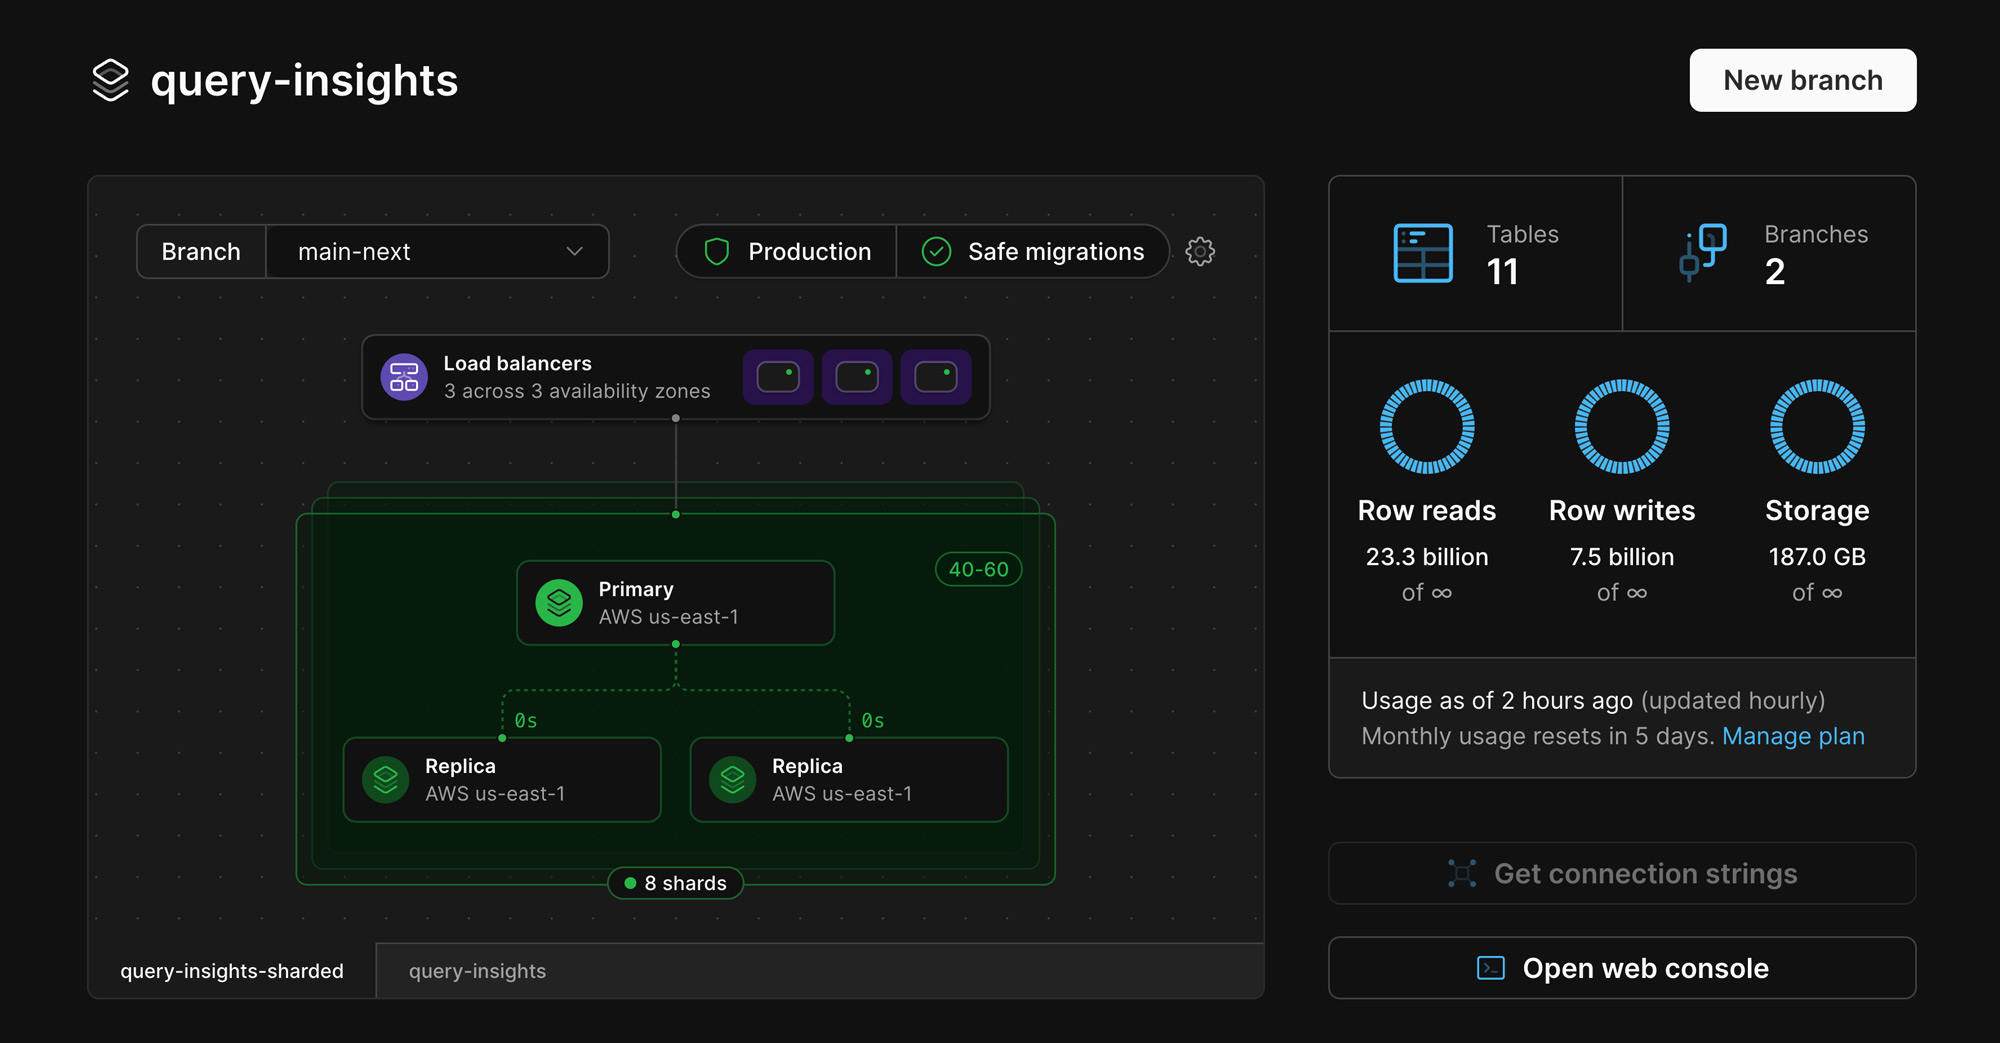
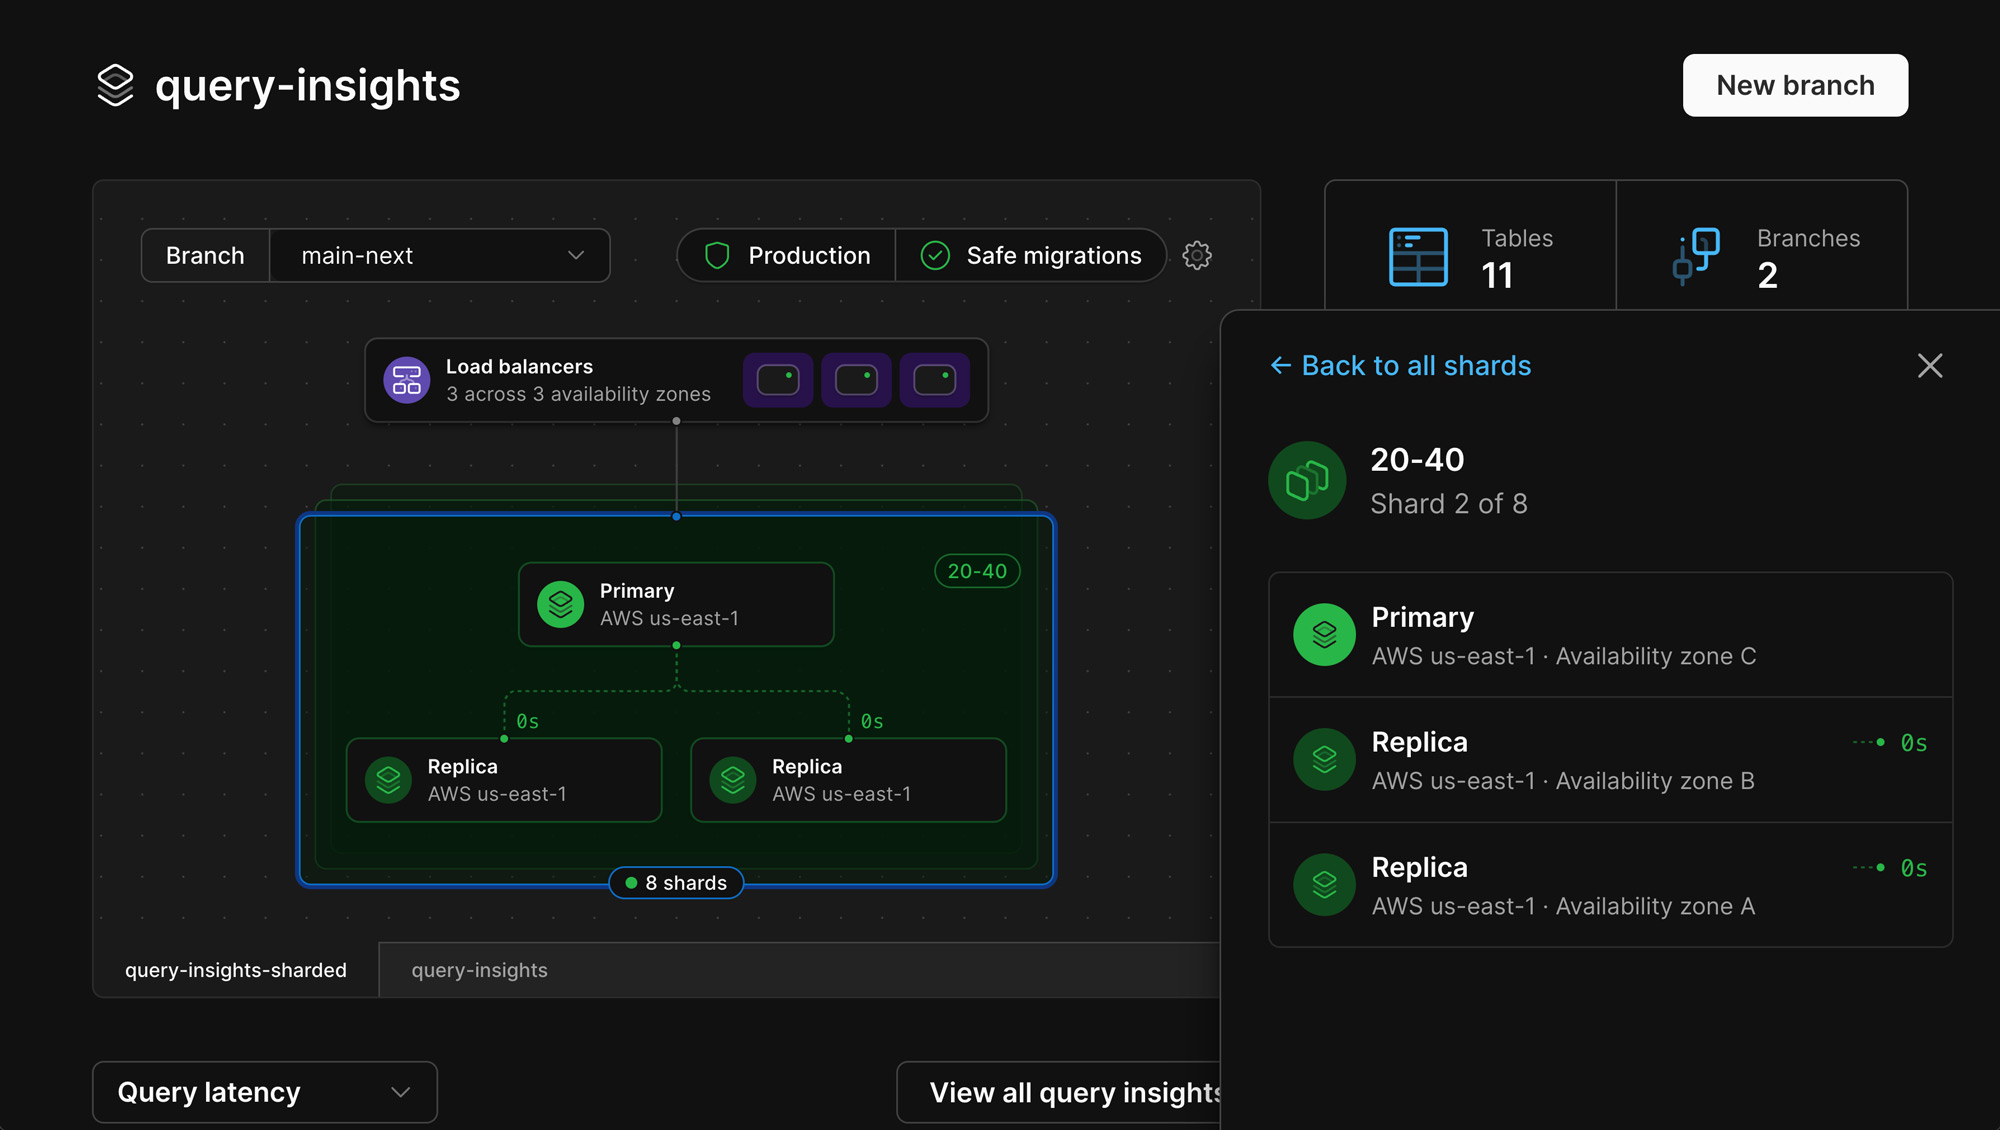
Within each sharded keyspace, you'll see the total number of shards, and clicking on the diagram pulls up a list of each shard with max replication lag. You can also click into each shard, allowing you to view information about the primary and replicas for that shard, including:
- Region
- Availability zone
- Reads/writes per second
- QPS
- IOPs
- CPU
- And memory
Check it out
If you have an existing PlanetScale database, you can head to your dashboard right now to see this new update. Remember, nothing has changed with your database, we're simply revealing what has always been under the hood. And if you haven't explored PlanetScale yet, you can sign up for an account now.
If you have any questions or feedback, don't hesitate to reach out! Head to our Contact page or find us on Twitter at @planetscale.
You can learn more about PlanetScale architecture in our Architecture documentation.