When you experience database issues, capturing queries on a running system is a hard problem. Existing solutions, such as tcpdump, SHOW PROCESSLIST; or third-party monitoring agents, can cause additional system load or gather only a small subset of queries.
Starting today, all PlanetScale database branches now track statistics about each SQL query that has executed against it without any overhead. By using Vitess, which powers PlanetScale databases, to track how many times a query runs, how many rows it returned, and how long each query takes to complete, we provide a complete view of query traffic on the database. With this insight into your database, you can debug your queries and make changes to your application or quickly deploy new indexes with non-blocking schema changes.
As a starting point, we flag any query running for longer than 100 milliseconds as a candidate for optimization.
To learn more about how to use query statistics, check out our documentation here.
Debugging a slow query
While developing this feature we found a few queries in our PlanetScale production database that needed additional indexes to complete more quickly. We reduced one query’s average runtime in the database backup feature by 98%. First let’s look at the way the database backup feature works and then dig into the slow query.
Every database branch is backed up to external storage at least once per day. A daily backup replaces the previous day's backup as soon as it completes successfully. This ensures we always have a recent backup of every branch’s data.
Deleting a daily backup requires two steps:
- Mark the backup record as deleted—a soft delete—by setting its
deleted_attimestamp. - Delete the backup's data files from external storage.
We periodically run a background job to find expired daily backups that need to be deleted. The job runs this query in batches.
select * from backup where deleted_at is null and expires_at <= :vtg1 order by id asc limit :vtg2
The :vtg1 syntax is a replacement parameter provided by Vitess. The actual values look like the following.
select * from backup where deleted_at is null and expires_at <= current_timestamp order by id asc limit 1000
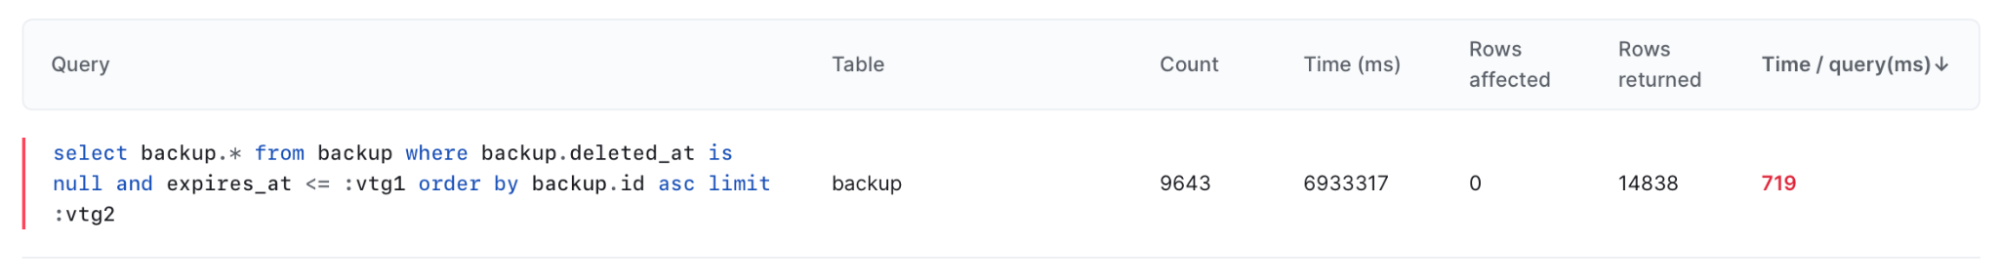
Using the query statistics report we discovered this query takes an average of 719ms to find expired backups to delete. The only good news about this slow query is that it runs inside a background job, rather than in a web request cycle, so it doesn’t slow down users. It does consume too much time in our job workers and in the database, so let’s find out why it’s slow.
Optimizing a slow query with Query Statistics
We think this query should be faster because we have a composite index on (expires_at, data_deleted_at, deleted_at). However, the MySQL explain plan shows that the query planner chooses a full table scan over every row rather than using this index.
> explain select * from backup where deleted_at is null and expires_at <= current_timestamp order by id asc limit 1000\G;
*************************** 1. row ***************************
        id: 1
  select_type: SIMPLE
        table: backup
   partitions: NULL
         type: ALL
possible_keys: index_backup_on_expires_at_and_data_deleted_at_and_deleted_at
          key: NULL
      key_len: NULL
          ref: NULL
         rows: <100s of thousands—every row in the table>
     filtered: 5.00
        Extra: Using where
A couple observations about the data reveals why this is a poor index and points us to a more selective index that will narrow this result set dramatically.
- 97% of the backup rows are expired, so querying by
expires_at < current_timestampis not selective. - 97.5% of the rows are soft deleted, so querying by
deleted_at is not nullis highly selective.
In retrospect, this makes sense when dealing with daily backups that replace the previous day's backup. However, most of our tables do not match this workload and the relationship is the reverse: most rows are live rather than soft deleted. We often include deleted_at as a trailing key in composite indexes for this reason, but this isn’t quite right for the backup table.
If we change the order of keys in this index to (deleted_at, expires_at, data_deleted_at) then the query is highly selective. It can eliminate deleted rows from the set and search over the few remaining rows that may be expired.
The explain plan for the new index shows that the query planner does indeed choose the index and estimates it needs to visit only a single row to provide the result.
> explain select * from backup where deleted_at is null and expires_at <= current_timestamp order by id asc limit 1000\G;
*************************** 1. row ***************************
           id: 1
  select_type: SIMPLE
        table: backup
   partitions: NULL
         type: range
possible_keys: index_backup_on_deleted_at_and_expires_at_and_data_deleted_at
          key: index_backup_on_deleted_at_and_expires_at_and_data_deleted_at
      key_len: 17
          ref: NULL
         rows: 1
     filtered: 100.00
        Extra: Using index condition; Using filesort
Conclusion
Using PlanetScale query statistics along with MySQL explain plans to optimize an index reduced a 719ms query to under 20ms in our background job workers. Full table scan performance further degrades as the table size grows, so this query would have eventually consumed enough time inside the database to impact other queries that are servicing web requests. By optimizing this query, we’ve ensured that this process will never impact the user experience.
Try it out now!
You can see the real-time query statistics for your PlanetScale databases right now. Or you can sign up for PlanetScale and migrate your data to get more insight into your databases. Check it out and let us know what you think.