Though we try our best to avoid it, it's easy to let underperforming queries slip through the cracks in our workloads, negatively impacting the performance of a database system. This is especially true in large-scale database environments, with many gigabytes or terabytes of data, hundreds of tables, and thousands of query patterns being executed on a daily basis.
Thankfully, MySQL has the ability to collect data that can be leveraged for identifying problematic queries, and can also do profiling on them in order to drill into their poor performance. In this article, I'll go over several built-in techniques for how to do this in native MySQL. If you use PlanetScale, this type of information can be gathered more easily and intuitively using the PlanetScale Insights dashboard. I'll include a brief discussion of this feature later on.
For this article, I'll be using the following schema as an example.
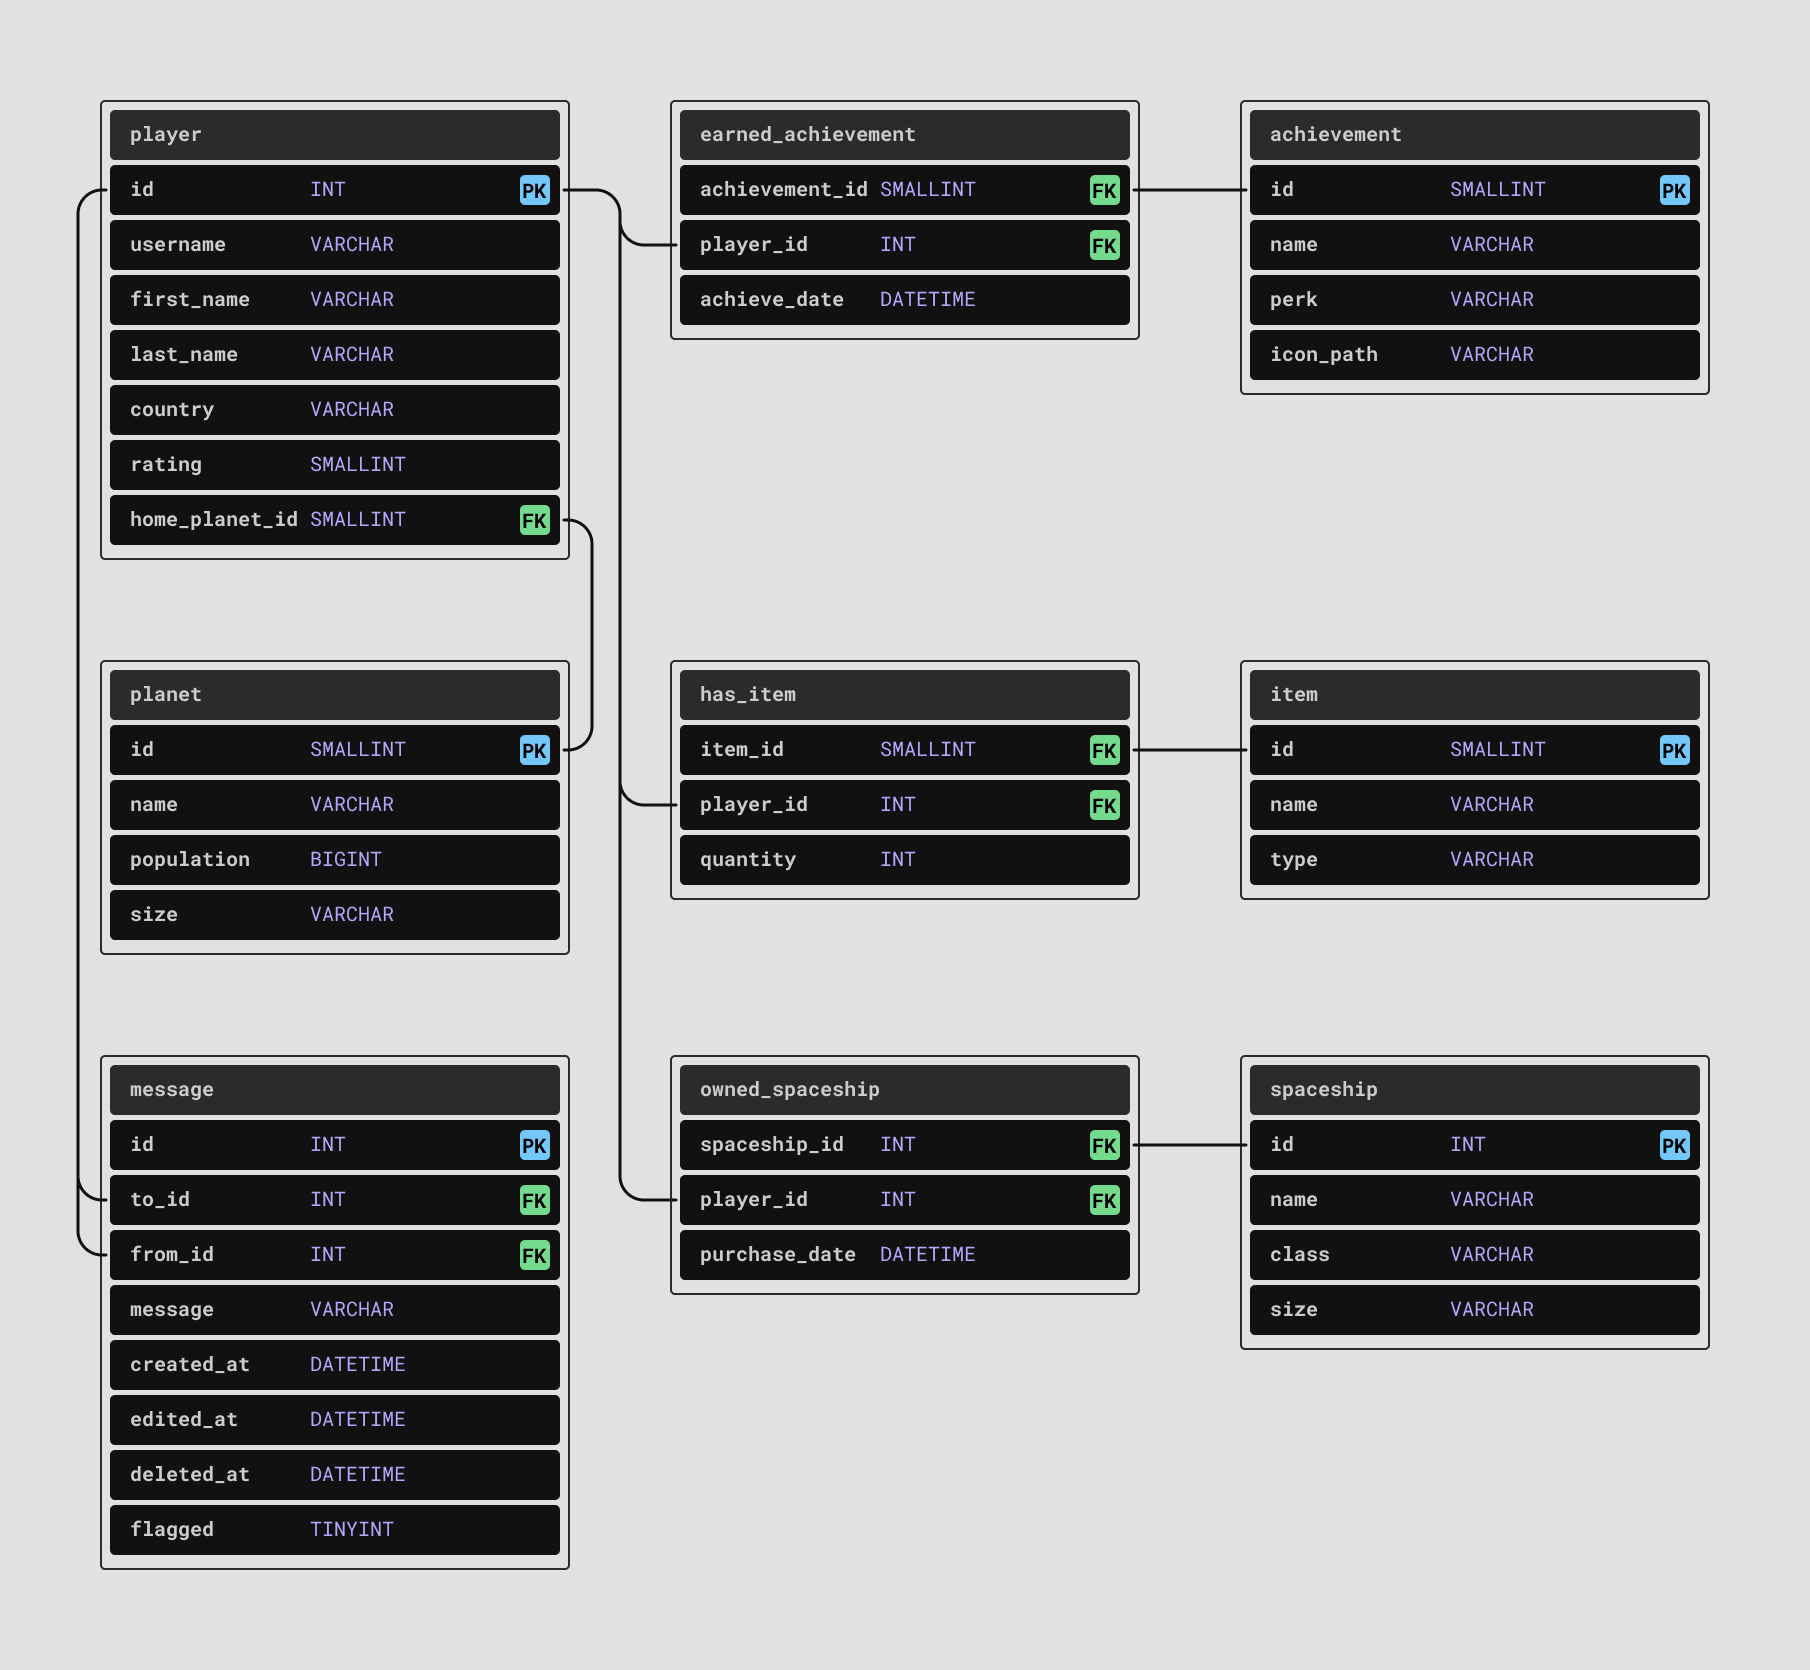
A fake workload has been run on this database, and later on you'll see some queries that operate on these tables.
Enable performance_schema
If you have a large application that executes numerous queries on the database, it can be overwhelming to know where to start looking for problems. How do you know which queries are under-performing? One way to determine this would be to execute your queries manually in a shell session and examine the resulting timing. You could also use your web application in a browser to see which page loads and requests appear to be running slowly. However, there are more principled ways to identify these queries.
You can use information from the tables in performance_schema to help us identify these. To use this, first switch over to this database.
USE performance_schema;
You also should check to ensure that performance_schema is enabled. It should be enabled by default, but it can be manually turned off or disabled if the host MySQL is running on has insufficient memory, as all of the information it tracks is stored in an in-memory PERFORMANCE_SCHEMA storage engine. If it is enabled, you should see the following:
SHOW VARIABLES LIKE 'performance_schema';

+--------------------+-------+
| Variable_name      | Value |
+--------------------+-------+
| performance_schema | ON    |
+--------------------+-------+
Identifying slow queries
The next step is to figure out what queries to focus our efforts on fixing. There are a few techniques you can use to identify these using the tables in performance_schema and sys. There are a LOT of tables in the performance_schema database:
SELECT COUNT(*)
    FROM information_schema.tables
    WHERE table_schema = 'performance_schema';

+----------+
| COUNT(*) |
+----------+
| 113      |
+----------+
(Your number may be different depending on your version of MySQL).
A good place to start is looking at the information provided by the events_statements_summary_by_digest table. Let's take a look at one row for starters, the one with the highest average execution count:
SELECT * FROM performance_schema.events_statements_summary_by_digest
    WHERE schema_name = 'game'
    ORDER BY avg_timer_wait
    DESC LIMIT 1 \G;

***************************[ 1. row ]***************************
SCHEMA_NAME                 | game
DIGEST                      | 8ee55a42fea07da3d5e786413a6c1bd...
DIGEST_TEXT                 | SELECT `p1` . `username` , `m` ...
COUNT_STAR                  | 2486
SUM_TIMER_WAIT              | 425862156000000
MIN_TIMER_WAIT              | 149411000000
AVG_TIMER_WAIT              | 171304165000
MAX_TIMER_WAIT              | 380467000000
SUM_LOCK_TIME               | 1306000000
...
There are quite a few columns in each row. However, the columns such as SUM_TIMER_WAIT and AVG_TIMER_WAIT are good to look at if you want to see your most expensive queries. The times shown here are given in picoseconds, and thus need to be divided by 1 trillion to convert to seconds. In this case, the AVG_TIMER_WAIT (the average time for this query) is .17 seconds, and this query was only executed 7580 times (see the COUNT_STAR value in the result set above).
There are also a bunch of tables in the sys database that keep useful stats for identifying slow queries. You can check out the info in tables like statements_with_sorting, statements_with_runtimes_in_95th_percentile, and statements_with_full_table_scans. As an example of this, let's examine the queries with the highest average number of rows examined from the statements_with_runtimes_in_95th_percentile:
SELECT substring(query,1,50), avg_latency, rows_examined_avg
  FROM sys.statements_with_runtimes_in_95th_percentile
  ORDER BY rows_examined_avg
  DESC LIMIT 10;

+----------------------------------------------------+-------------+-------------------+
| substring(query,1,50)                              | avg_latency | rows_examined_avg |
+----------------------------------------------------+-------------+-------------------+
| SELECT `alias` FROM `chat` . `message` LIMIT ?     | 2.13 s      | 10000000          |
| SELECT `alias` FROM `message` LIMIT ?              | 881.20 ms   | 2500004           |
| EXPLAIN ANALYZE SELECT `p1` .  ... ` WHERE `m` . ` | 223.97 ms   | 1081990           |
| SELECT `p1` . `username` , `m` ... ` WHERE `m` . ` | 57.75 ms    | 421446            |
| SELECT * FROM `message` LIMIT ?                    | 70.52 ms    | 125125            |
| EXPLAIN ANALYZE SELECT `id` FR ... E `created_at`  | 56.55 ms    | 100000            |
| SELECT `id` FROM `message` WHERE `created_at` BETW | 58.28 ms    | 100000            |
| SELECT SUBSTRING ( QUERY , ?,  ... s_examined_avg` | 76.72 ms    | 1498              |
| SELECT SUBSTRING ( QUERY , ?,  ... `rows_examined` | 75.59 ms    | 1495              |
| SELECT SUBSTRING ( QUERY , ?,  ... ned` AS DECIMAL | 78.97 ms    | 1494              |
+----------------------------------------------------+-------------+-------------------+
For example, you may also be interested in taking a look at things from the perspective of a table instead of a query. You can look at stats on a per-table basis for how many row reads are being served via indexes versus without. Say you have a chat database with a message table that you know is heavily used. You can find these stats using the table_io_waits_summary_by_index_usage table.
SELECT `OBJECT_SCHEMA`, `OBJECT_NAME`, `INDEX_NAME`, `COUNT_STAR`
    FROM performance_schema.table_io_waits_summary_by_index_usage
    WHERE object_schema = 'game' AND object_name = 'message';

+---------------+-------------+------------+------------+
| OBJECT_SCHEMA | OBJECT_NAME | INDEX_NAME | COUNT_STAR |
+---------------+-------------+------------+------------+
| game          | message     | PRIMARY    | 0          |
| game          | message     | to_id      | 0          |
| game          | message     | from_id    | 164500     |
| game          | message     | <null>     | 2574002473 |
+---------------+-------------+------------+------------+
This indicated that there have been over 2 billion row reads that were not fulfilled by an index (the row where INDEX_NAME is <null>). Either this table needs one or more indexes added to it, or the queries using this table need to be updated, or both!
There's also a bunch of cool stats you can look at over in the sys table. Here's one quick example. You can grab data on how many full table scans are being executed by each query using the sys.statements_with_full_table_scans table.
USE sys;
SELECT query, db, exec_count, total_latency
    FROM sys.statements_with_full_table_scans
    ORDER BY exec_count DESC
    LIMIT 5;

+-------------------------------------------------------------------+------+------------+---------------+
| query                                                             | db   | exec_count | total_latency |
+-------------------------------------------------------------------+------+------------+---------------+
| SELECT `class` , `size` FROM `spaceship` WHERE `size` > ?         | game | 8422       | 26.65 s       |
| SELECT `p1` . `username` , `m` ... ` WHERE `m` . `created_at` > ? | game | 6742       | 6.45 min      |
| SELECT * FROM `earned_achievem ... id` AND `ea` . `player_id` > ? | game | 6718       | 969.17 ms     |
| SELECT * FROM `item` WHERE NAME LIKE ? LIMIT ?                    | game | 5676       | 969.43 ms     |
| SELECT NAME , `size` FROM `planet` WHERE `population` > ?         | game | 5625       | 173.02 ms     |
+-------------------------------------------------------------------+------+------------+---------------+
This shows which queries are triggering full table scans. In this case, there's a ton, but this would be expected since there are no indexes on this example database other than the default ones on the primary keys.
Note
For more information about how to work with the performance_schema and sys tables, check out this video.
Inspecting with EXPLAIN
By this point, you've hopefully gathered a collection of queries that need to be further inspected. The next step is to do some root-cause analysis into why these queries are taking a long time and reading too many of rows. Of course, one great way to drill into the behavior of a query is with EXPLAIN or EXPLAIN ANALYZE. In this example, I'm going to use EXPLAIN ANALYZE.
For example, running the following query:
EXPLAIN ANALYZE SELECT p1.username, m.to_id, p2.username, m.from_id
    FROM message m
    LEFT JOIN player p1 ON m.to_id = p1.id
    LEFT JOIN player p2 ON m.from_id = p2.id
    WHERE m.created_at > '2020-10-10 00:00:00';
Gives detailed information regarding the query plan and costs of the various steps.
+--------------------------------------------------------------------------------------------------------------------------------------------+
| EXPLAIN                                                                                                                                    |
+--------------------------------------------------------------------------------------------------------------------------------------------+
| -> Nested loop left join  (cost=333272 rows=332036) (actual time=0.515..320 rows=345454 loops=1)                                           |
|     -> Nested loop left join  (cost=217059 rows=332036) (actual time=0.475..240 rows=345454 loops=1)                                       |
|         -> Filter: (m.created_at > TIMESTAMP'2020-10-10 00:00:00')  (cost=100846 rows=332036) (actual time=0.153..188 rows=345454 loops=1) |
|             -> Table scan on m  (cost=100846 rows=996208) (actual time=0.148..159 rows=1e+6 loops=1)                                       |
|         -> Single-row index lookup on p1 using PRIMARY (id=m.to_id)  (cost=0.25 rows=1) (actual time=54.5e-6..70.9e-6 rows=1 loops=345454) |
|     -> Single-row index lookup on p2 using PRIMARY (id=m.from_id)  (cost=0.25 rows=1) (actual time=137e-6..153e-6 rows=1 loops=345454)     |
+--------------------------------------------------------------------------------------------------------------------------------------------+
There are a number of things to look at when inspecting this output. Generally, if you see table scans over large tables, this is something you should try to mitigate with an index. More broadly, any time you see a node with a high cost or rows value, this probably deserves further tuning. Perhaps the query can be re-written, or perhaps one or more indexes can help improve performance.
Note
For more information about EXPLAIN, see our MySQL for Developers course or our How to read MySQL EXPLAINS blog post.
Preparing to instrument a query
Explain is a great tool, but you can also profile a query to determine how much time it spends in each stage of execution. To do this, first ensure that the proper instruments and consumers are enabled so that information can be gathered appropriately. In order to do this, run the following:
UPDATE performance_schema.setup_instruments
    SET ENABLED = 'YES', TIMED = 'YES';
UPDATE performance_schema.setup_consumers
    SET ENABLED = 'YES', TIMES = 'YES';
If you'd like, you can be more selective at this step. Rather than enabling this setting for all of instruments and consumers, you can enable subsets of the rows in these two tables. To enable it for the stages of query execution, you could run the following.
UPDATE performance_schema.setup_instruments
  SET ENABLED = 'NO', TIMED = 'NO';
UPDATE performance_schema.setup_instruments
  SET ENABLED = 'YES', TIMED = 'YES'
  WHERE NAME LIKE '%stage/%';
Ultimately, it's up to you based on what level of comfort you have with possible performance hits of profiling. If you're not very concerned with the profiling overhead, just turn everything on and then disable later when you're finished.
Next, ensure that history tracking is enabled. If you have not configured it before, you'll probably see the following when you look at the setup_actors configuration:
SELECT * FROM performance_schema.setup_actors;
+------+------+------+---------+---------+
| HOST | USER | ROLE | ENABLED | HISTORY |
+------+------+------+---------+---------+
| %    | %    | %    | YES     | YES     |
+------+------+------+---------+---------+
If you want you can leave these settings as-is. However, this means that performance schema and history tracking will be enabled for all users. This could have a (small) adverse effect on the overall performance of your system. You can optionally enable it only for one specific user (this would be the user you need to run your test queries on). If you choose to go this route, turn it off globally:
UPDATE performance_schema.setup_actors
  SET ENABLED = 'NO', HISTORY = 'NO'
  WHERE HOST = '%' AND USER = '%';
And then enable it only for the user(s) that you want to track for:
INSERT INTO performance_schema.setup_actors
  (HOST, USER, ROLE, ENABLED, HISTORY)
  VALUES ('your_host', 'your_user', '%', 'YES', 'YES');
Profiling the query
Now, let's profile one of our problematic query. First, get the ID of the connection you are going to run the query on.
SET @connection_thread = (
  SELECT thread_id
    FROM performance_schema.threads
    WHERE PROCESSLIST_ID = CONNECTION_ID() );
Next, execute the query you want to profile. Immediately after doing this, run the following query to determine the starting event ID of that execution:
SELECT thread_id, statement_id, SUBSTRING(sql_text,1,50)
  FROM performance_schema.events_statements_history_long
  WHERE thread_id = @connection_thread
  ORDER BY event_id DESC LIMIT 20;
Find the statement you want to profile and put its ID into a variable.
SET @statement_id = ?;
Finally, run the following to see the profiling information for that query execution.
SET @eid = (SELECT event_id FROM performance_schema.events_statements_history_long WHERE statement_id = @statement_id);
SET @eeid = (SELECT end_event_id FROM performance_schema.events_statements_history_long WHERE statement_id = @statement_id);
SELECT event_name, source, (timer_end-timer_start)/1000000000 as 'milliseconds'
  FROM performance_schema.events_stages_history_long
  WHERE event_id BETWEEN @eid AND @eeid;
This should provide a timing breakdown that looks something like this:
+------------------------------------------------+----------------------------------+--------------+
| event_name                                     | source                           | milliseconds |
+------------------------------------------------+----------------------------------+--------------+
| stage/sql/starting                             | init_net_server_extension.cc:110 | 0.2400       |
| stage/sql/Executing hook on transaction begin. | rpl_handler.cc:1481              | 0.0010       |
| stage/sql/starting                             | rpl_handler.cc:1483              | 0.0110       |
| stage/sql/checking permissions                 | sql_authorization.cc:2169        | 0.0020       |
| stage/sql/checking permissions                 | sql_authorization.cc:2169        | 0.0000       |
| stage/sql/checking permissions                 | sql_authorization.cc:2169        | 0.0030       |
| stage/sql/Opening tables                       | sql_base.cc:5859                 | 0.0950       |
| stage/sql/init                                 | sql_select.cc:759                | 0.0050       |
| stage/sql/System lock                          | lock.cc:331                      | 0.0110       |
| stage/sql/optimizing                           | sql_optimizer.cc:355             | 0.0270       |
| stage/sql/statistics                           | sql_optimizer.cc:699             | 0.1040       |
| stage/sql/preparing                            | sql_optimizer.cc:783             | 0.0590       |
| stage/sql/executing                            | sql_union.cc:1676                | 735.3020     |
| stage/sql/end                                  | sql_select.cc:795                | 0.0010       |
| stage/sql/query end                            | sql_parse.cc:4805                | 0.0020       |
| stage/sql/waiting for handler commit           | handler.cc:1636                  | 0.0060       |
| stage/sql/closing tables                       | sql_parse.cc:4869                | 0.0080       |
| stage/sql/freeing items                        | sql_parse.cc:5343                | 0.2810       |
| stage/sql/cleaning up                          | sql_parse.cc:2387                | 0.0010       |
+------------------------------------------------+----------------------------------+--------------+
In this case, you can see that the query spent the majority of the time in the execution stage. However, this would also reveal if the query had spent a lot of time waiting on a lock or on optimizing, in which case you could dig further into the problem.
PlanetScale Insights
As we've seen, MySQL provides a lot of capability to drill into problematic queries in your workload, and what we've discussed here is really only scratching the surface. However, it should also be clear that gleaning this information can be tedious. Getting exactly what you want requires significant poking around and digging through tables in performance_schema and sys.
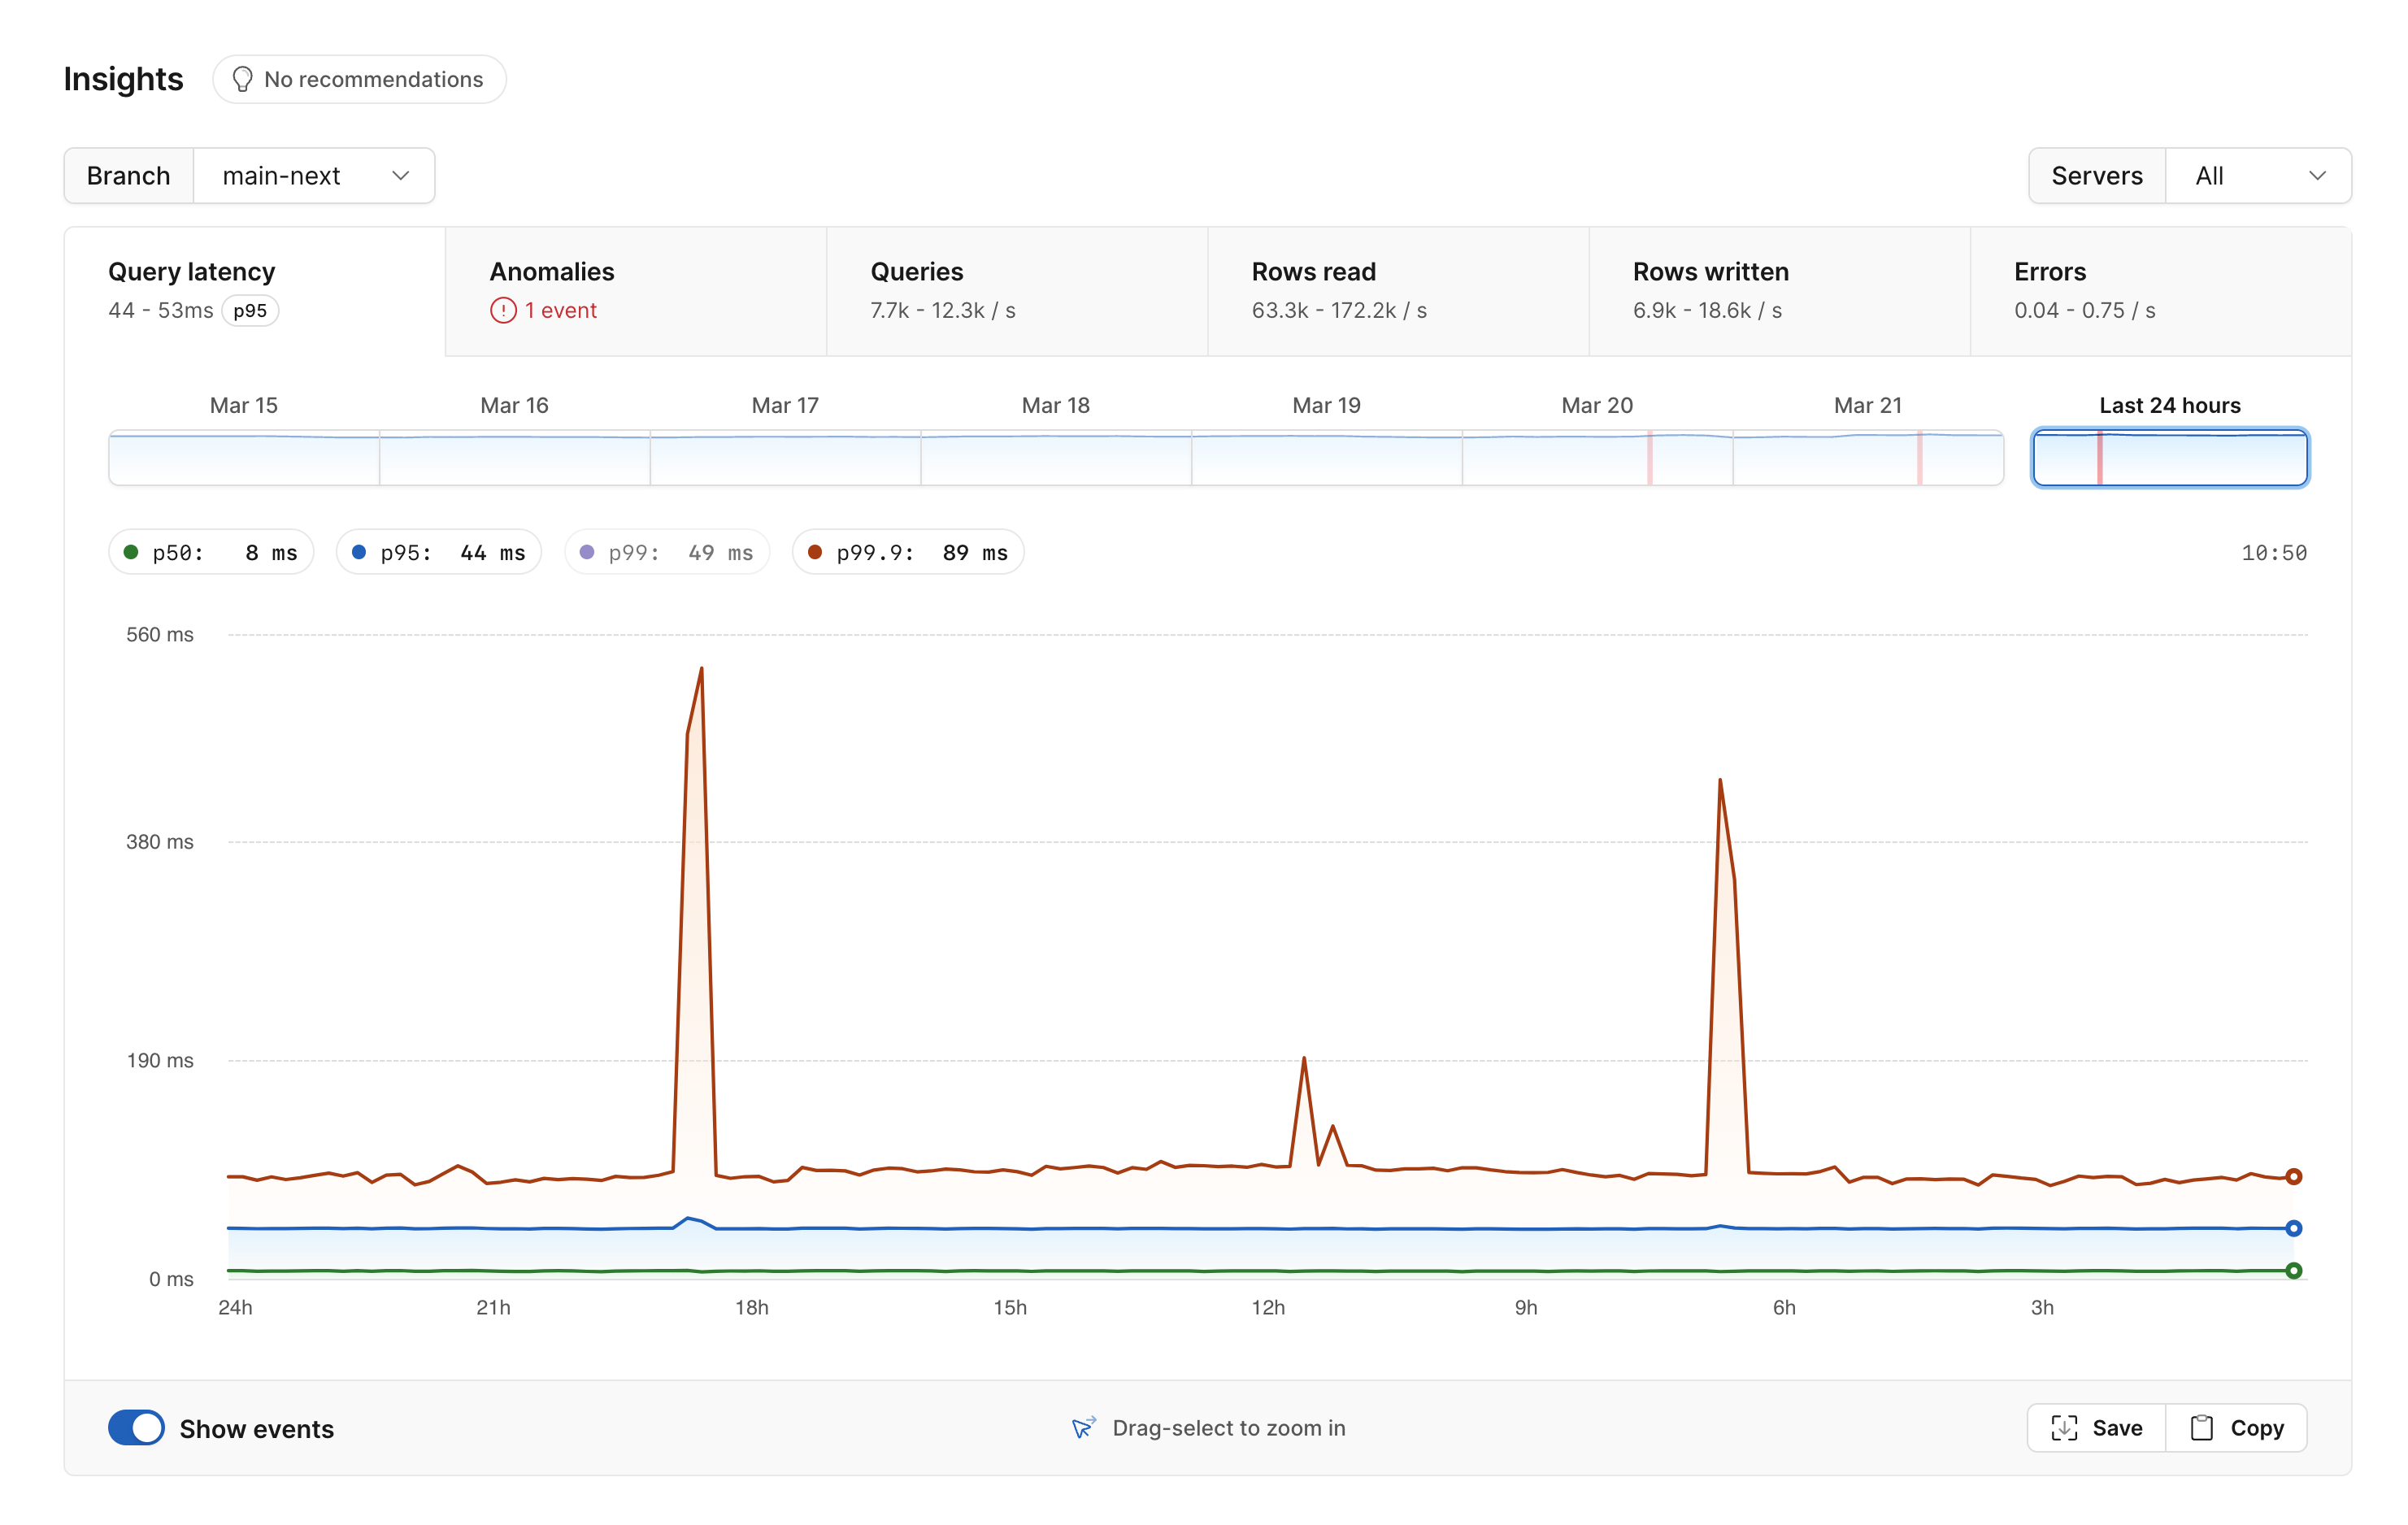
Many of these same observations can be gathered much easier using PlanetScale Insights. Insights provides a plethora of useful visualizations to help you get an overview of the performance of your database and automatic detection of anomalous behavior.
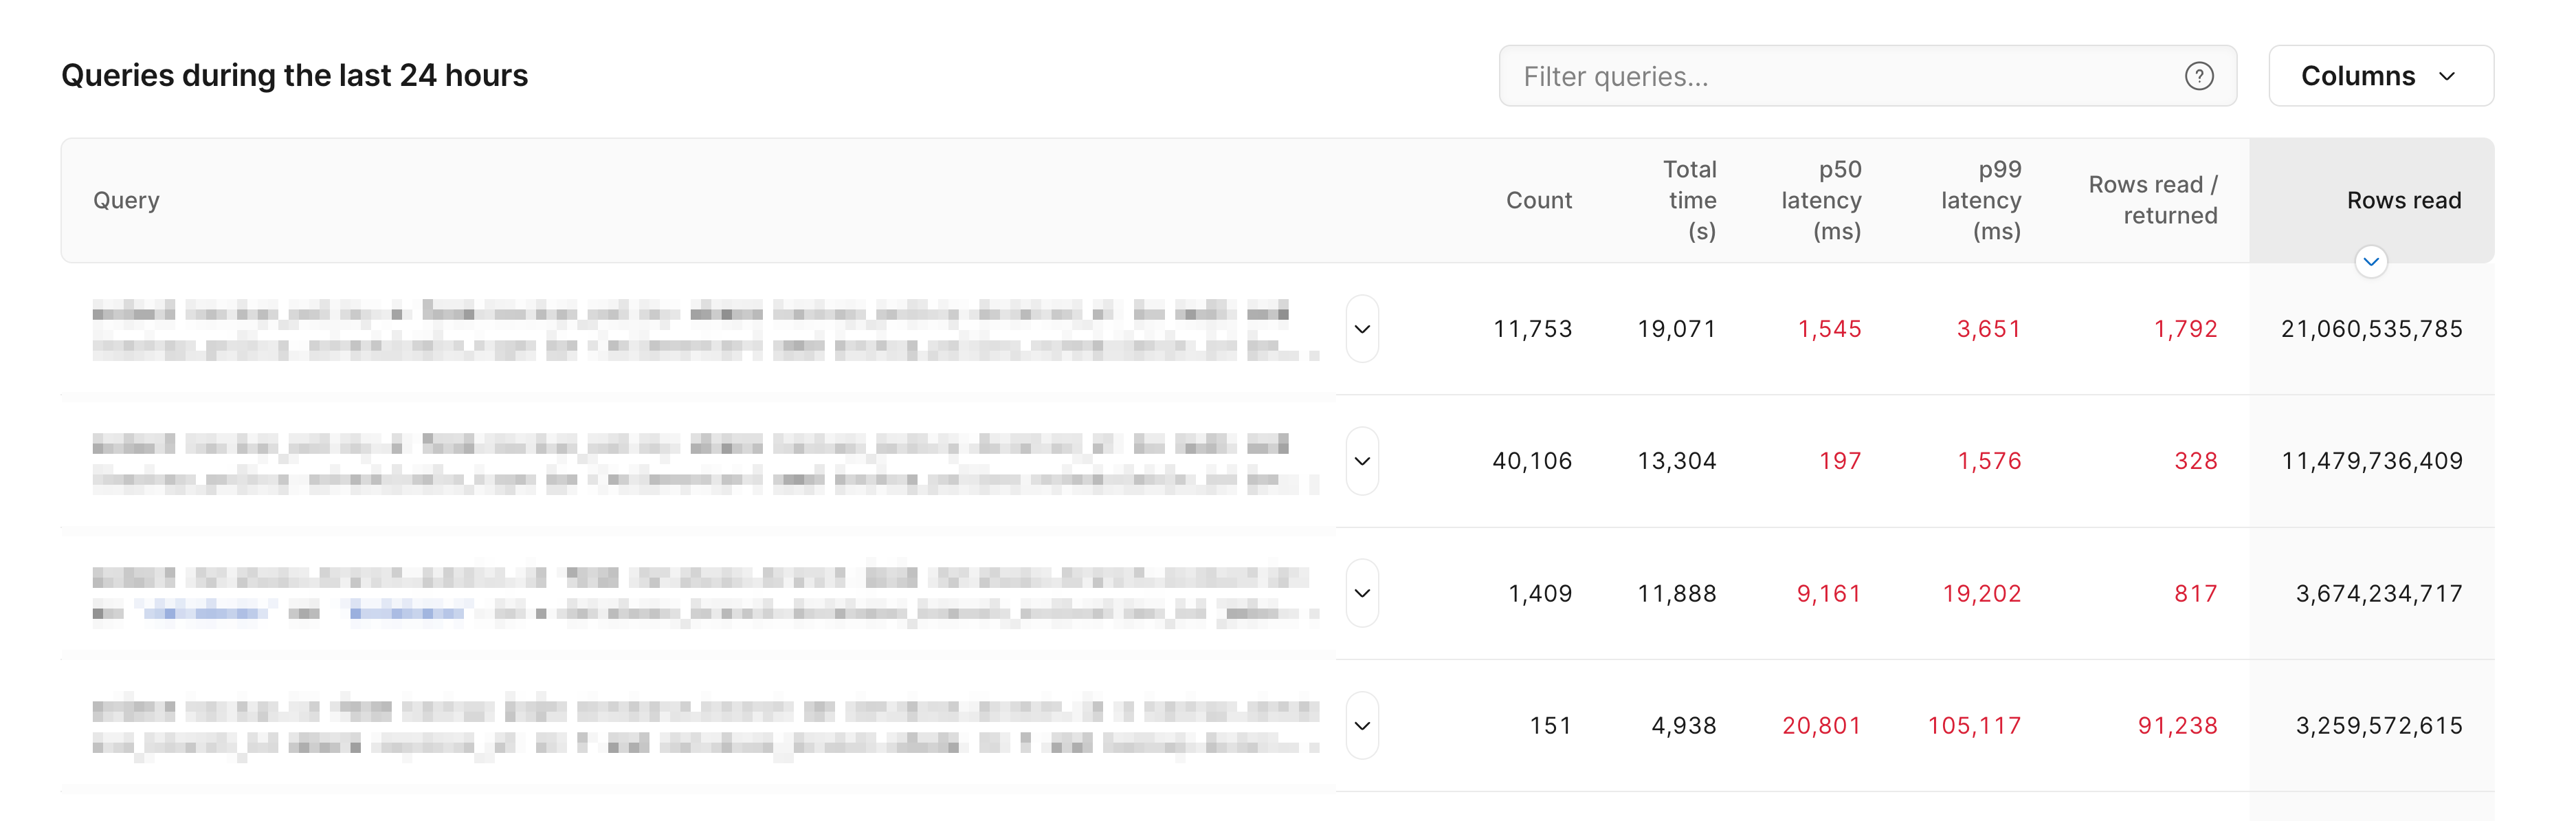
You can also use it to drill in on specific queries. For example, you can look at all queries executed over some window of time, and sort by different statistics such as rows read. This can help you quickly identify slow queries and ones where adding an index might be worthwhile.
Insights allows you to gain a deep understanding of your workload. This gives you more time to focus on improving your queries, developing software, and working efficiently.