Name something in recent history that got better and cheaper (other than the TVs at the entrance of Costco). I'll wait.
Better performance and lower costs rarely come together, but optimizing your queries to reduce egress gives you both.
So once you hit scale, or ideally before scale bites you, improving the efficiency of your queries by making the responses smaller and their frequency lower can pull off a rare double: make your application faster and cheaper.
Definitions
- Egress: Data transferred out from your database over the public internet. Most cloud providers bill for this, so it's something we want to minimize.
- Ingress: Data transferred into your database over the public internet. Most cloud providers either do not bill for this, or do so only in specific scenarios.
PlanetScale includes 100GB of egress on High Availability (HA) plans. Non-HA $5/month Postgres includes 10GB of egress. Usage is metered beyond those allowances, so it's worth knowing about and minimizing where possible.
This post focuses largely on Postgres, but the general principles apply to all databases across all the major cloud providers.
Common culprits
If your egress numbers are approaching the included quota, or exceeding it by more than you’d like, your problems likely stem from two things: you're either fetching too much, too often, or both.
Consider the case of a content-heavy application. The database is full of documents made of rich text and block content. That content is stored in a JSONB column using the Portable Text specification.
CREATE TABLE posts (
    id          integer                  NOT NULL DEFAULT nextval('posts_id_seq'::regclass),
    title       text                     NOT NULL,
    slug        text                     NOT NULL,
    content     jsonb                    NOT NULL DEFAULT '[]'::jsonb,
    created_at  timestamp with time zone NOT NULL DEFAULT now(),
    updated_at  timestamp with time zone NOT NULL DEFAULT now(),
    CONSTRAINT  posts_pkey PRIMARY KEY (id),
    CONSTRAINT  posts_slug_unique UNIQUE (slug)
);
Too much out
Fetching too much is easily done. Performing a SELECT * query will return every value from every column in every matching result and will return more data as more columns are added. Likewise, "unbounded queries," that is, a query without a limit, will linearly return more data as more matching data exists.
-- ❌ returns unlimited columns and rows
SELECT * FROM posts;

-- ✅ returns limited columns and rows
SELECT id, title FROM posts LIMIT 10;
Selecting specific columns has the added benefit of making your code more declarative about the data your application requires. While PlanetScale measures the data transfer size of your queries, it can't make assumptions about how much of that query response was used. The more specific your queries are, the simpler the debugging process becomes.
For a JSONB column, you may also consider using Postgres' built-in syntax to extract specific values from the data if not all values are required.
For example, perhaps you want to build a table of contents from level 2 and 3 headings from our Portable Text column. An unspecific query would just return the entire content column.
SELECT content FROM posts WHERE id = 1
Instead, we can use the jsonb_agg() function in Postgres to filter the array of objects down to just the headings we're looking for.
SELECT jsonb_agg(block) AS headings
 FROM
   posts,
   jsonb_array_elements(content) AS block
 WHERE
   id = 1
   AND block->>'_type' = 'block'
   AND block->>'style' IN ('h2', 'h3');
Including JSON filtering will introduce some CPU overhead, so it's a tradeoff. Monitor resource usage and see if the reduced egress is worth it.
Fetch only the rows, columns, and data from those columns that your application requires.
Pagination also bounds how much data leaves your database per request. Without it, a growing dataset means ever-larger responses. Two common approaches:
Offset/limit skips a number of rows and returns a fixed page size. Simple to implement, but the database still scans all skipped rows, so deeper pages cost more.
SELECT id, title FROM posts ORDER BY id LIMIT 10 OFFSET 0;  -- page 1
SELECT id, title FROM posts ORDER BY id LIMIT 10 OFFSET 10; -- page 2
Cursor pagination uses the last value from the previous page as the starting point. It performs consistently regardless of depth.
SELECT id, title FROM posts ORDER BY id LIMIT 10;                -- page 1
SELECT id, title FROM posts WHERE id > 10 ORDER BY id LIMIT 10; -- page 2
For more detail on each approach to pagination, see Offset limit pagination and Cursor pagination in the MySQL for Developers course.
Too much in
While most cloud providers do not typically charge for ingress, there are instances where your ingress operations quietly result in egress.
ORMs can have this happen by default when returning data from an insert operation. Here is an example insertion operation using Drizzle.
const post = await db
  .insert(posts)
  .values({ title: 'Hello world', slug: 'hello-world' })
  // ❌ returns everything with no parameters
  .returning()
The function call above would result in an SQL query like this.
INSERT INTO
	posts (title, slug)
VALUES
	('Hello world', 'hello-world')
RETURNING
    *;
In this particular instance, we're only writing the title and slug, so the response is relatively small in terms of bytes transferred. It's worth noting, however, that more columns were returned than were written.
+----+-------------+-------------+---------+-------------------------------+-------------------------------+
| id | title       | slug        | content | created_at                    | updated_at                    |
|----+-------------+-------------+---------+-------------------------------+-------------------------------|
| 5  | Hello world | hello-world | []      | 2026-05-11 16:04:03.049885+01 | 2026-05-11 16:04:03.049885+01 |
+----+-------------+-------------+---------+-------------------------------+-------------------------------+
The content column is small for now, but if we were writing an UPDATE to an existing and very large document, it would be returned with every operation.
Now imagine our content editor upserts changes to an edited document every second. This could be a massive payload of our Portable Text JSON, with every insert operation returning the full body of the inserted item, essentially doubling the operation's egress.
const post = await db
  .insert(posts)
  .values({ title: 'Hello world', slug: 'hello-world' })
  // ✅ returns only the id column
  .returning({ id: posts.id })
Return only what you need, if anything.
Too often
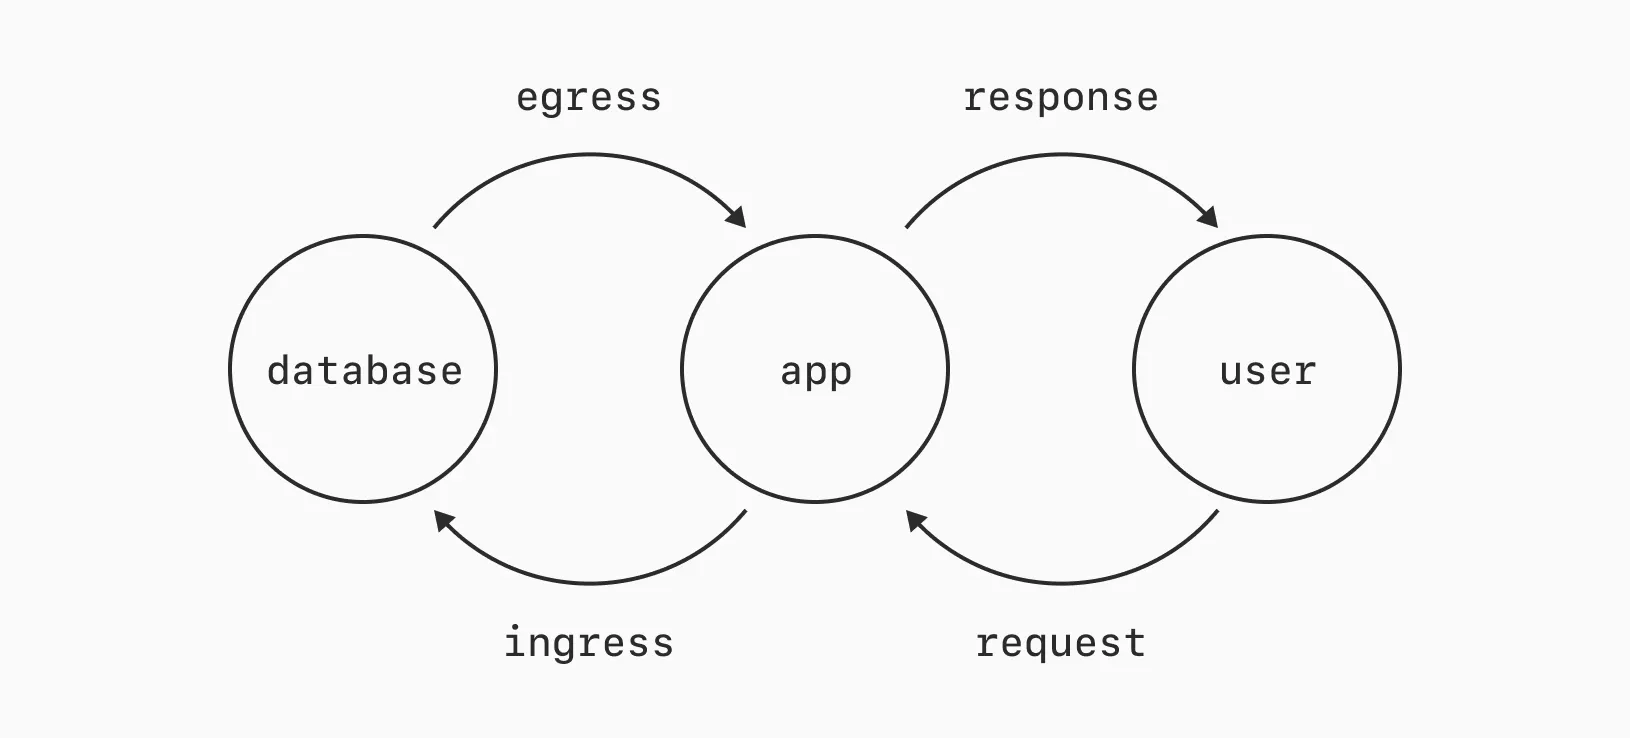
If every user of your application requesting the same data results in a fresh request to your database, you're wasting your egress quota.
In the simplified diagram below, that means trying to avoid every user request from triggering fresh egress to generate a response.
Caching and Content Delivery Networks (CDNs) exist largely to improve performance. One way they achieve this is by reducing data transfer. By loading a local copy of the data your application needs instead of fetching it fresh from the database.
An application-level cache (like Redis) between your database and application, or a network-level cache (like a CDN) between your application and a user, can help reduce the frequency of requests to your database.
Preventing unnecessary work in your database is increasingly important as your dataset grows and the frequency of requests increases. A single JSONB column of Portable Text, for example, could get into megabytes in size, and you won't want it requested from the database with each page load, should your article hit the front page of Hacker News.
Too internet
Egress is typically charged when data travels over the public Internet. PlanetScale supports AWS PrivateLink and GCP Private Service Connect to improve security and reduce egress costs (another win-win combo).
If your application is hosted within the same infrastructure as your database (and it should be), you may be able to use either of these private connections to skip this public internet hop.
PlanetScale charges much lower rates for data transferred over these private connections, however, both ingress and egress are billed. See the documentation for more pricing details and to see if this is an option for you.
Read more: Private connections in the PlanetScale docs
Identifying egress usage
PlanetScale Postgres offers us ways to measure the bytes returned by individual queries, but not to observe egress bytes usage patterns over time. Let's look first at what it takes to measure a query.
With EXPLAIN
If we prepend EXPLAIN to the same unbounded, unspecific query as before, we're shown the query plan for the response.
> EXPLAIN SELECT * FROM posts;

+----------------------------------------------------------+
| QUERY PLAN                                               |
|----------------------------------------------------------|
| Seq Scan on posts  (cost=0.00..15.60 rows=560 width=116) |
+----------------------------------------------------------+
The query plan shows us rows=560, an estimate of the number of rows returned, and width=116, an estimate of the size of each row. These estimates are based on averages and won't reflect the size of any particular row, especially for variable-length columns like JSONB.
The only way to accurately measure the transfer size of a query is to run it. Let's measure the difference between querying the full content column of a post compared to just extracting the headings.
We could use pg_column_size() to measure the size of the content column, but it would return the TOAST-compressed size, not the size of the data being sent over the wire. octet_length() will return a closer approximation of the relative size.
Note
Postgres uses TOAST (The Oversized-Attribute Storage Technique) to compress and store large values, such as our JSONB column, so its on-disk size is dramatically smaller than its measured egress size. TOAST-compressed data is decompressed and serialized before being sent over the wire.
-- Full content column
SELECT pg_size_pretty(octet_length(content::text)::bigint)
FROM posts WHERE id = 1;

+----------------+
| pg_size_pretty |
|----------------|
| 37 kB          |
+----------------+

-- Just the headings
SELECT pg_size_pretty(octet_length(jsonb_agg(block)::text)::bigint)
FROM posts,
  jsonb_array_elements(content) AS block
WHERE id = 1
  AND block->>'_type' = 'block'
  AND block->>'style' IN ('h2', 'h3');

+----------------+
| pg_size_pretty |
|----------------|
| 5127 bytes     |
+----------------+
Less data is smaller, big surprise!
This is useful information for this specific query, but measuring queries individually is tedious. Ideally, we want to monitor the size of every query generated by our application and see usage patterns over their lifetime. Fortunately, Insights does this for us.
With Insights
PlanetScale Insights monitors the queries performed in your database. These statistics can be viewed in the dashboard and are made available to agents via the PlanetScale MCP server.
Often, developers use Insights to measure query latency to improve performance, but it also provides many other statistics, such as bytes returned.
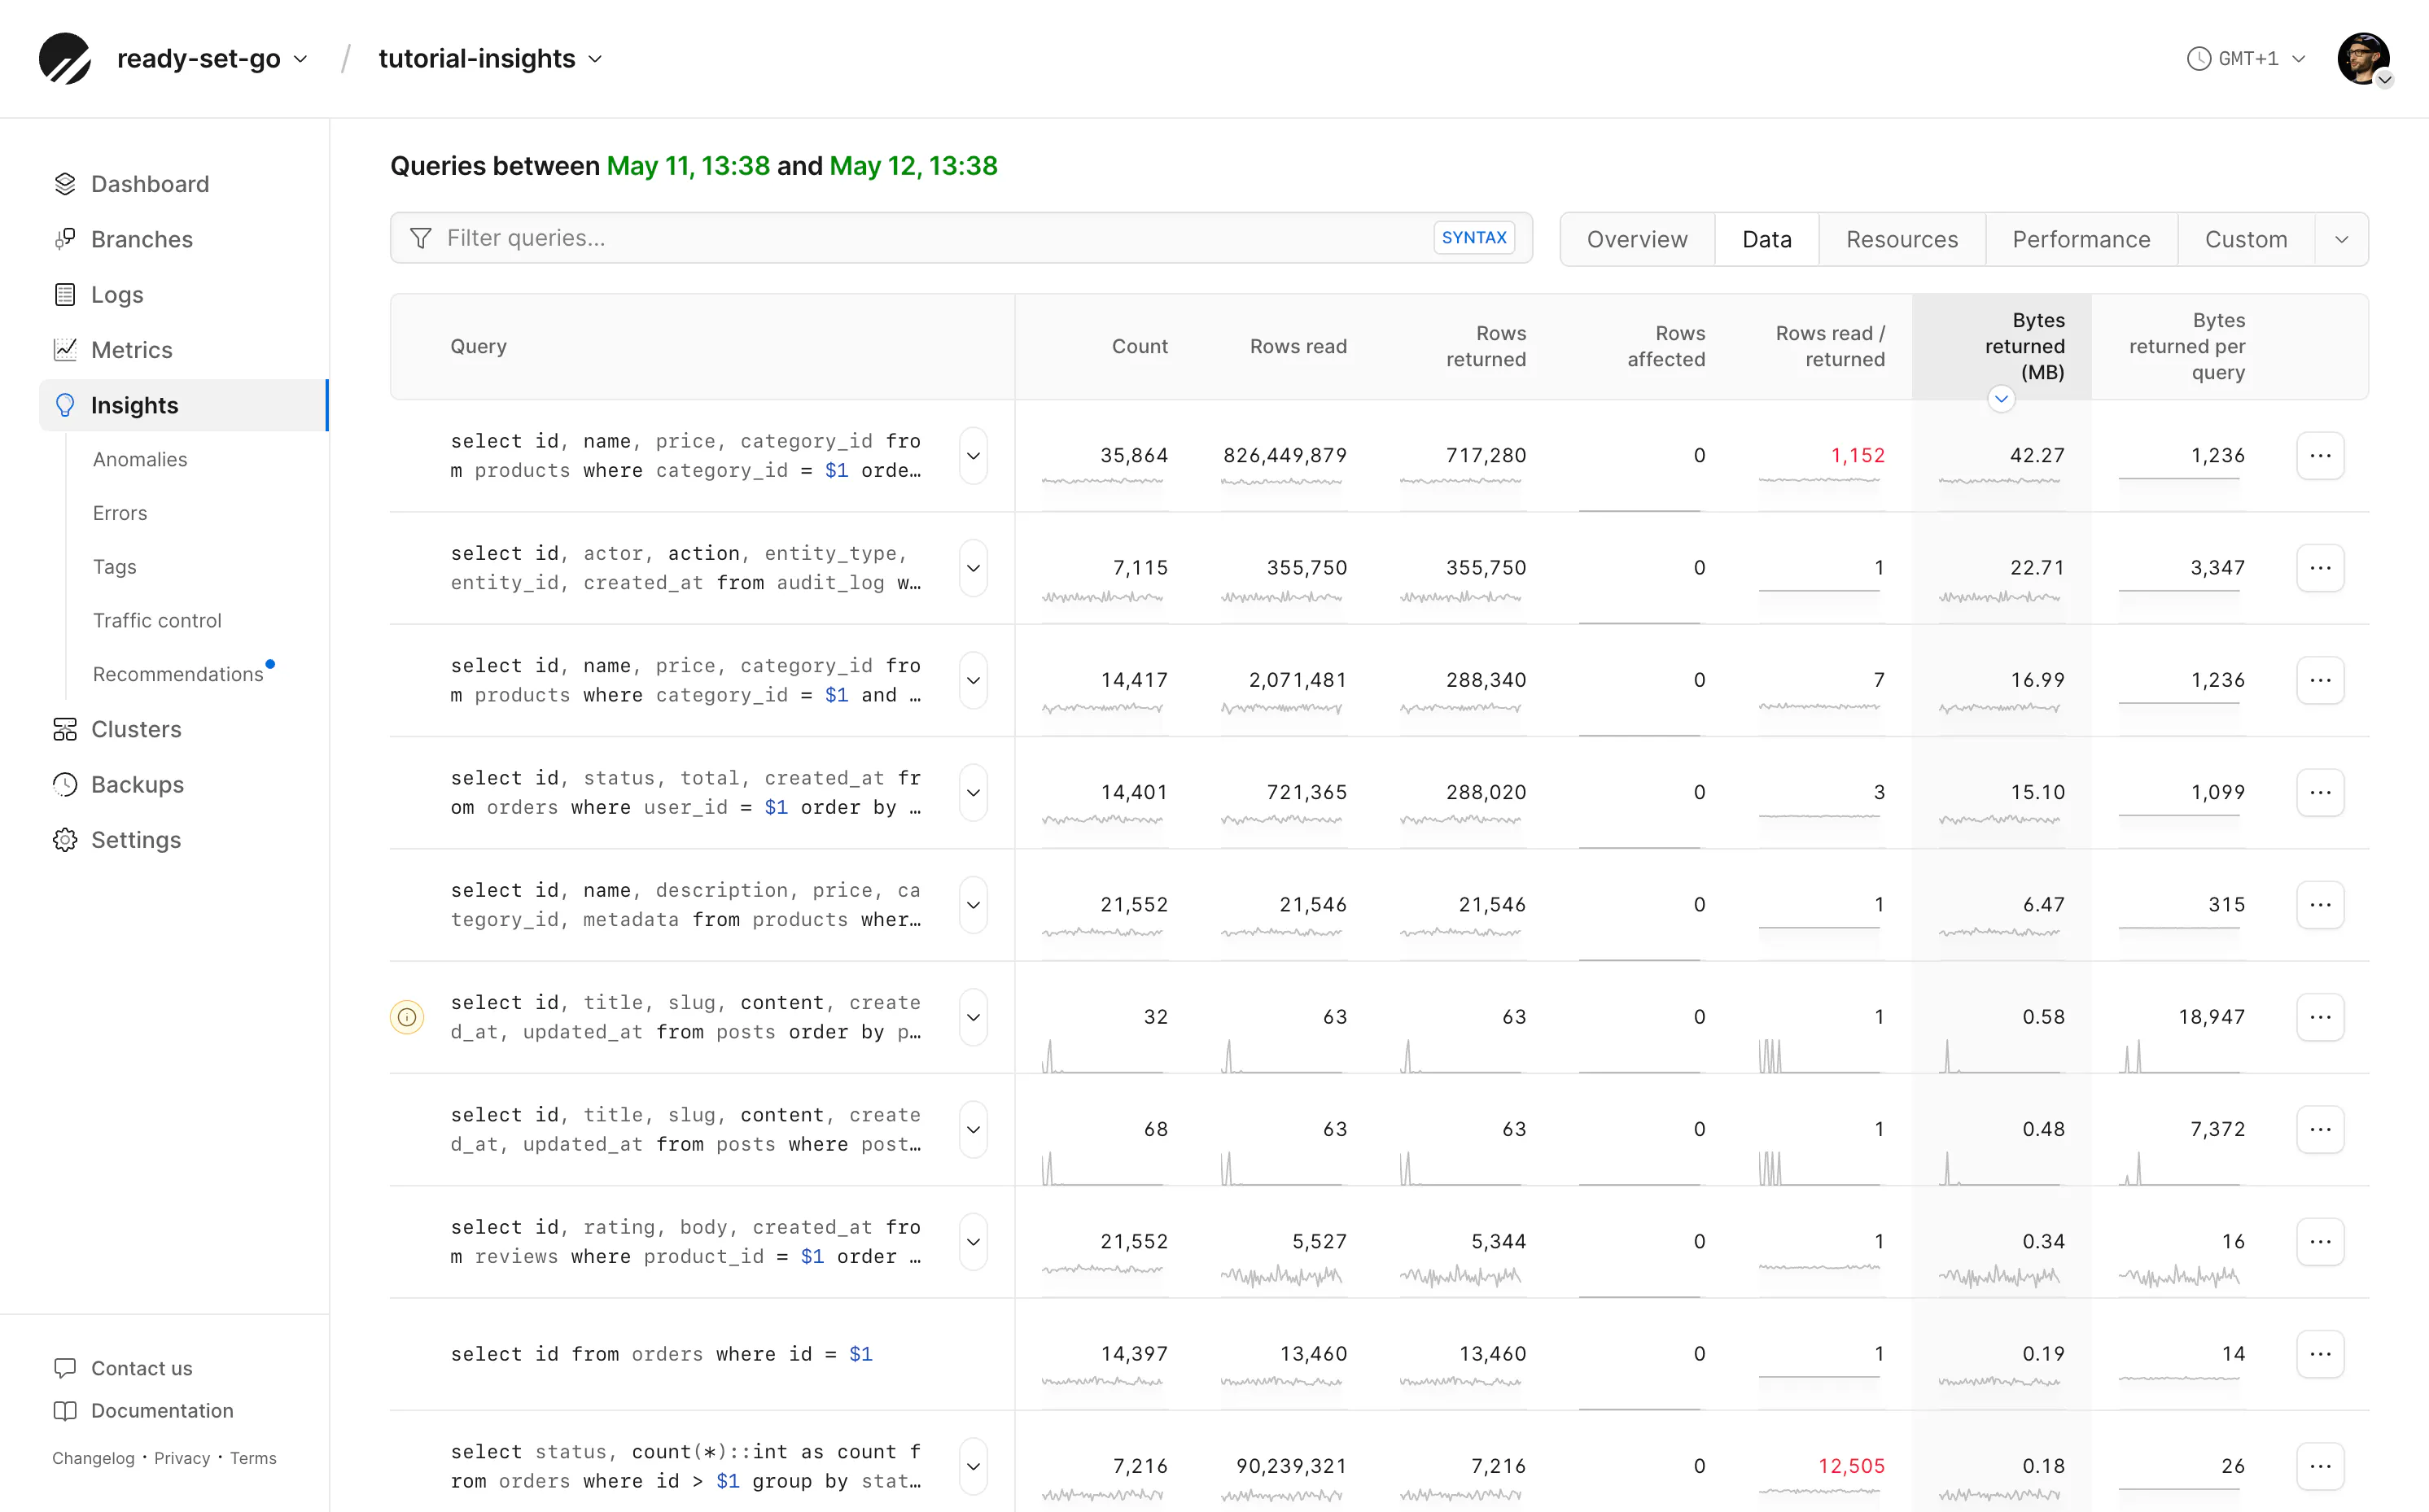
Open Insights and from the query list select the "Data" tab. These tabs contain preset columns relevant to debugging specific scenarios. Here we've sorted by "Bytes returned per query" and can see the largest transfer size of all queries in the currently selected time period.
Consider a query that returns 37 KB per call. Run 100 times, it transfers less than 4 MB and is probably not worth optimizing. Run 100,000 times, it transfers nearly 4 GB. Sort by the queries with the highest total bytes returned to find improvements which may have the most impact.
Look for frequently run, large-byte-transferred queries to identify opportunities for improvement.
Egress and ingress metrics
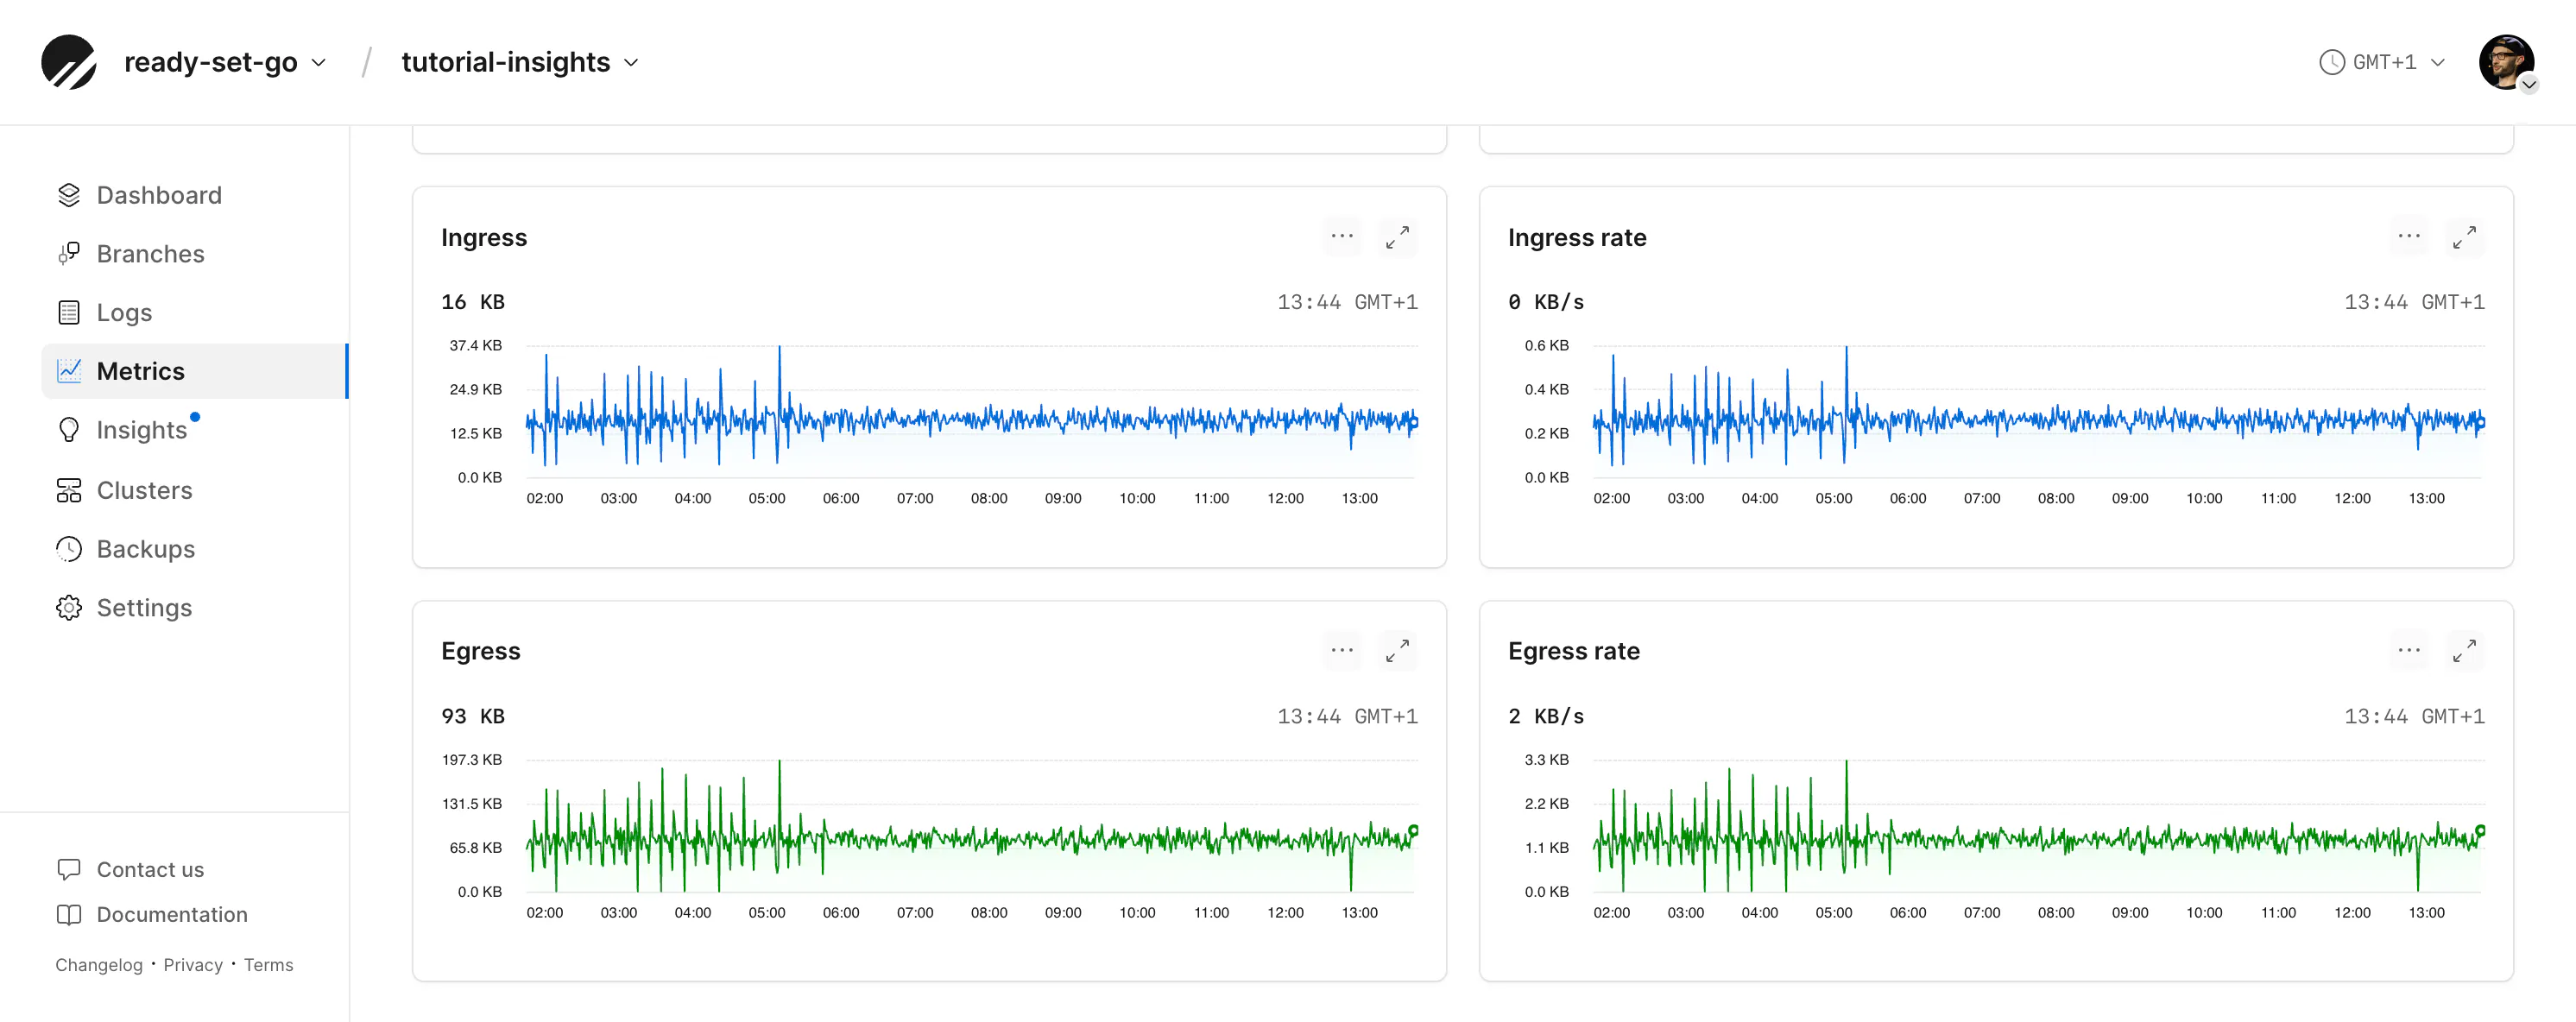
For PlanetScale Postgres databases, the overall volume of egress and ingress can also be measured in the Metrics tab. At the bottom of this tab are graphs for ingress and egress.
From here, you can look for spikes that correlate with queries run at particular times to find any outliers.
Read more: Metrics in the PlanetScale docs
Tagging classes of queries
Additionally, on PlanetScale Postgres, if you know your application contains several related queries you'd like to monitor collectively for egress or performance, query tagging is a way to link them.
Query tags are added using the SQL Commenter format. By adding tags, for example, we can tag every query that requests or updates a row with portable-text so that we can measure all these queries together.
SELECT
	id, content
FROM
	posts
LIMIT
	10
/* returns='portable-text' */;
From the "Tags" page in the dashboard, we can now view queries with just this tag and measure their transfer sizes more cleanly.
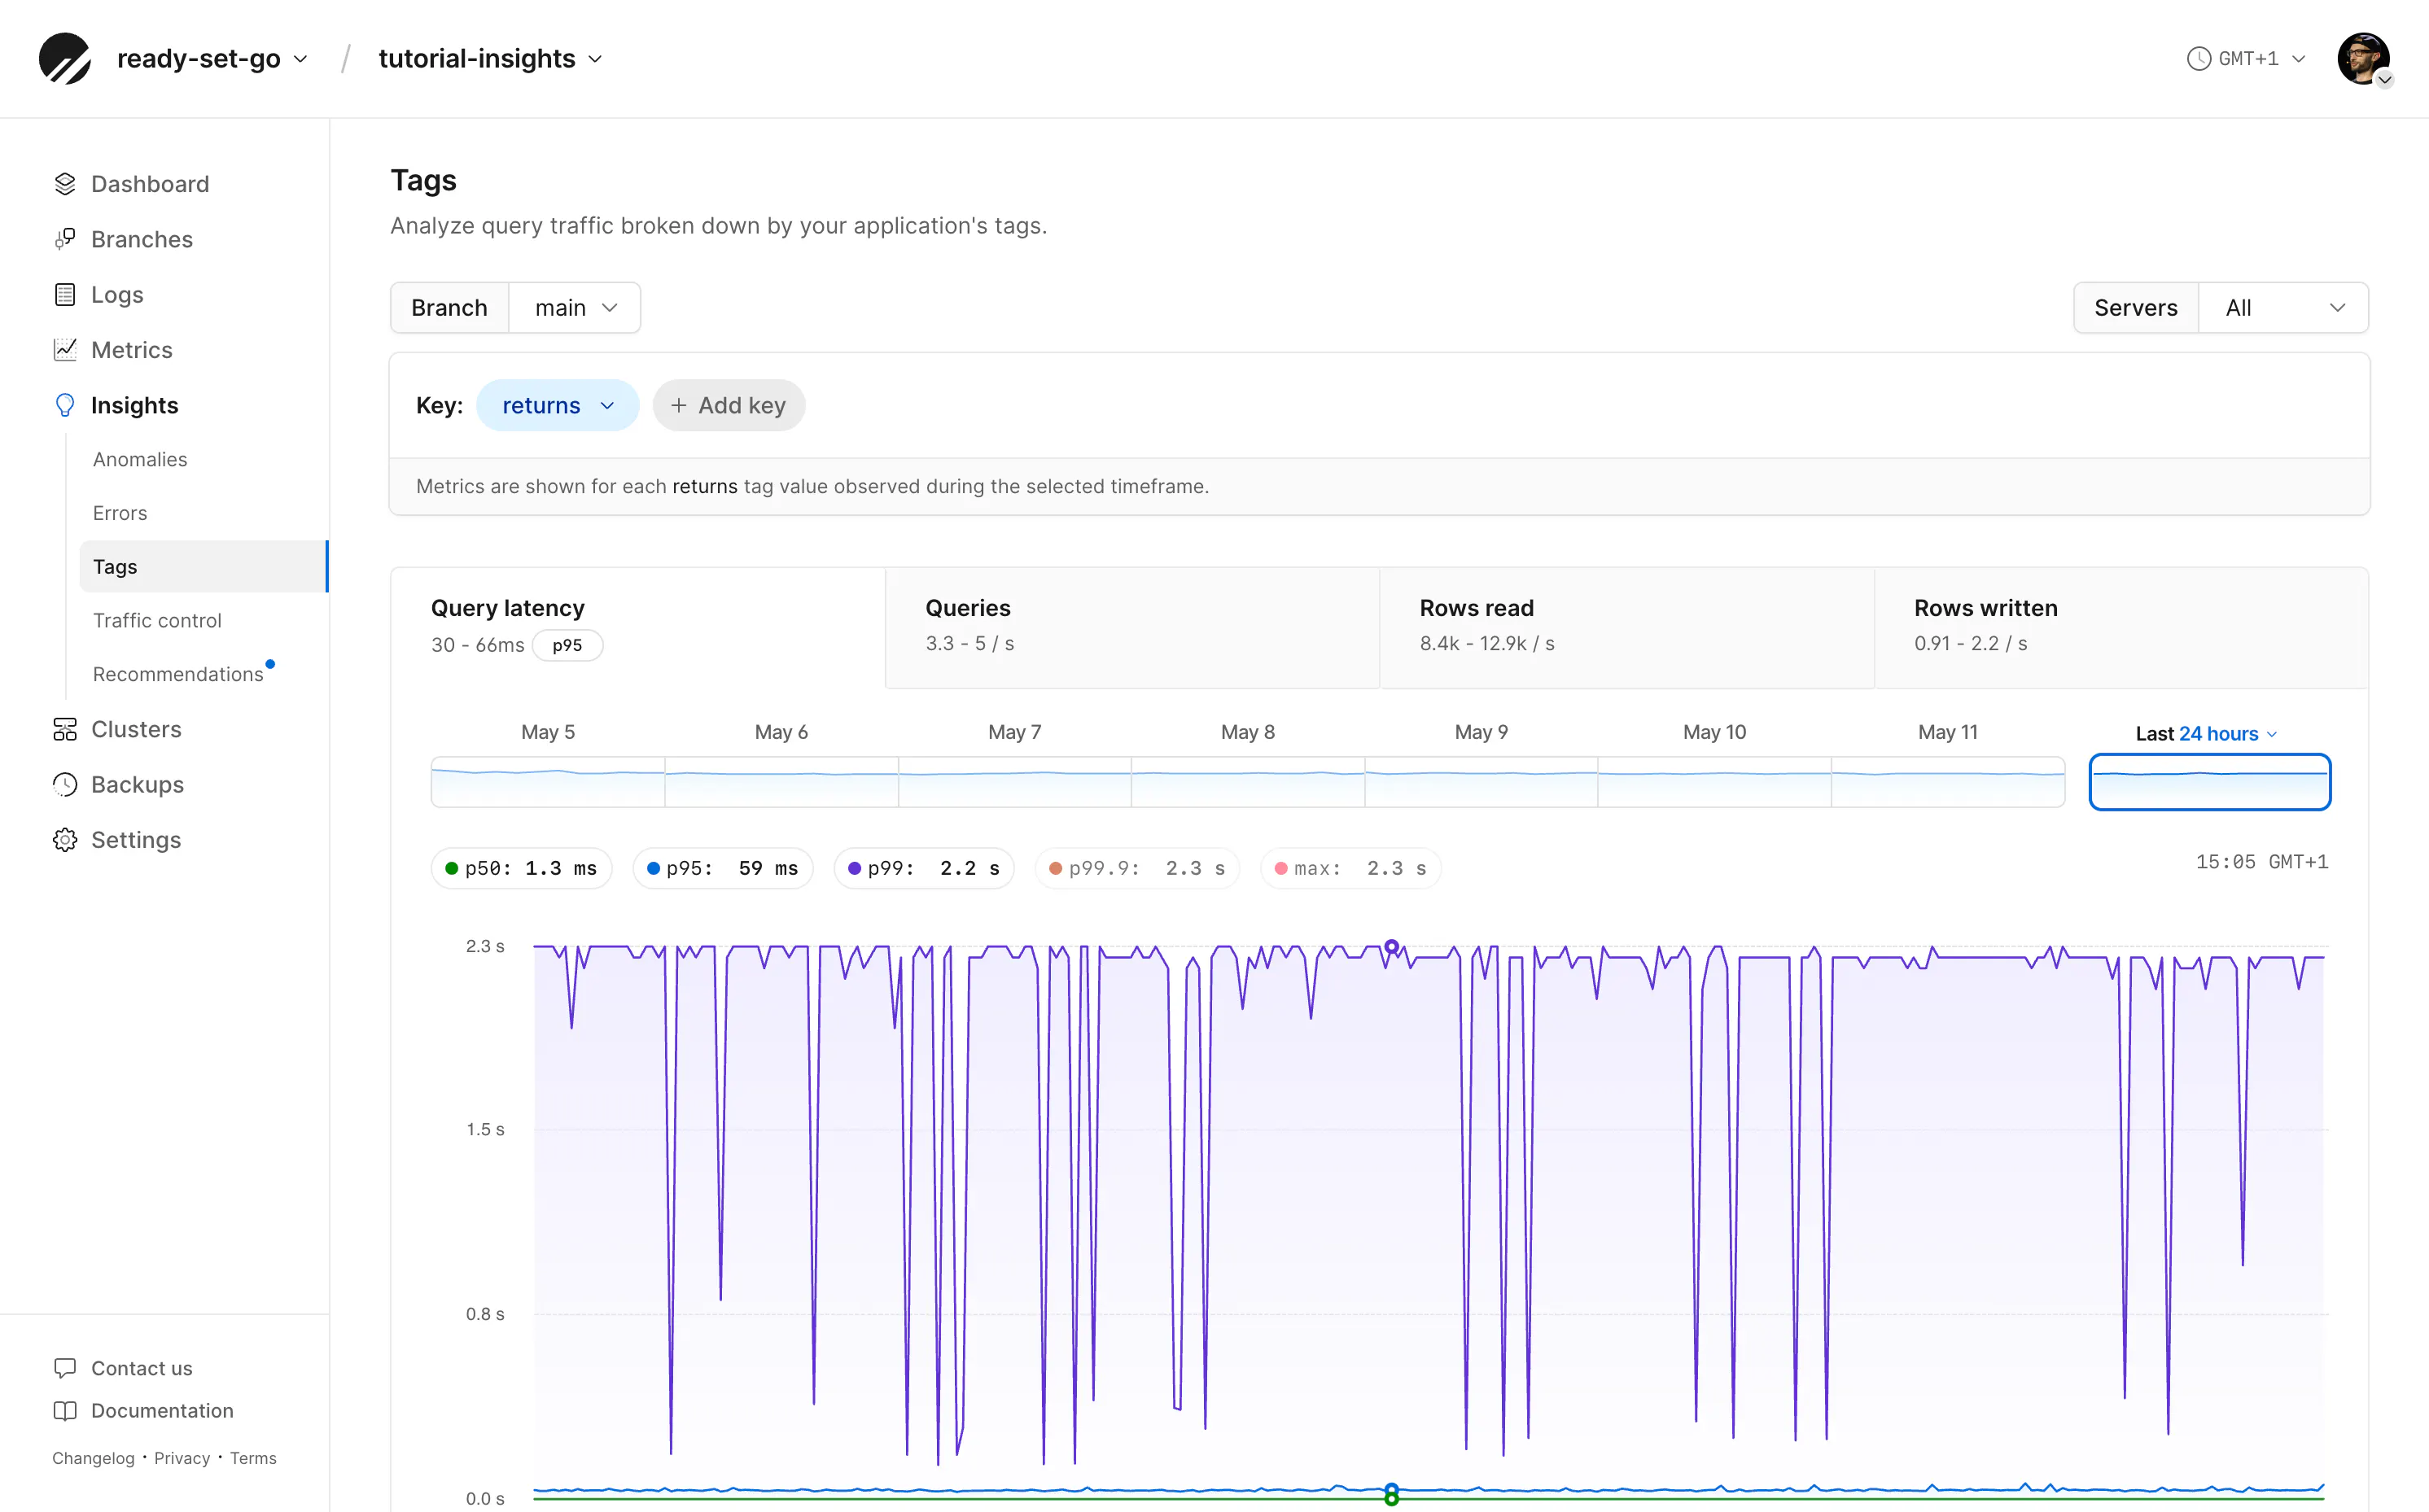
Read more: Tags in the PlanetScale docs
Conclusion
Don't wait until things start getting expensive before thinking about egress. Optimizing early can result in more declarative queries, cleaner code, faster responses, and lower resource demands on your database.
Connect your agent to the PlanetScale MCP server and prompt your agent to find opportunities to improve your application's database egress usage.
From the point of view of an application developer that understands efficient database usage patterns, interrogate our code base for examples where we are querying for columns of data that the application is not using, returning data from updates or inserts that we do not need, or improvements to reduce the frequency or quantity of queries performed for the same data. Read https://planetscale.com/blog/database-egress for more details.