Insights: max latency reporting
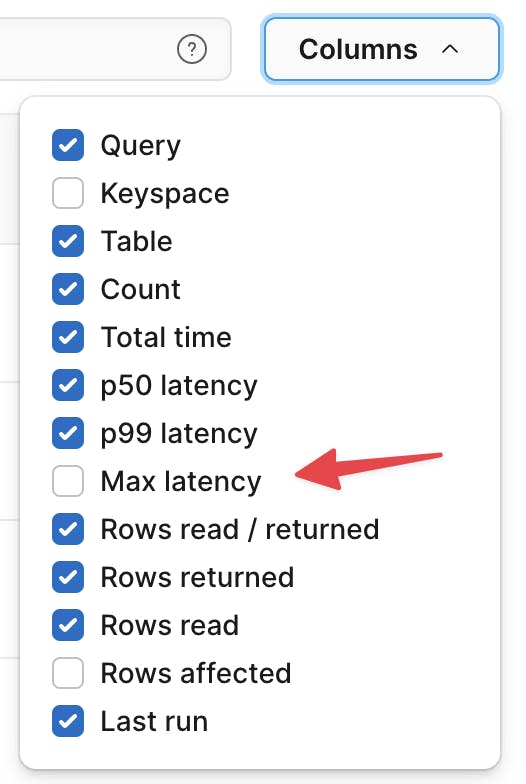
We've added a new column in the main Insights view: max_latency. This column shows the maximum response time of any individual query pattern in the selected time window. Maximum is often a useful metric for spotting extreme outliers that may not show up in p99 (99th percentile). To enable the Max latency column, visit your Insights dashboard, click on the columns menu to the right of the query filter search box, and check "Max latency".

You can also filter query patterns based on max latency by adding max_latency:>x where x is measured in miliseconds.