For the last decade, Kubernetes has been the backdrop to most of my work: operating clusters, helping build hosted Kubernetes, and writing Kubernetes operators. At PlanetScale, that now means running stateful systems like Postgres and MySQL in production. Kubernetes has many faces, but here I want to talk about one face only: why it is so good at running workloads at scale.
People ask me what an operator actually does. The canonical answer is: "it reconciles desired state." This is correct, but it also tells you almost nothing.
An operator is a feedback controller. It's the same closed loop that runs a thermostat or keeps your car at a fixed speed on cruise control. In our case, the thing being controlled is a database. I have been building these loops for years, and the best way I know to make them click is to ignore Kubernetes at the beginning. Kubernetes is full of control theory, even if we don't call it that in the day-to-day.
Before we look at a single line of Kubernetes, we're going to run a production database by hand and slowly let the feedback loop appear on its own. Then we'll map that loop to Kubernetes, with the pieces production needs: a store, watches, queues, retries, and more. At the end, we'll look at what one of these loops looks like in a real operator.
Note
A working understanding of containers and kubectl helps, but you don't need to be a Kubernetes expert. I'll use terms like idempotent, fan-in, and eventual consistency, and introduce the parts that matter as we go.
We're going to start slow and gradually ramp things up. Each part builds on the previous.
Part 1: running Postgres by hand
One container, one machine
Let's start from scratch. I want to run Postgres on a Linux box, and I need it inside a container. To start it, we run:
docker run -d --name pg \
  -e POSTGRES_PASSWORD=secret \
  postgres:18
That's it. Postgres is running. My app connects to it, writes some rows, and everything works fine. But then the machine goes away: the cloud provider reclaims the instance (hardware fails, or a spot instance gets taken back), or I ship a new version of my setup, which means stopping the old container and starting a fresh one in its place. Either way, the container is replaced, and my data is gone. The container storage was ephemeral, and I did not attach any persistent volume to it.
There is already a gap between what I want (Postgres, running, with my data) and what I have (a container whose storage disappears when the container or node goes away). The rest of this post is about that gap and the machinery we build to close it.
Pick a node, by hand
Imagine we have hundreds of nodes (servers) we can use. I already have other workloads running on them. I need to decide which one runs this database. So I ssh into the box that looks the least busy and start the container there.
ssh node-07 'docker run -d --name pg ... postgres:18'
I picked node-07 because it looked idle enough. I start keeping track of it, save it in some sort of config file, and push it to some repo.
It needs a real disk
Container storage is ephemeral, so I have to attach a real block device. In the cloud this is an EBS volume (e.g. on AWS); on bare metal it's a physical disk. Assuming it's a block device, this is what we usually do: provision the volume, attach it to the node, format it, mount it, and point Postgres' data directory at the mount.
# provision + attach first with cloud CLI, then on the node:
mkfs.ext4 /dev/nvme1n1
mkdir -p /var/lib/pg-data
mount /dev/nvme1n1 /var/lib/pg-data
docker run -d --name pg \
  -e POSTGRES_PASSWORD=secret \
  -v /var/lib/pg-data:/var/lib/postgresql \
  postgres:18
These are a lot of steps, and each one can fail halfway. And if the disk fills up later, Postgres stops accepting writes and we have to resize the volume by hand: first through the cloud provider, then again inside the filesystem.
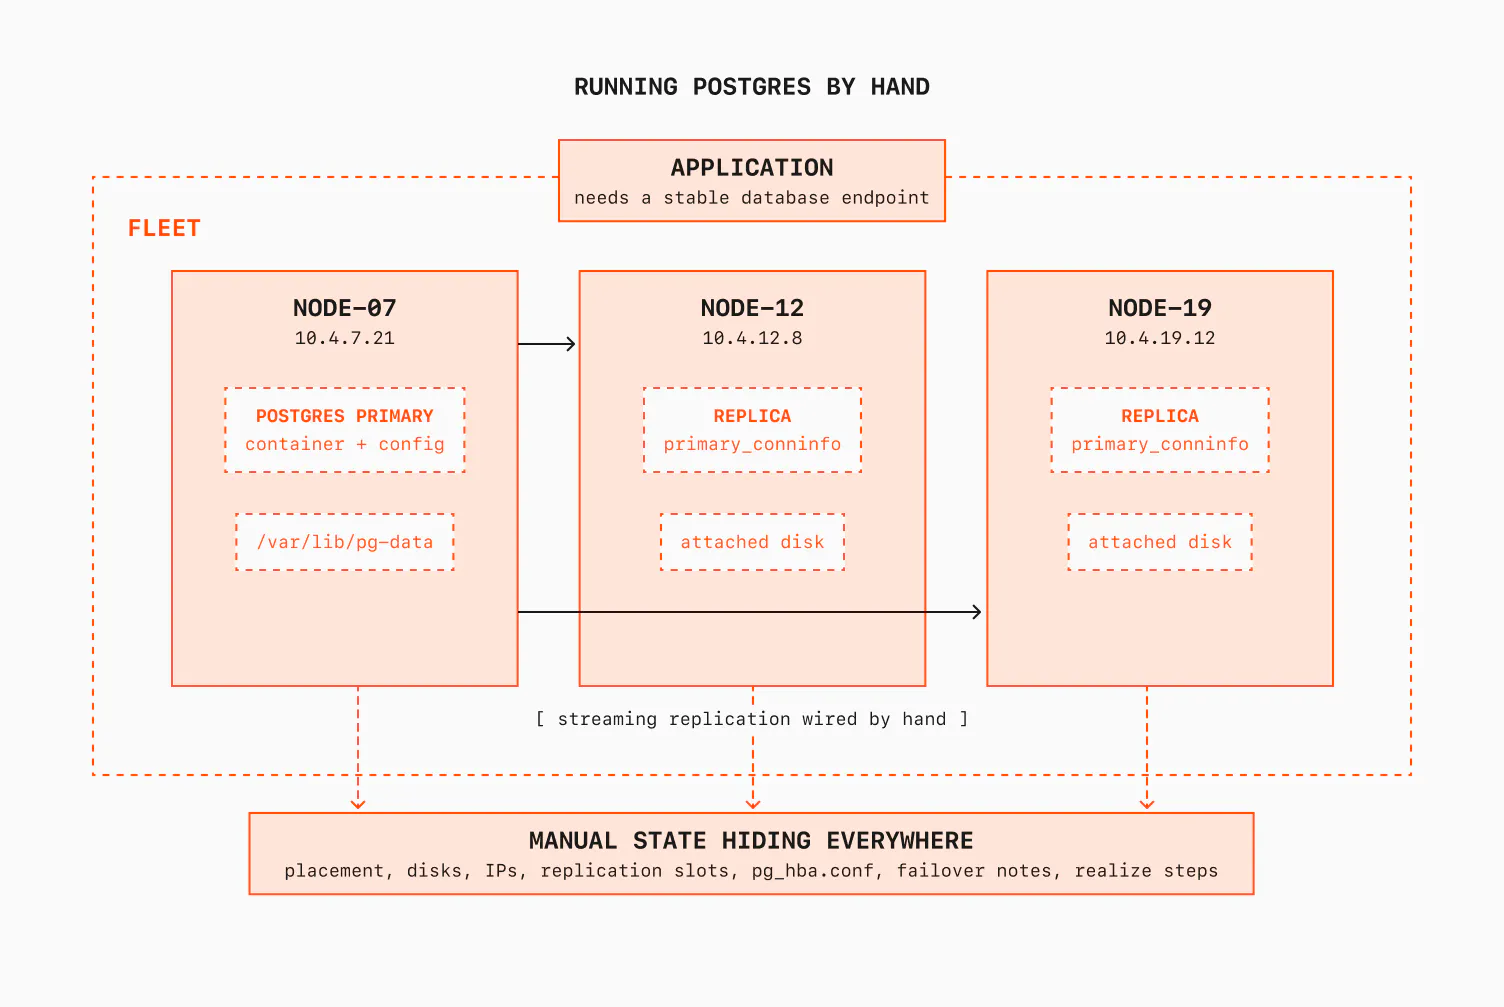
One isn't enough
A single Postgres instance is a single point of failure. We want high availability: one primary and two replicas. These need to be on three different machines, with streaming replication between them. So we do the same steps again, three times, on node-07, node-12, and node-19. I also wire up replication by hand: primary_conninfo, replication slots, all of it.
Now we have three nodes with three Postgres instances. One of the instances is the primary (here it's node-07). But this raises new problems, like what to do if the primary's node dies?
They have to find each other
Here is another thing we have to solve. The replicas need to reach the primary, and the primary needs to accept their connections. And every one of these addresses is an IP that changes when a container restarts.
The first thing I do is hard-code the IPs. I write node-07's address into the replicas' config, I list the replicas' addresses in the primary's pg_hba.conf, and I keep a small /etc/hosts table and save it somewhere.
# on each replica's postgresql.auto.conf, until the primary is recreated with a new IP
primary_conninfo = 'host=10.4.7.21 port=5432 user=replicator ...'
But we still have a problem: the first time the primary is recreated with a different IP, the whole cluster falls apart.
The watchdog script
Now, this is where we start thinking about how to solve these issues. Everything described so far can break, and will continue to break even if I fix it:
- A replica process dies and doesn't come back.
- A disk gets full.
- The primary fails and a replica has to be promoted.
- A config I changed on two nodes but forgot on the third one. They are now out of sync.
Let's assume we've set up a simple uptime monitor and we're going to get paged for all these cases. To avoid getting paged at night, we do the sensible thing: write a script. So we decide to write a loop that wakes up every few seconds, looks at each node, and fixes whatever's wrong.
while true; do
  for node in node-07 node-12 node-19; do
    if ! ssh "$node" 'pg_isready -q'; then
      ssh "$node" 'docker start pg'       # it died, bring it back
    fi

    usage=$(ssh "$node" "df --output=pcent /var/lib/pg-data | tail -1 | tr -dc 0-9")
    if [ "$usage" -gt 80 ]; then
      grow_volume "$node"                  # disk filling, make it bigger
    fi
  done
  sleep 5
done
It's written in Bash, and probably has tons of bugs. You notice something here? The loop doesn't care how the database got into a bad state. Every five seconds it looks at the current state of the world and asks this question: does reality match what I want?
If a process is down, start it. If a disk is filling, grow it. Run the loop once or run it a thousand times and the result is the same, because each action is conditional on the current state. The script is idempotent.
Changing a parameter
Let's make things a little more complex. I need to raise max_connections from 100 to 500. This one is not a reload-only change. PostgreSQL says it can only be set at server start, so the manual version is to ssh into each box, edit postgresql.conf, restart Postgres, and check that it took on all three.
Because I know that ssh'ing into the nodes manually isn't a thing I want anymore, I do the same thing we did previously: I write the desired value down in one place and teach the loop to enforce it.
WANT_MAX_CONNECTIONS=500

for node in node-07 node-12 node-19; do
  have=$(ssh "$node" "psql -tAc 'show max_connections'")
  if [ "$have" != "$WANT_MAX_CONNECTIONS" ]; then
    ssh "$node" "sed -i 's/^max_connections.*/max_connections = $WANT_MAX_CONNECTIONS/' /var/lib/pg-data/postgresql.conf"
    ssh "$node" "docker restart pg"
  fi
done
This is the same idea as before. I read what I want (a variable). Observe what I have (a query). If they differ, I take an action to close the difference. Again, I don't track whether I changed it last time. All I do is compare and converge, every loop.
What we actually built
I started with a desired state that was written down in one place: three instances, this disk size, max_connections = 500. Every few seconds I observe the actual state of the system. I compute the difference. I take whatever action closes that difference. Then I do it again, forever.
That's a closed feedback loop. The word "closed" matters. It means the output of the system is fed back into the next decision. I don't run docker start and assume the database is fine. I check the database again. If it is still wrong, I act again. If it is already correct, I do nothing.
The nice part is that the same loop works for different problems. It can restart a dead process, grow a disk, or push max_connections = 500. The action changes, but the shape stays the same: read what I want, observe what I have, compare them, act, repeat. If I draw the same thing as a block diagram, with the control theory names added, it would look like this:
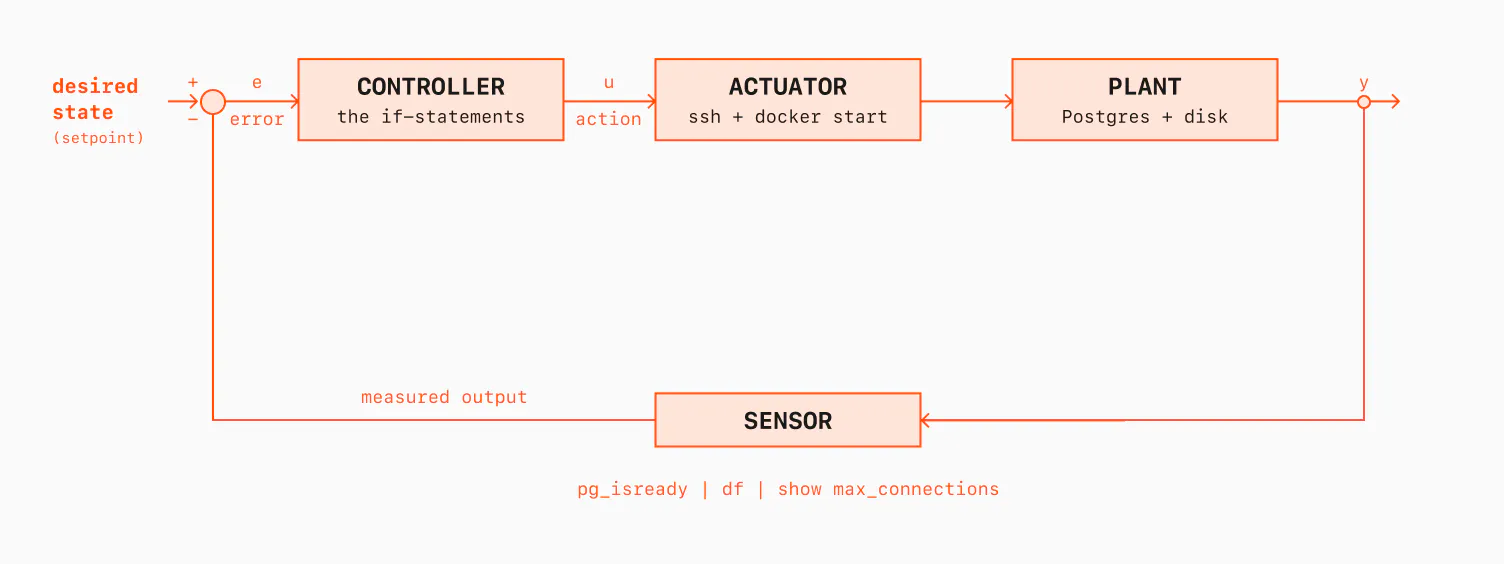
Here is how the vocabulary from control theory maps cleanly onto my shell script:
- The setpoint is my desired state, the variables at the top of the script (disk size, max_connections and so on).
- The measured output is what I observe:
pg_isready,df,show max_connections. - The error (e) is the difference between them.
- The controller is the body of the loop, the
ifstatements that decide what to do. It is not the whole script. - The actuator is what carries out the action:
sshplusdocker start. - The plant is the system being controlled, Postgres and its disk.
That also gives us a nice way to understand open-loop control. My very first attempt, ssh in, run the command, and walk away, was open-loop: fire an action and assume it worked. The Bash script is closed-loop because it keeps feeding the measured state back into the next decision.
A Bash loop is not a production control plane. Just to name a few issues with it:
- It has no concurrency control, so two copies of the script can race each other. Imagine both deciding to promote a different replica.
- It keeps its only real state, "am I mid-failover?", in a shell variable that could die with the process.
- It polls every node every five seconds whether anything changed or not, which is fine for three nodes, but too expensive for three thousand nodes.
- It has no idea what to do when the
sshitself times out. - And the moment I want a second kind of resource, a connection pooler, a backup job, a read replica in another region, I'm copy-pasting this whole structure.
What if the script also fails? Who runs it then? We could keep hardening this script, but look at where it goes: we would need a real store for the desired state, watches instead of polling, a work queue, retries, leader election. We would be rebuilding Kubernetes. The real platform already exists, and it's Kubernetes.
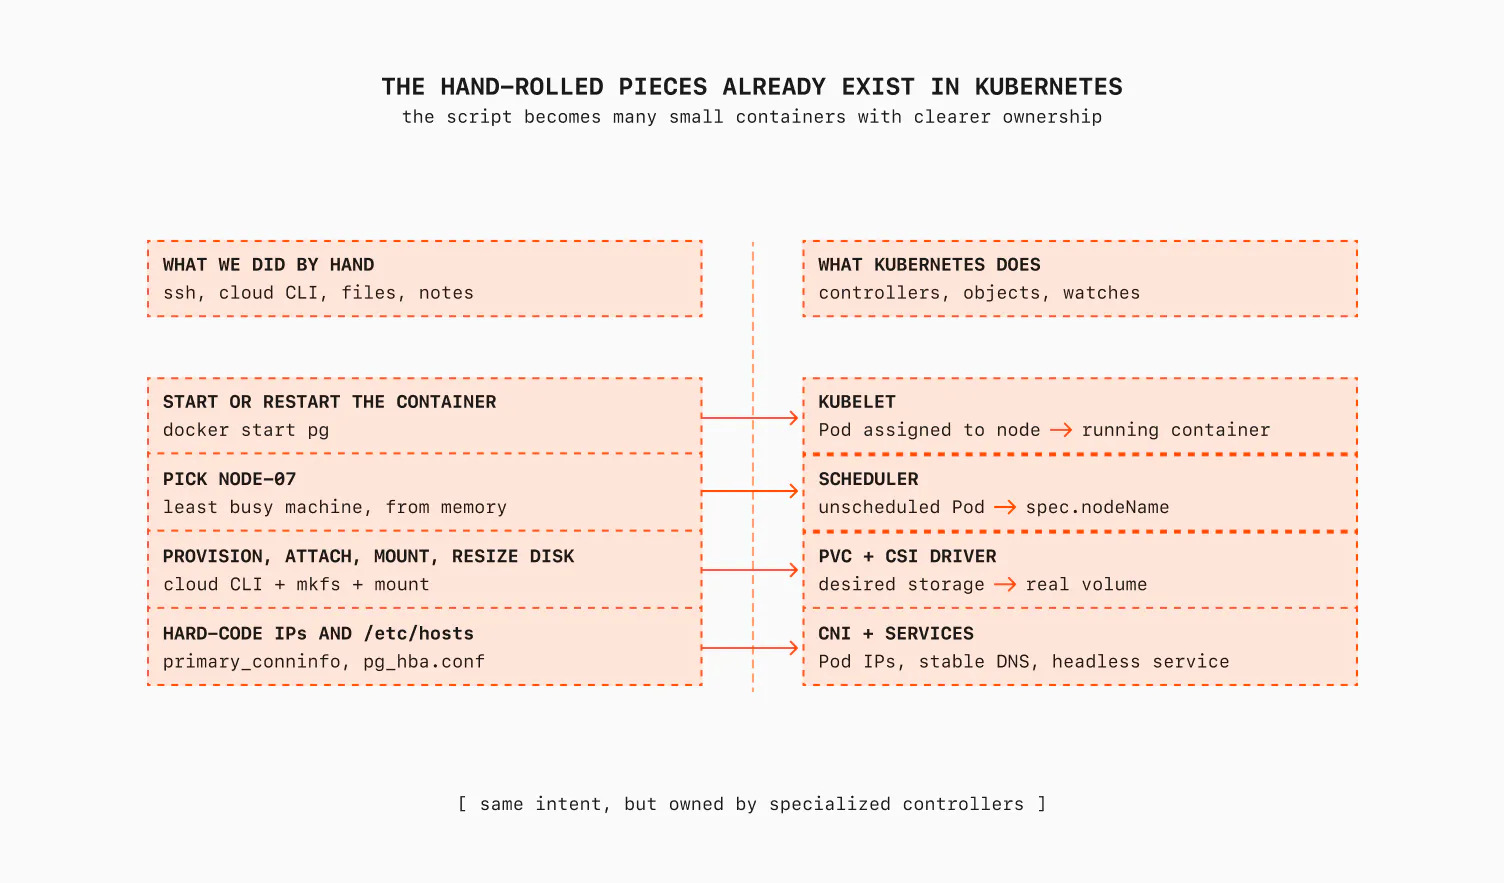
Part 2: how we reinvented Kubernetes
Now we can map what we hand-rolled in Part 1 to Kubernetes. Almost all of it already exists there. The operator is the part we care about.
The other loops
Let's go through some of the pieces we built by hand before the watchdog loop. You already know these components by name. What you might not have noticed is that they also work like controllers.
Spinning up the container: the kubelet. First, a quick definition: a Pod is the smallest thing Kubernetes runs, one or more containers scheduled together on a node and sharing its network. For us it's the Postgres container. On every node runs an agent called the kubelet. Its desired state is the set of Pods assigned to its node, which it learns from the API server. Its observed state is the set of containers actually running, which it gets from the container runtime. When they differ, it starts the missing container, kills the extra one, or restarts the crashed one. My if ! pg_isready; then docker start; fi is the kubelet's job, just done properly. The kubelet doesn't shell into anything; it talks to containerd over a gRPC socket, which talks to runc.
Picking a node: the scheduler. Remember me choosing node-07? That's the scheduler's whole reason to exist. It watches for Pods with no node assigned, filters out the nodes that can't work, scores the rest, and writes the decision to one field: pod.Spec.NodeName. The scheduler doesn't start the container; it records the placement and lets the kubelet pick it up. You will realize that most things in Kubernetes are decoupled like this.
Attaching the disk: CSI and the PV/PVC sync. My multi-step mkfs and mount script becomes a PersistentVolumeClaim, which is a declarative request for storage. The Container Storage Interface (CSI) driver turns that request into a real volume. CSI itself is a set of controllers and sidecars: one provisions, one attaches, one resizes, and so on, while the kubelet calls the driver's node plugin to do the actual mount. It's a family of controllers. If there is a PVC but no disk behind it, one controller creates the disk. If the PVC size increases, another controller calls the provider API (e.g., AWS ModifyVolume). Again, I write intent, and a controller does the actual work. (note: I wrote one of the early production CSI drivers, csi-digitalocean, and a long post about building one.)
Making them find each other: the CNI and Services. The /etc/hosts problem is solved at a layer we no longer have to think about. A CNI plugin gives Pods their network identity; Cilium, for example, does this with eBPF instead of a pile of iptables rules. For stateful workloads, a StatefulSet plus a headless Service gives each replica its own stable DNS name, which is exactly what a Postgres replica needs. The hard-coded IP that broke our cluster becomes a name that keeps working. DNS is only one tool here; other service discovery systems like etcd, ZooKeeper, and Consul solve similar problems.
As you see, all the problems we solved with ssh and various scripts are replaced by Kubernetes components and drivers. And these are just a few of them:
All of this so far is useful context, but the part we care about is our watchdog loop, because that's the one we get to write ourselves.
That's the operator.
The for-loop translated to Kubernetes
In Kubernetes, our watchdog script is a controller, and the standard way to write one in Go is a library called controller-runtime. At its heart, it's a function with a basic signature:
func (r *Reconciler) Reconcile(ctx context.Context, req reconcile.Request) (reconcile.Result, error) {
    // req contains a namespace/name. That's it. That's the whole input.
}
Notice what is missing here: the function isn't told what changed. There is no diff. It isn't handed the old object and the new object. It isn't given an event type. It gets a key, a namespace and a name, and nothing else. It's minimal by design, because it has to work for many different controllers. The function's job is to fetch the object with that namespace/name, look at the world, and converge to the desired state.
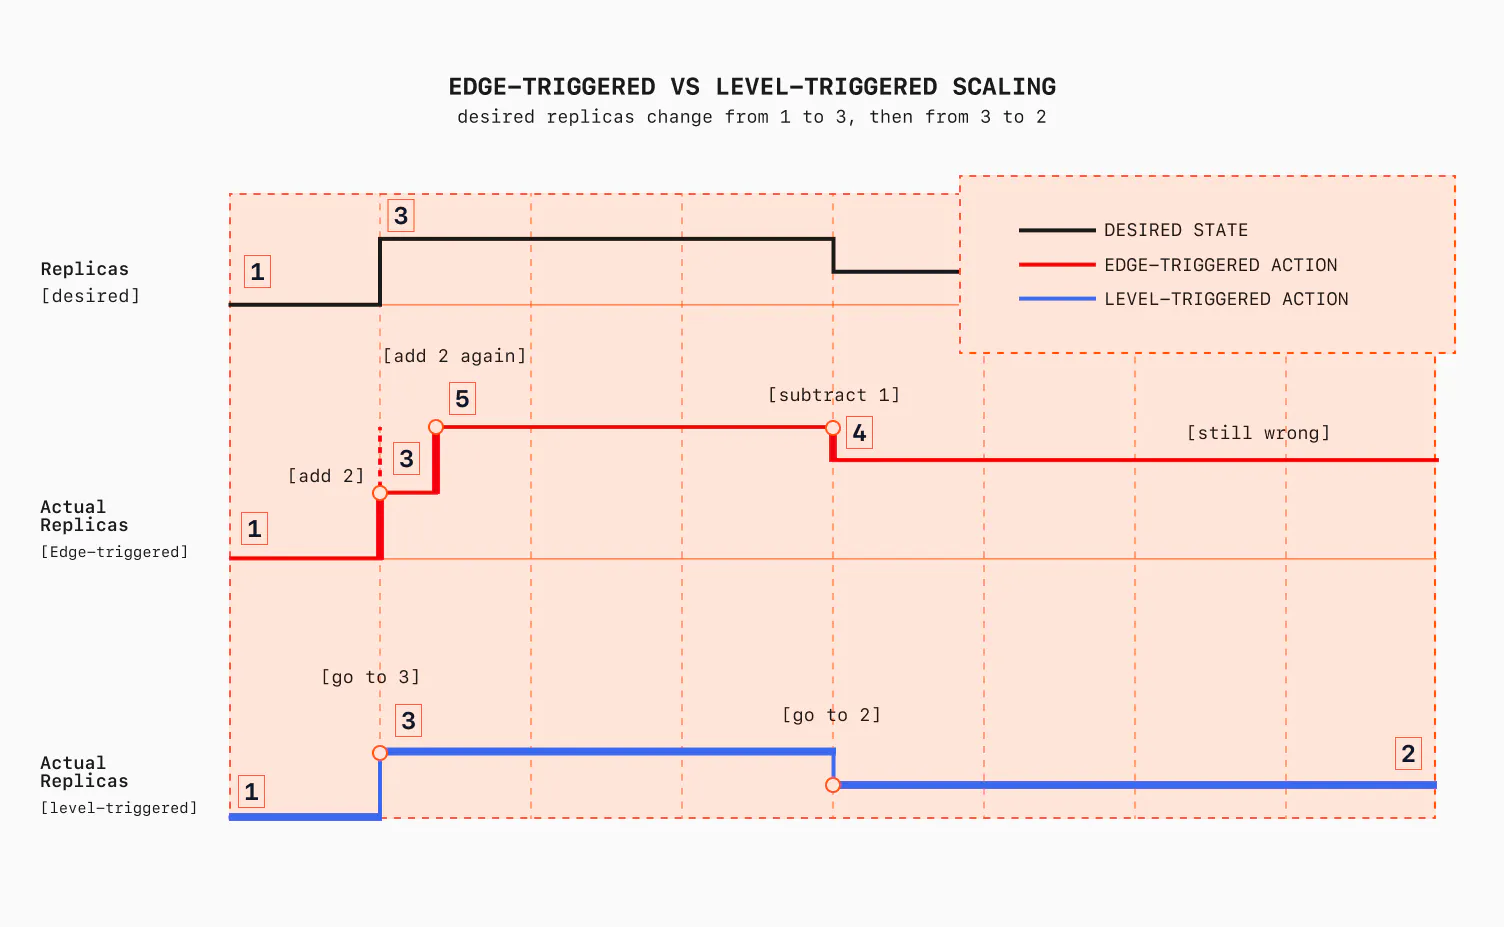
Edge-triggered notifications, level-triggered logic
There are two ways to build any closed feedback loop:
- Edge-triggered: act on transitions, on events. "The disk crossed 80%." "The Pod was deleted." "The number of replicas increased by 2."
- Level-triggered: act on the current state, regardless of how you got there. "The disk is at 85%." "The Pod is missing." "The number of replicas is 3."
My first mental model of controllers, and probably yours at some point, was edge-triggered: listen to a stream of changes, and for each change, try to converge.
The problem is that this is very fragile. In distributed systems, if one component is fragile, the fragility spreads to the rest of the system. Why is edge-triggering fragile? Say your controller is down for thirty seconds. It misses the events from those thirty seconds, and its view of the world is now permanently wrong. If two events arrive out of order, you process them out of order. If an event is delivered twice, you act twice. You're rebuilding your state from a stream of events, and you've inherited all of event sourcing's hard problems.
Here is a very concrete example. Assume you have 1 replica, and you increase it to 3 replicas. Because you have only subscribed to changes, either:
- You miss the event (maybe the queue dropped it, or the consumer, your app, dropped it due to a crash or a full buffer).
- You receive it twice.
In the first case, you won't be able to self-correct. In the second case, if your handler blindly applies the delta again, you'll end up with 5 replicas (you overshoot), instead of 3.
The level-triggered model fixes all of that. Remember, our shell script never asked "what changed?" It asked "what is true right now?", every five seconds, from scratch. Miss a loop, and the next one catches up. Run the loop twice, and you get the same result. The current state of the world is the only input that matters, and it's always available to read. So in the level-triggered case, our example above becomes this: you read replicas=3, you check the current number of replicas, which is 1, and you increase by 2.
If you miss the event, no one cares. In the next reconcile loop you'll catch it. If your app crashes, it comes back, reads again and detects that it did not increase it yet, increases it.
Kubernetes controllers combine both: edge-triggered notifications, level-triggered logic.
Events (the edges) are only a hint that it's worth looking again. They tell you when to reconcile, never what to do. The reconcile itself is level-based: it reads the current state (e.g., replicas=3) and drives toward the desired state (e.g., create 2 replicas), ignoring the triggering event completely. That's why Reconcile only gets a key. The framework makes it hard to write edge-triggered logic, on purpose. Edge-triggered logic is how you get a controller that's fragile and permanently wrong after its first hiccup.
Our bash script stumbled into this property by accident, at least for the sake of the example. But the controller-runtime framework gives it to you on purpose. It's why a Kubernetes controller can crash, get restarted ten minutes later, and converge correctly with no special recovery code. There is no recovery code. There is just the loop. The controller can reconstruct the world from scratch.
Informers, the work queue, and a cache
So where do the edges come from? And what stops a controller from DDoSing the API server by listing everything every five seconds like my script did?
The answer is the informer. An informer opens a single watch against the API server for a given resource type, streams every add, update, and delete, and keeps a complete in-memory cache of the objects we're interested in. Two things matter here:
First, the informer turns each watch event into a key and puts it on a work queue. The queue does a lot of work for you.
- It coalesces: if the same object is updated five times before you get to it, you reconcile it once, against the latest state (level-triggered again).
- It rate-limits: an object that keeps erroring backs off exponentially instead of spinning. This is damping, the same reason a crash-looping container backs off instead of restarting hot.
- It lets you run a pool of workers pulling keys in parallel, which is your fan-out. Events fan in from the watch, collapse in the queue, and fan out to the workers. This is something you need to tune. The higher you set the pool, the more pressure you put on the system: more writes, more API calls, more load on the provider, and more CPU usage in the operator.
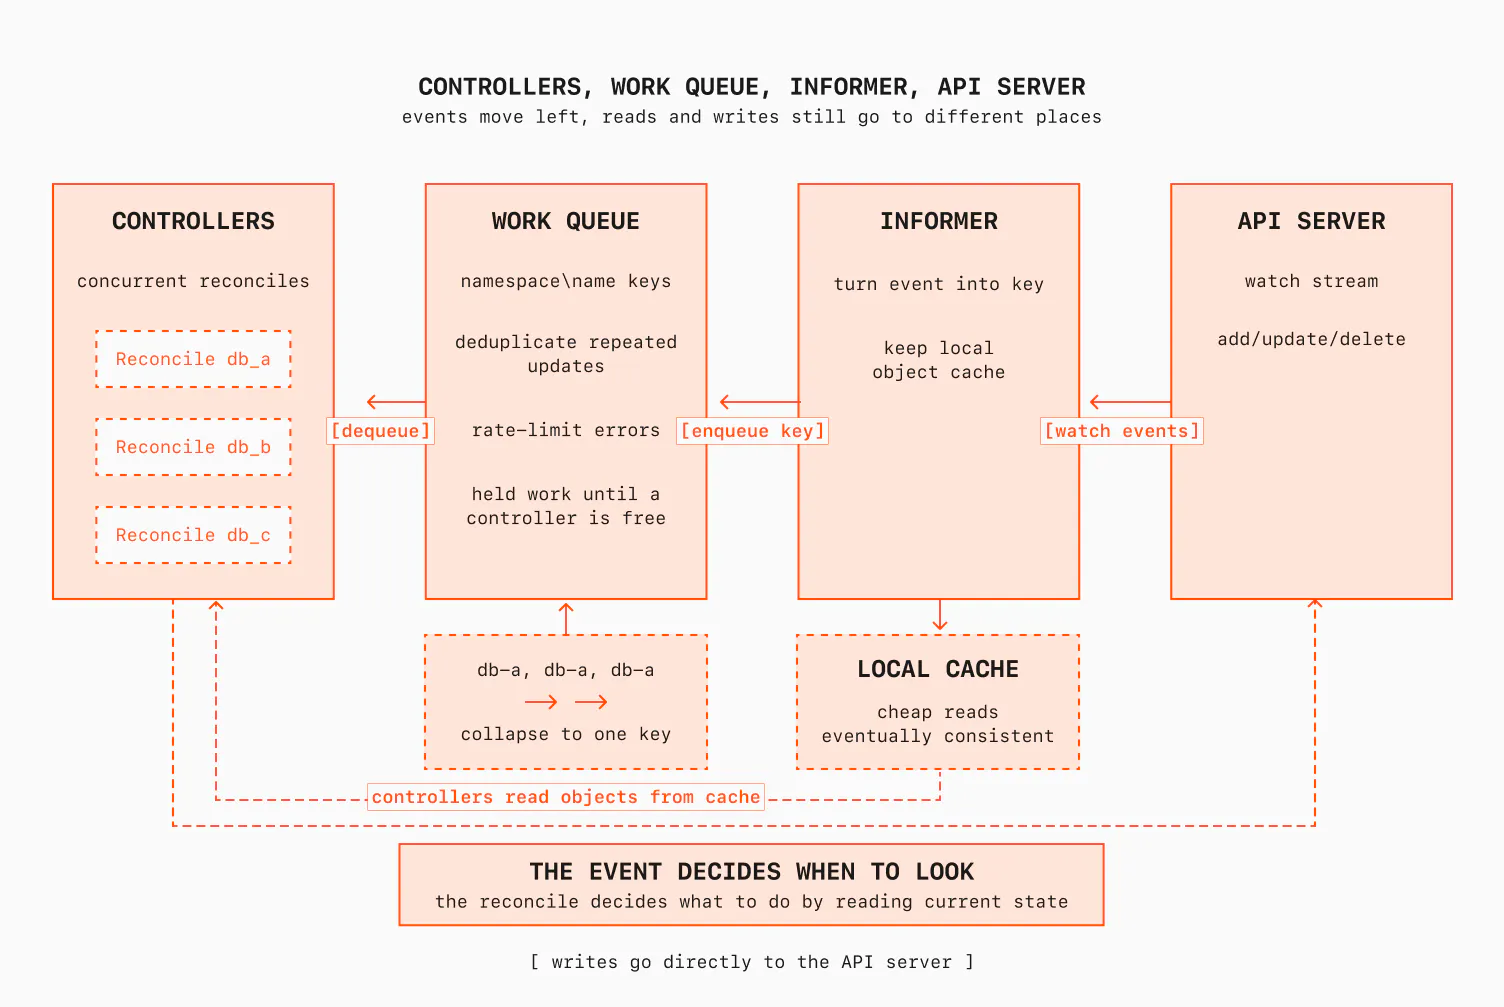
Second, and this is a detail that bites people a lot: your reads and your writes in Kubernetes don't go to the same place.
In controller-runtime, the client you're handed reads from the informer's local cache. Cache reads are cheap, they don't touch the API server, and that's how a controller reconciles thousands of objects without falling over. But your writes go straight to the API server. The cache only learns about your write when the resulting watch event comes back around, a moment later.
Because of that, a read can be stale. You need to be prepared for this.
If you write a field of an object and then read the same object again from the cache, the reconciler might think it's not updated yet. You write again, and you get a Conflict error. Retrying with a fresh read can be fine, but blindly retrying against the same stale cached view just spins.
Most of the time, what you want is to drop the call and requeue. In the next reconcile, the GET will see the updated object, and your write will never happen. That's how everything self-converges.
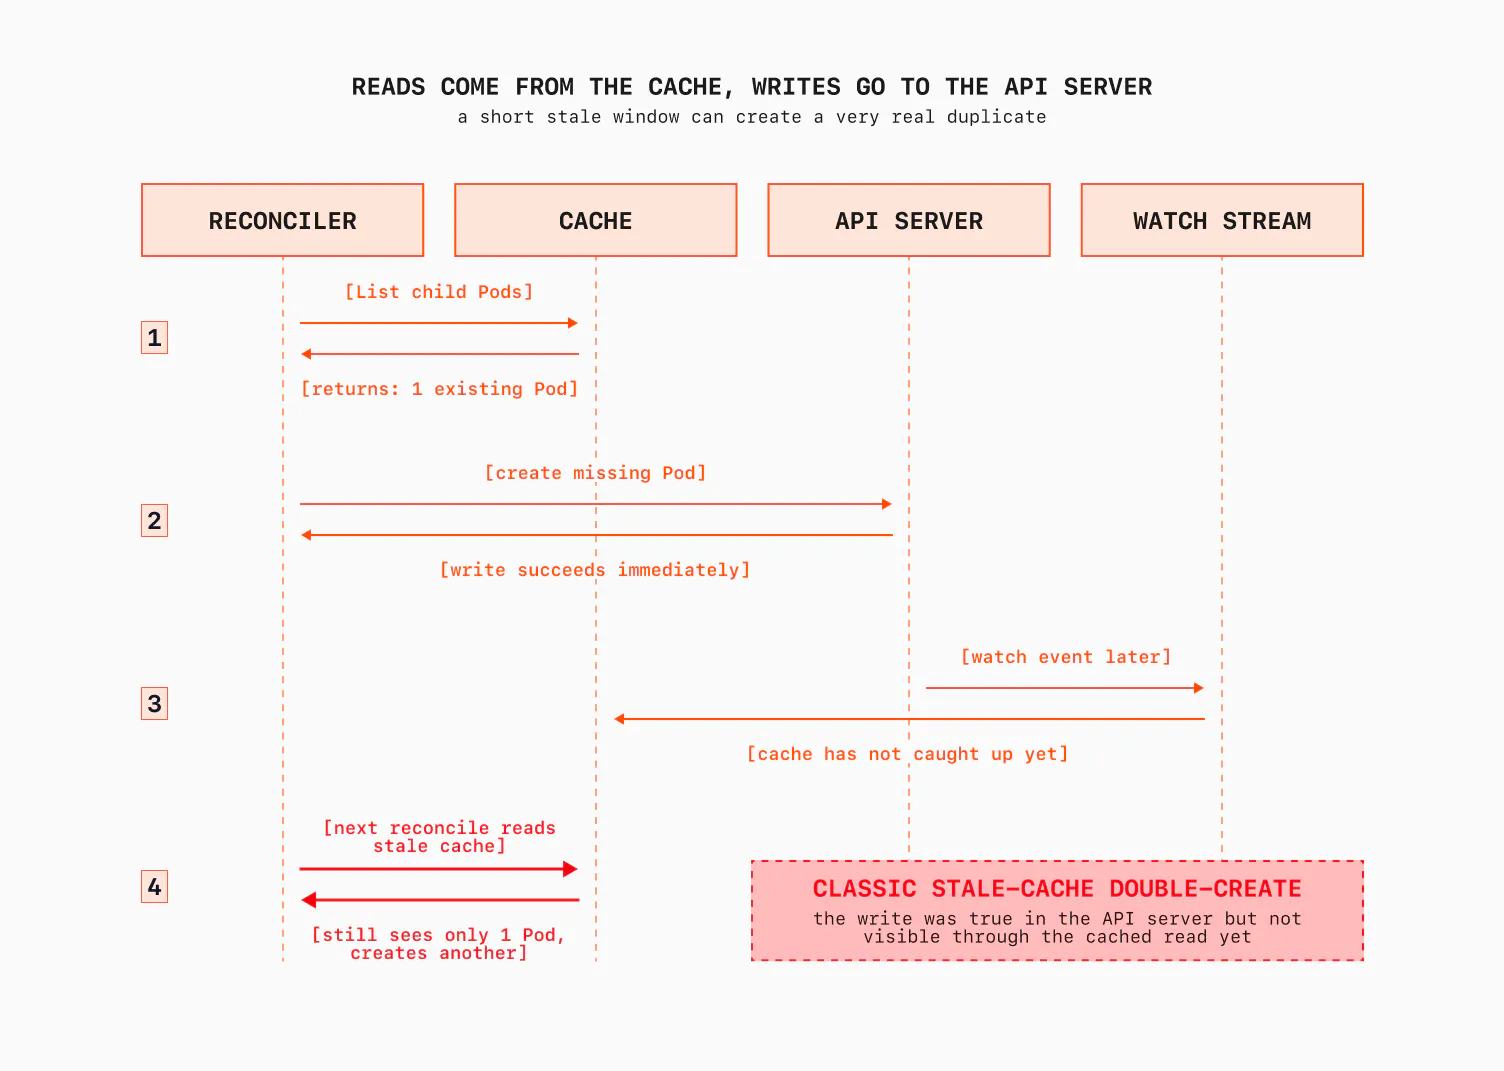
Here is another edge case. Picture this sequence inside a reconcile:
// I want N replicas. I see fewer, so I create the missing ones.
existing, _ := r.listChildPods(ctx)        // reads the CACHE
for i := len(existing); i < desired; i++ {
    r.client.Create(ctx, newPod(i))          // writes the API SERVER
}
Now an event fires again a second later, before the cache has caught up with the Pods you just created. You list from the cache, and the new Pods aren't there yet. Your code decides it still needs to create them, and you create duplicates. This is the classic stale-cache double-create, and it's nasty because it only shows up under timing you can't reproduce on your laptop.
There are two ways out. The correct one is the expectations pattern, the same trick the built-in ReplicaSet controller uses: you record that you expect to see N creations in memory, and you don't act again until the cache has caught up to your own writes. It works, but it's not easy to implement and it's a fair amount of machinery. Read more on Ahmet's blog.
The pragmatic one, which a lot of people use, is to bypass the cache for the reads where a stale view would cause a double-create or double-delete, and go straight to the API server:
// The cached client can be stale right after our own writes, which
// would make us miscount and create duplicates. For this one read,
// go direct to the API server instead of the cache. Slower,
// but consistent for this decision.
err := r.apiReader.List(ctx, &instances, client.InNamespace(ns), labelSelector)
This is not only a Kubernetes issue. In any system with a read cache and a write-through path, read-after-write is not consistent unless you make it so. Most of the time the cache is exactly what you want: cheap, local, and eventually consistent. Eventual consistency is fine because the loop runs again. But the moment a decision would be destructive or non-idempotent if you acted on a stale read, you need to know which path you're on. Kubernetes solves many hard problems, but it also gives you a few new ones.
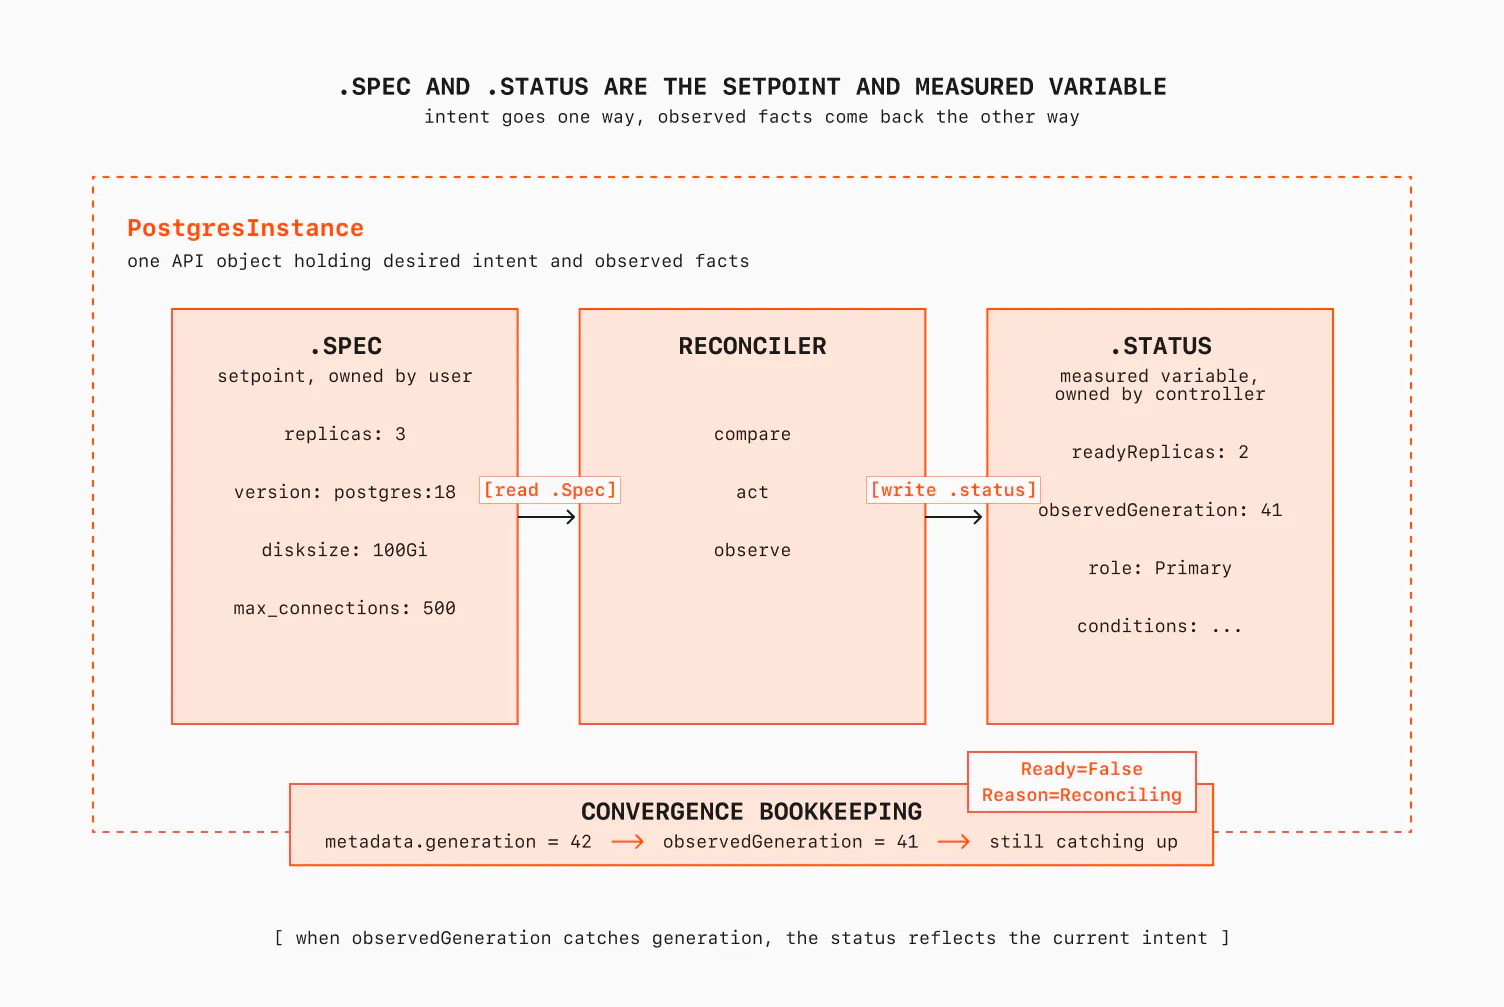
Setpoint and measured variable: spec and status
Back to the control diagram. My script kept its setpoint in shell variables and its measured state in the output of df and psql. Kubernetes gives both a permanent home, on the object itself.
.spec is the setpoint, the desired state. It's owned by whoever created the object (a human, or another controller), and the reconciler treats it as read-only intent. It's an anti-pattern to write to the .spec from inside the controller. If you do it, stop reading, go and fix your codebase. There are only a handful of exceptions, but a controller should generally never set its own setpoint.
.status is the measured variable, the observed state. It's owned by the controller, written through a separate status subresource, and it's where you record what's actually true. The better the status, the better the controller can decide. A good .status field is what makes a controller pleasant to operate. The word observability comes from control theory; Kalman coined it around 1960 to ask whether you can infer a system's internal state from its outputs. .status is also your response to any third-party system. If someone wants to learn the outcome of your actions, .status is the place to look at.
That split is the whole declarative model in two fields. It comes with a piece of bookkeeping that's pure control theory: .metadata.generation increments when desired state changes, and by convention the controller writes back .status.observedGeneration to say "the state I'm reporting reflects this version of your intent."
When observedGeneration < generation, the status you're looking at does not reflect the latest setpoint yet. That one comparison is how you tell "converged" from "still working on it."
This is why the reconcile is stateless, and why that matters. Our shell script kept "am I mid-failover?" in a variable that died with the process. A Kubernetes controller keeps nothing important in memory. Every fact it needs is on an API object: the spec it's driving toward, the status it last observed, the conditions describing where things stand. Kill the controller, restart it on another node, and it picks up exactly where it left off, not because it saved its progress, but because there was never any in-memory progress to lose. The state lives in the cluster (API server, etcd is what holds the state). The controller is just the loop that reads it.
Self-healing by design
This is the part I like most.
When a controller creates a child object (a Pod, a PVC), it stamps an ownerReference on the child pointing back at the parent. That reference does two things. It sets up garbage collection: delete the parent, and Kubernetes can cascade the delete to its children. And it gives the controller a way to map child changes back to the parent: "when any object I own changes, enqueue my parent for a reconcile." ownerReference allows you to link controllers to each other and create chains. If done right, all your controllers and systems fit together.
Here is an example. Follow the loop:
- A node dies and takes a Pod with it.
- The Pod's deletion is a watch event, an edge.
- Through the ownership link, that edge becomes a reconcile request for the parent.
- The parent reconciles, observes its children (level-triggered), sees one is missing and the count is below the setpoint, and creates a replacement.
- The replacement is an unscheduled Pod, an edge for the scheduler.
- The scheduler detects the unscheduled Pod, assigns a node.
- The kubelet gets triggered because that's an edge for that node's kubelet and it starts the container.
That's multiple feedback loops, each watching the layer below, each reacting to an edge and converging to its own level, chained together through the API server with nobody orchestrating the whole thing.
Control theory has a name for loops stacked like this: cascade control. The output of an outer loop becomes the setpoint of an inner loop. A controller never writes its own .spec, but it writes other objects' .spec all the time. My operator writes the PVC's spec, and that spec is the setpoint the CSI controllers converge to. Each loop worries only about its own layer and trusts the loop below.
So we wrote if ! pg_isready; then docker start; fi and maybe thought we're good. Kubernetes turns that one line into several independent controllers that have never heard of each other, but still cooperate because they share the API server and watch each other's objects. I like this part a lot. Nobody calls a central orchestrator. Nobody passes a private message. The system heals itself.
What "observe" actually means in a real operator
Up to here I've been a little vague about the "measure" step, because in the examples the measured state is just "list the child Pods." But in a real database operator it's a lot more than that.
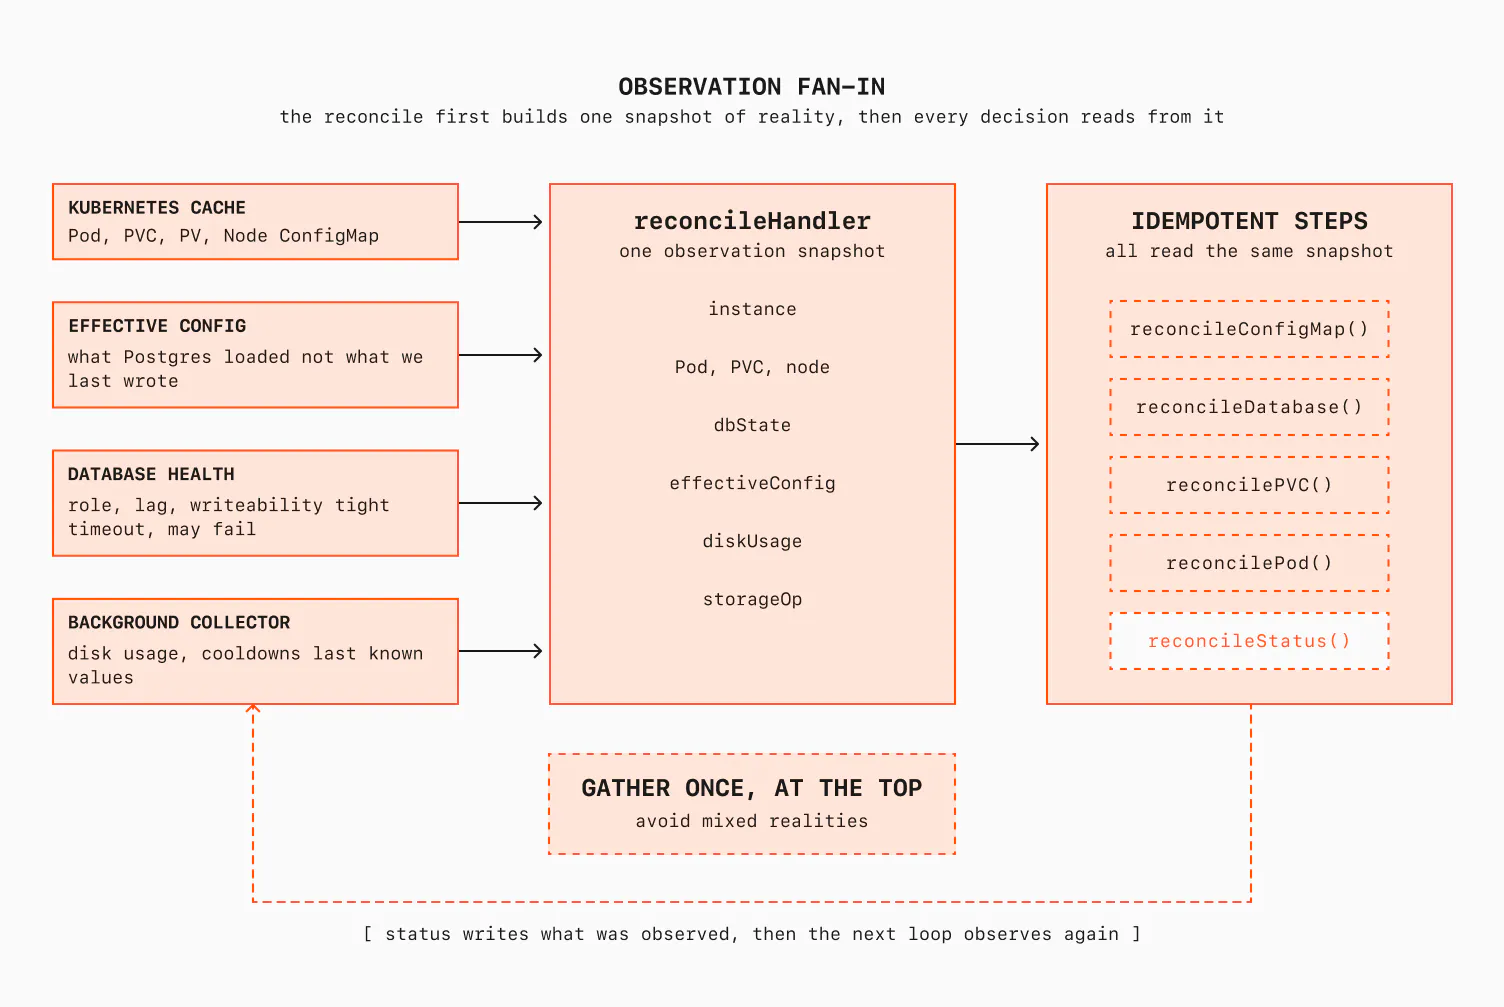
When an operator I work on reconciles a single Postgres instance, the first thing it does, before it decides anything, is build a snapshot of reality from every source that knows something true about that instance. Not just Kubernetes. Kubernetes barely knows anything about whether Postgres is actually healthy.
The sources gathered at the top of every reconcile:
- The Kubernetes cache: the Pod, its PVC, the PV behind it, the Node it's on, the ConfigMap holding its config. These are the cheap local reads, the stuff we already talked about.
- The database's effective configuration. Not what we last wrote down, but what the server has actually loaded, so we can compare the two and detect drift. Other entities can rewrite or reload the config on disk without us knowing, so the only honest source of truth is the running server itself, never our last write.
- The database's own view of its health. Its role, whether it's healthy, how far behind its followers are, whether it's currently accepting writes. Some of this comes from the agents that sit next to the database and manage it; some we get by opening a connection and asking the database directly. These calls carry a tight timeout and are allowed to fail, more on that below.
- A background collector. Some signals are too expensive or too rate-limited to fetch on every reconcile: disk usage, or whether a volume operation we kicked off earlier is still in flight and where it sits in its cooldown window. A separate collector, often a background goroutine, gathers these on a slow cadence and keeps the last value per volume in memory. The reconcile reads that value instantly, without blocking on anything. Think of these as custom workqueues you implement.
In code, the snapshot is just a struct, and the reconcile's first move is to populate it. This is simplified, but faithful to the real shape:
// The observation snapshot: everything we know about this instance, right now.
type reconcileHandler struct {
    // The object (.spec = setpoint, .status = measured).
    instance *v1.PostgresInstance

    // Kubernetes objects.
    pod  *corev1.Pod
    pvc  *corev1.PersistentVolumeClaim
    node *corev1.Node

    // Database state.
    dbState DatabaseState

    // What Postgres actually loaded, not what we last wrote.
    effectiveConfig map[string]string

    // Collected out-of-band.
    diskUsage *resource.Quantity

    // The volume operation already in flight, if any.
    storageOp *StorageOperation
}

func (r *Reconciler) newReconcileHandler(
  ctx context.Context,
  inst *v1.PostgresInstance,
) (*reconcileHandler, error) {
    h := &reconcileHandler{instance: inst}

    // Cheap local reads.
    h.pod, h.pvc, h.node = r.fetchKubeObjects(ctx, inst)

    // Active database calls.
    h.dbState         = r.queryDatabase(ctx, h.pod)
    h.effectiveConfig = r.readEffectiveConfig(ctx, h.pod)

    // Values from the collector/metric.
    h.diskUsage = r.collector.Usage(h.pvc)
    h.storageOp = r.collector.InFlightOp(h.pvc)

    return h, nil
}
A few things about this are deliberate, and only look obvious after you've been burned once or twice.
Gather once, at the top. Every sub-decision in the reconcile reads from this one snapshot. We don't re-query the database in the middle of the loop, or read the disk usage again three functions deep. If we did, different parts of the same reconcile could see different versions of reality. This sounds like a small detail, but it changes the whole design.
For example, the database might be the leader when we check at the top and a replica by the time another helper checks again. Then you get decisions that are individually reasonable, but wrong together. We have a rule in the codebase against stashing state back onto this handler mid-reconcile to pass between steps, because it reintroduces exactly the inconsistency we gathered the snapshot to avoid. Making the reconcileHandler immutable is one way to enforce that rule in the type system instead of relying on code review.
Partial failures are tolerated. Reaching the database can fail while the Kubernetes reads succeed. That's not always an error that aborts the reconcile. It's a measured fact: "Postgres is currently unreachable." That itself is something to record in status. A control loop that gives up entirely whenever one sensor is unavailable is a control loop that's down a lot. We degrade instead. Think of a car. If the rain sensor for the wipers is broken, the whole car doesn't stop. You can still drive, but you need to turn on a few things yourself.
Once the data snapshot exists, the reconcile is a sequence of small, idempotent steps, each comparing one slice of desired against observed and acting to close the gap:
func (r *reconcileHandler) reconcile(ctx context.Context) (reconcile.Result, error) {
    var rb results.Builder
    rb.Merge(r.reconcileConfigMap(ctx))   // push desired config
    rb.Merge(r.reconcileDatabase(ctx))    // reload/restart if params drifted
    rb.Merge(r.reconcilePVC(ctx))         // grow the disk if needed
    rb.Merge(r.reconcilePod(ctx))         // create/replace the Pod
    rb.Merge(r.reconcileStatus(ctx))      // always last: write what we observed
    return rb.Result()
}
Status is written last on purpose, because it's the measured variable: you record what's true after you've taken your actions and observed the result. Again, in our operators, it's not possible to write the status mid-reconcile.
Each step is independently idempotent. Each returns a result, either "I'm done" or "requeue me in 30 seconds, I'm waiting on something," and the results merge. It reads almost exactly like the body of my shell loop. The difference is that "observe the state" grew from df and pg_isready into a fan-in across multiple systems, and "take an action" grew from ssh into typed, conflict-aware API writes.
This is the operator. The kubelet, the scheduler, CSI, and CNI are infrastructure we get by using Kubernetes. This loop, with its messy real-world observe step, is the part we actually write and deal with. Because we know how the underlying system works, we can design it without treating Kubernetes like a black box.
Not every edge comes from the API server
There's one more piece, and it lets me close a loop from Part 1 that I left deliberately: the disk-usage check.
My shell script polled df on every node every five seconds. For three nodes, fine. For thousands of databases, you can't reconcile every one of them every few seconds just to check a number that rarely changes; you'd spend all your CPU re-deriving "still at 40%, still at 40%, still at 40%." This is the level-triggered model's one real cost: re-checking everything is correct, but it isn't free.
The fix is to add a sensor that emits its own edges. A background collector polls our metrics pipeline for disk usage on a slow cadence, keeps the last value per volume in memory, and only emits an event when usage crosses a threshold, not while it sits above or below one:
// Edge detection. We fire only on the transition across the threshold,
// not every cycle we happen to be above it. Hovering at 81% is silent;
// crossing 80% upward is an event.
crossedUp := previousUsage < pvc.GrowThreshold && usage >= pvc.GrowThreshold
if crossedUp {
    // -> generic event -> work queue -> reconcile
    relay.Send(Event{Key: pvc.Key})
}
That event goes into the same work queue as the API watch events and triggers a normal reconcile of the affected instance. Same rule as before: the event wakes us up, the reconcile decides from the current state.
For example, say we have a 10GiB disk and it's using 8GiB. The collector saw it cross the threshold, so it wakes the reconciler. The reconciler reads the current usage, sees that it crossed the 80% threshold, and sets a new size on the PVC. After that, CSI handles the rest.
And because edges can be missed (the collector could be down, an event could be dropped from a full channel), there's a resyncer: a periodic timer that enqueues every object for reconcile every minute or so, regardless of events. It's the safety net. It's our sleep 5 loop. There's also RequeueAfter, which a reconcile returns to say "wake me again in 30 seconds," the controller's way of polling a slow external operation without holding a worker.
There are two more questions: how often should the loop run, and who is allowed to run it? Control theory calls the first one the sampling interval. The rule of thumb: act faster than the thing you're tracking changes, but not faster than it can respond. Reconciling a disk that fills over hours every few milliseconds just burns CPU to learn the same thing again.
So the operator puts boundaries around it.
- A coalescing delay handles noisy edge events: a burst of events for one object becomes one reconcile (think of it like a fan-in), not a thousand.
- The resyncer is the safety net: every object gets looked at once in a while, even when nothing fires.
- And leader election answers the who: only one copy of the operator runs the loop at a time. Two controllers writing to the same database object is not "more reliable." Even with idempotent controllers, they'll be requeueing due to conflicts and consuming unnecessary compute. In theory, a perfectly written controller should tolerate this. In practice, software is rarely perfect, and the safer boundary is worth it.
To close out Part 2, let me redraw the control loop again. The diagram in Part 1 had a few basic boxes. Now, the same loop represents a closed feedback loop more realistically:
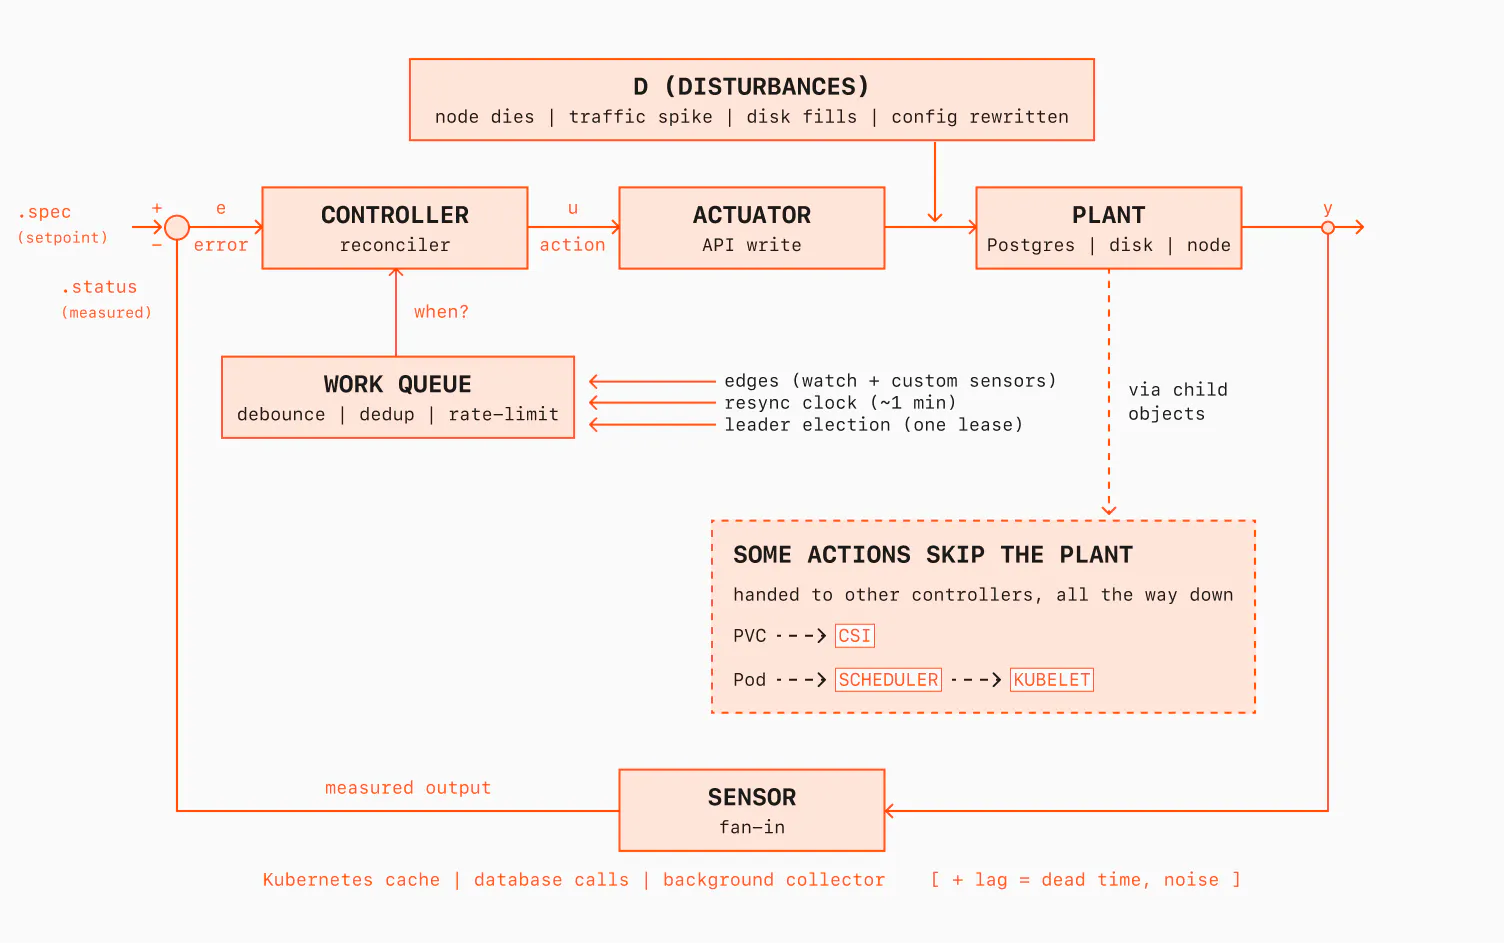
There is one new arrow in this diagram: disturbances. A controller has two jobs. The first is setpoint tracking: someone edits the .spec, and the loop chases the new intent. The second is disturbance rejection: the world changes on its own. A node dies, a customer starts a bulk import, someone deletes a Pod by hand. The level-triggered reconcile treats both the same way: it only sees the gap.
Our controller doesn't always touch Postgres directly. Sometimes it writes a PVC and lets CSI do the storage work. Sometimes it creates a Pod and lets the scheduler and kubelet do their part. This is what a production operator looks like: one loop we write, surrounded by other loops we don't write.
Notice that every decision in this loop has been binary: start the Pod or don't, grow the disk or don't, rewrite the config or don't. That's an on/off controller, and it covers most of what an operator does. But not every question is yes/no; once the answer becomes how much rather than whether, you need a controller with memory and a sense of trend: how long you've been off, and how fast it's changing. That's a separate post.
Conclusion
All of this works, and most of the time it runs without anyone watching it. But the abstractions still leak, and they usually leak at a bad time.
Eventual consistency and the split between cache reads and API writes mean that a freshly-created object might not be visible to the thing that just created it. When something goes wrong, we're debugging Kubernetes objects, database state, metrics, volume operations, and sometimes the cloud provider at the same time. The bug is usually not in one clean place.
The declarative model is wonderful until it meets an operation that's inherently imperative and stateful, like a failover, a major-version upgrade, or a data migration. Then you have to turn a blocking, non-idempotent action into an idempotent one. That's a whole other blog post.
That complexity is easy to underestimate. If you're not dealing with sophisticated systems, if you can sacrifice availability, or if you don't care about scalability, maybe all this machinery isn't needed at all. Operators do not remove complexity. They move it into code someone has to understand.
I still think it's worth it. For running thousands of databases that have to heal themselves without anyone watching, I don't know a better alternative. The hard parts are hard because the problem is hard, not because Kubernetes made it hard.
Kubernetes is not only a container runtime. It's not only a YAML processor, or an orchestrator, or whatever word we use that year. For me, the useful way to read Kubernetes is this: Kubernetes is a framework for feedback controllers, plus a consistent store to hold their setpoints and a shared event bus to wake them up.
Once you see that, the rest fits together. The kubelet, the scheduler, CSI, and your operator all read and write facts onto shared objects, and each one tries to move its own small part of the system toward the desired state. The core idea is still the same one we started with: write down what you want, look at what exists, make the next change, and repeat. Events wake the loop up, but the current state decides what happens.
Kubernetes didn't invent these ideas; a thermostat had them long before us. The mapping to control theory is not perfect, and some boundaries are fuzzy. But the core idea holds. We are writing feedback loops in Go and applying them to databases. Mechanical and electrical engineers figured out how to build stable, long-running systems before us. Software engineering is still catching up, and Kubernetes gives us a practical way to use those ideas in production.