Optimizing queries in arewefastyet
Florent Poinsard, Harshit Gangal |
Arewefastyet is an automatic benchmarking tool for Vitess. It runs automated micro and macro benchmarks daily to monitor the performance of Vitess.
Arewefastyet uses PlanetScale for its database, which comes with an in-dashboard query monitoring tool: Insights. This tool provides a complete overview of your database's performance, including details all the way down to the individual query level.
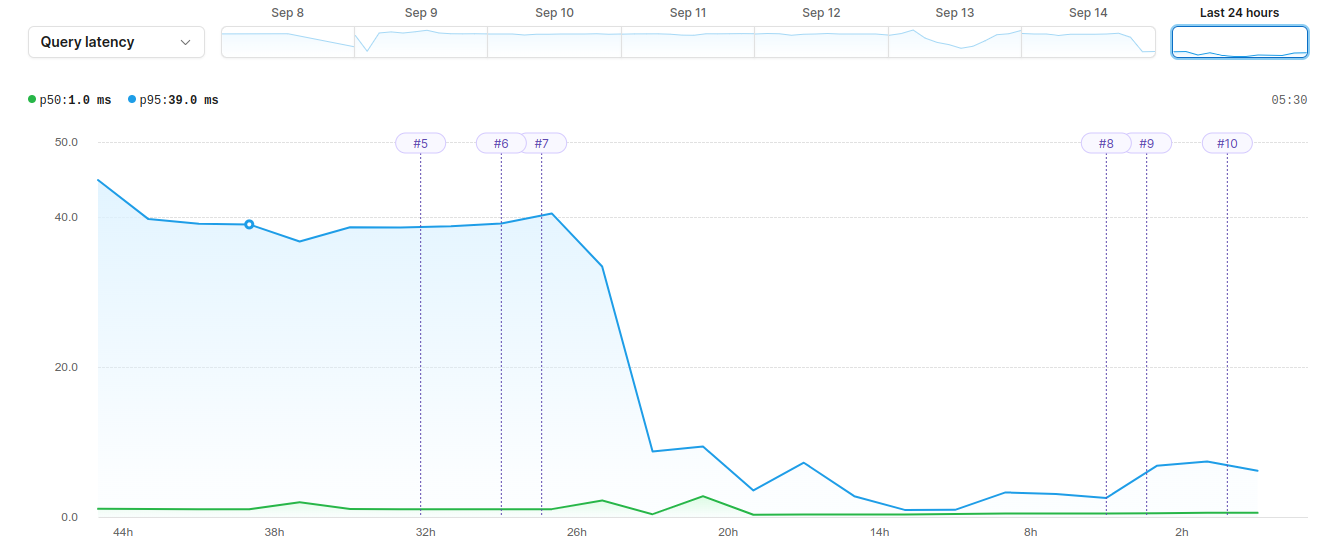
Using Insights, we were able to detect and improve the performance of two slow queries, which resulted in an 85% decrease in query latency.

Detecting the slow queries
Insights includes an overview graph that lets you see several important metrics, such as query latency and number of rows read, at a glance. As you can see in the graph above, our p95 query latency was hovering around 40 ms. We wanted to see if we could improve this, so the first step was to narrow down the latency to the most problematic queries.
With Insights, this is simple. You can view a list of all queries that ran over a selected time period and sort them based on time per query.
This table immediately surfaced two queries that were running slowly. Let's examine them now.

The benchmark comparison query
The first query that showed up is used to return the previous successful run of the micro-benchmarks to compare against the latest run. This comparison is visible on the Microbenchmarks page.
select
    e.uuid,
    e.git_ref
  from
    execution as e
  where
    e.source = :source
    and e.`status` = :status
    and e.type = :type
    and e.git_ref != :git_ref
  order by
    e.started_at desc
  limit
    :row_count
The OLTP and TPCC benchmark query
This next query is used to return the last runs of OLTP and TPCC benchmarks for X days. The result we get from this query allows us to display the result (qps, tps, latency, etc.) for each benchmark. We then display this information on the CRON analytics page.
SELECT info.macrobenchmark_id, e.git_ref, e.source, e.finished_at, IFNULL(e.uuid, ''), " +
		"results.tps, results.latency, results.errors, results.reconnects, results.time, results.threads, " +
		"results.total_qps, results.reads_qps, results.writes_qps, results.other_qps " +
		"FROM execution AS e, macrobenchmark AS info, macrobenchmark_results AS results " +
		"WHERE e.uuid = info.exec_uuid AND e.status = \"finished\" AND e.finished_at BETWEEN DATE(NOW()) - INTERVAL ? DAY AND DATE(NOW() + INTERVAL 1 DAY) " +
		"AND e.source = ? AND info.vtgate_planner_version = ? AND info.macrobenchmark_id = results.macrobenchmark_id AND info.type = ?
Improving the slow queries
Now that we had identified our two problematic queries, it was time to improve them. This step was straightforward. We noticed in both cases that these queries were missing an index.
We started with the OLTP and TPCC benchmark query. We opened a new PlanetScale deploy request to add an index to finished_at and status. Once merged, the deploy request is reflected in the graph below by the purple line with the number 6, meaning deploy request 6.
To address the benchmark comparison query, we added an index on started_at. This update is reflected in deploy request number 7 on the graph.

As you can see, these two small additions resulted in an 85% decrease in query latency. With Insights, we were able to detect, debug, and massively improve our queries in just minutes.