Insights: max query latency graphs
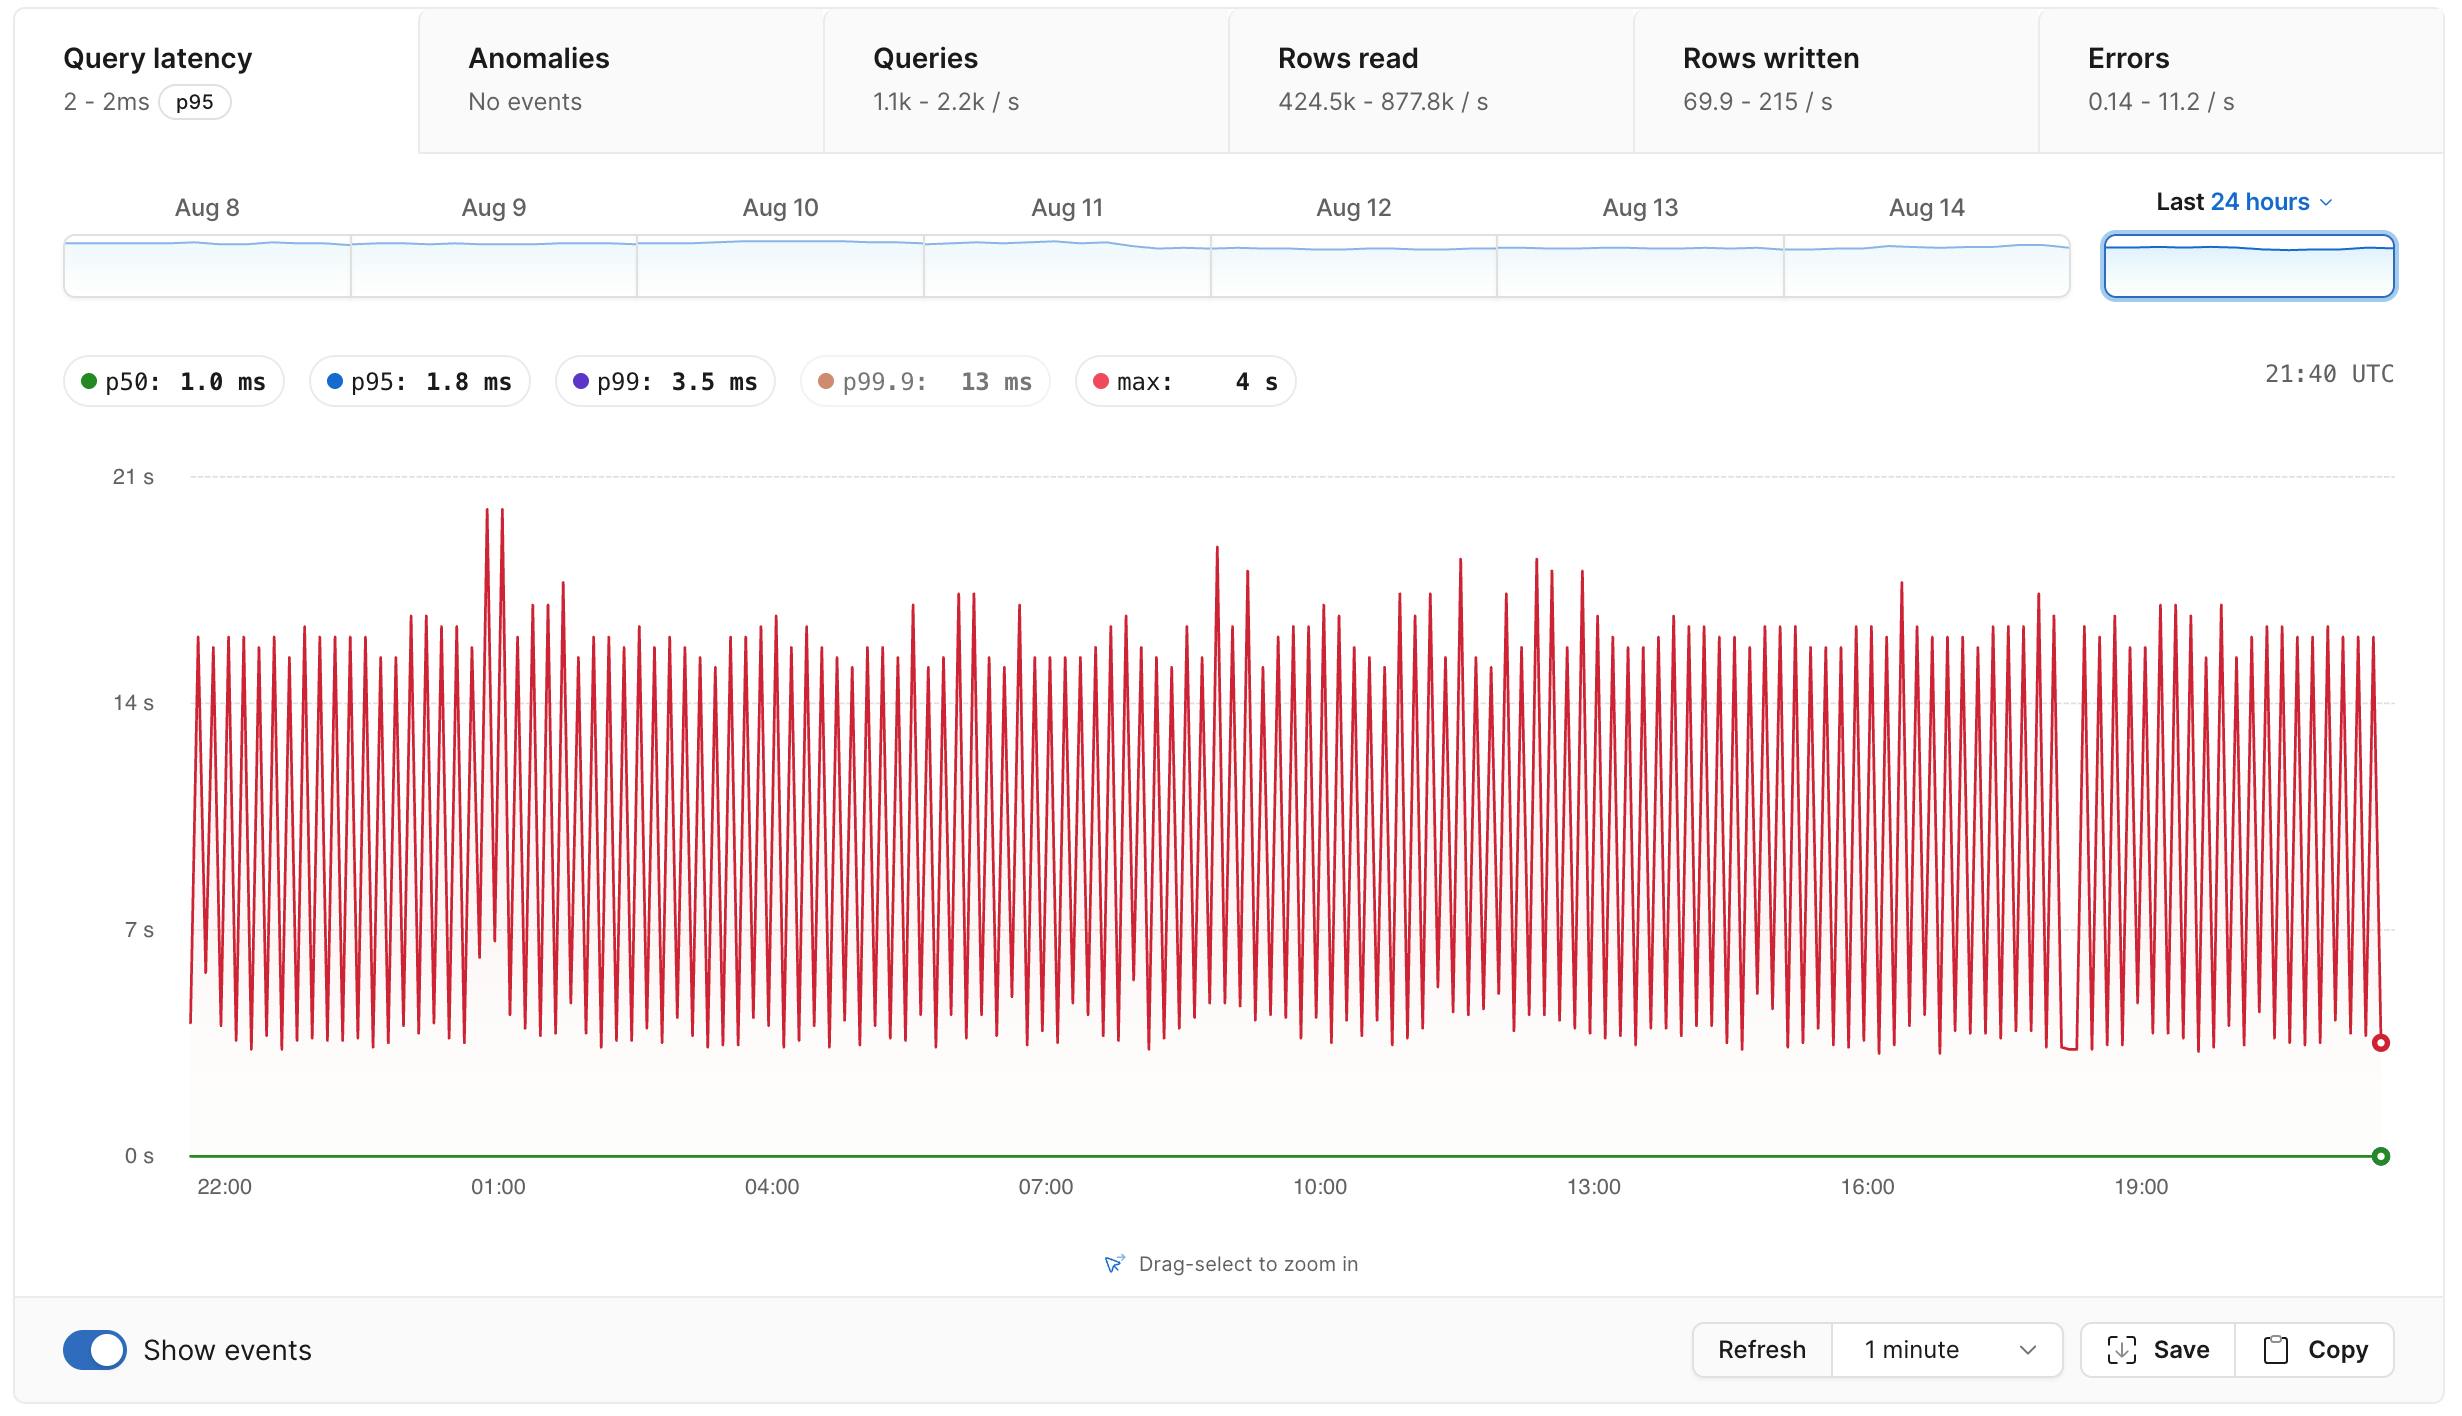
We now show a time-series graph of your maximum query response time in Insights, at both the database and query pattern level. Seeing maximum response time over time can help identify extreme performance outliers and unexpected queries. To view this data, visit your database's Insights dashboard and click on the "max" button at the top of the Query Latency graph.