

Open a Neki database to see the selected branch: its cluster topology, summary statistics, and recent query performance. Each branch in Neki is a distinct instance. Switch branches from the dropdown at the top right. From the dashboard you can review:
  • The routers and the Postgres instances in each shard
  • Live CPU and memory usage on the routers, primary, and replicas
  • Database summary statistics
  • Query performance for the branch
  • Connection details and a new-branch action

Cluster topology

The diagram in the center of the dashboard shows the infrastructure that serves the selected branch.
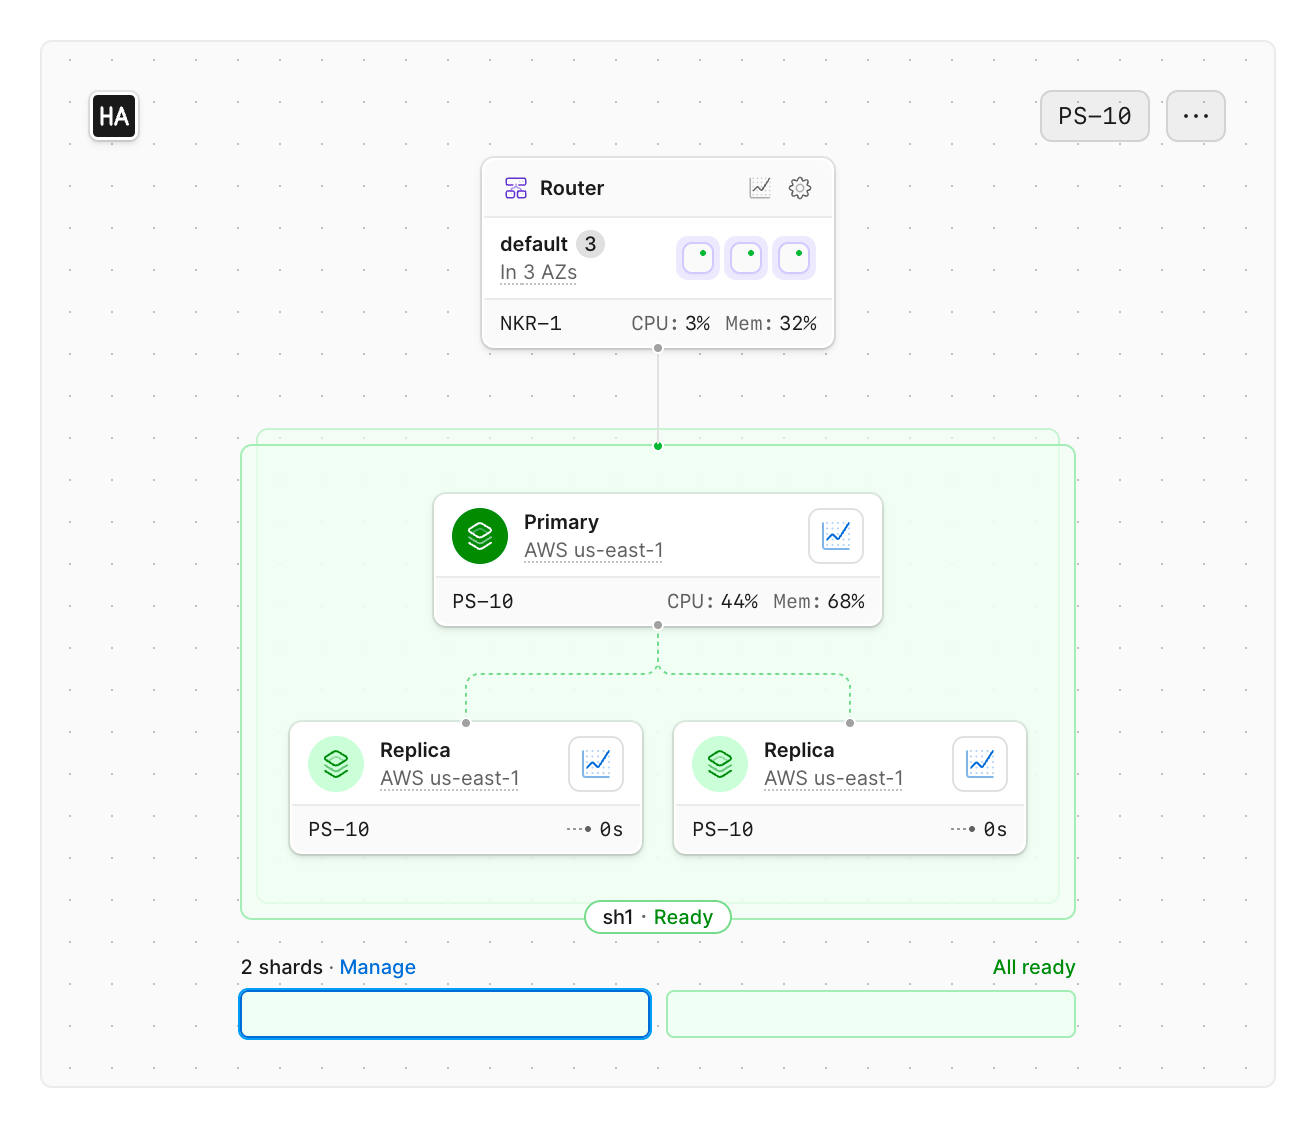
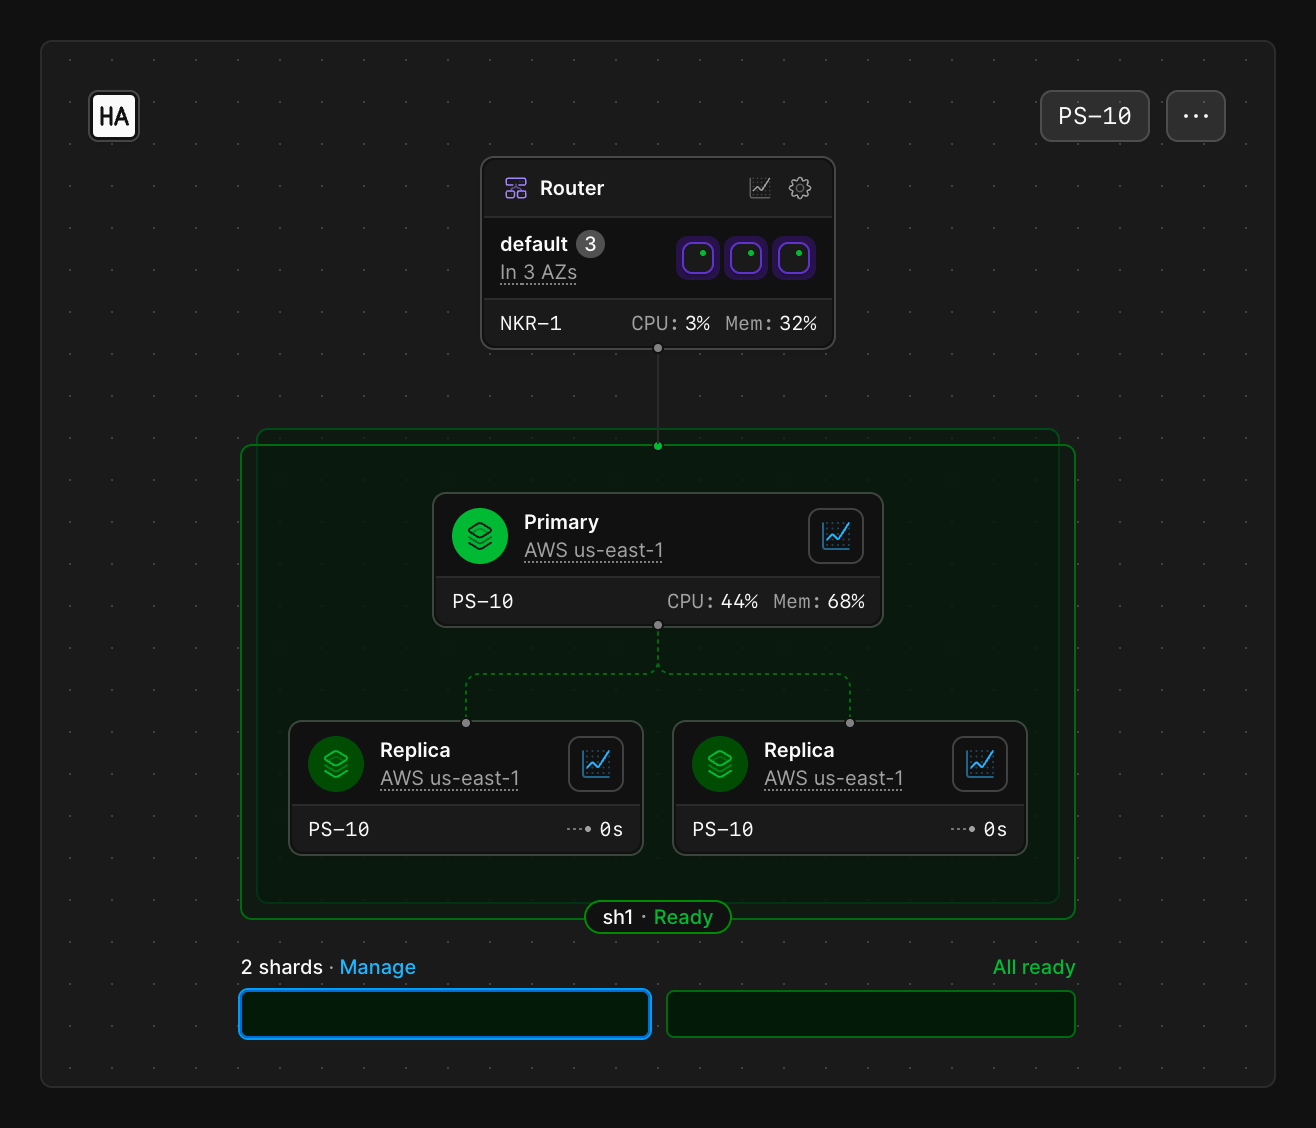
Dashboard infrastructure diagram for a Neki production branch: a router in three availability zones above shard sh1, which has one primary and two replicas in AWS us-east-1Dashboard infrastructure diagram for a Neki production branch: a router in three availability zones above shard sh1, which has one primary and two replicas in AWS us-east-1
Routers sit above the Postgres instances. A branch can have more than one router. Each router card in the diagram shows how many instances run across availability zones, its size, live CPU, and memory. Below the routers, the diagram shows each shard:
  • Primary: the writable Postgres instance for that shard, with region, cluster size, and live CPU and memory
  • Replicas: read-only Postgres instances that copy from the primary. Each replica shows region, cluster size, and replication lag
A production branch is marked HA. Development branches contain a primary database with no replicas. If the branch has more than one shard, the control under the diagram lists them and their readiness. Select a shard to show its primary and replicas. Manage opens cluster configuration to add, assign, or resize shards. How data arrives into shards is configured by the database’s data topology.

Database summary

The panel on the right shows:
  • Postgres version and CPU architecture
  • Tables, Branches, Region, and Next backup
  • Egress bandwidth, Provisioned IOPS, and Total storage for the selected branch
  • The current billing cycle
  • The next maintenance window, with a Manage link

Performance metrics

Below the diagram, a dropdown selects a time-series graph for the branch. Available metrics include:
  • Query latency (p50, p95, p99, p99.9, and max)
  • Queries per second
  • Rows read
  • Rows written
  • Query errors
View all query insights opens Query Insights for query-pattern detail. Historical router, shard, and storage graphs live on the Metrics page.

Connecting to your database

Connect generates credentials for a router on the selected branch. See Connect to Neki.

Need help?

Get help from the PlanetScale Support team, or join our Discord community to see how others are using PlanetScale.