> ## Documentation Index
> Fetch the complete documentation index at: https://planetscale.com/docs/llms.txt
> Use this file to discover all available pages before exploring further.
# Datadog integration
> PlanetScale can push metrics to Datadog to assist your team with understanding your database usage and performance.
This Datadog integration is no longer receiving updates or new metric additions. You should instead use our [Datadog Agent Integration](/vitess/tutorials/prometheus-metrics-datadog), which provides more metrics than this native integration.
If you have any questions about migrating to the Datadog Agent Integration, [reach out to support](https://planetscale.com/contact?initial=support).
## Prerequisites
* A [Datadog](https://www.datadoghq.com/) account
## Configuring the Datadog integration
In Datadog, install the [PlanetScale integration](https://app.datadoghq.com/integrations/planetscale).
Create a Datadog API key in your [Datadog Organization Settings](https://app.datadoghq.com/organization-settings/api-keys) and copy the key.
In PlanetScale, go to your organization's [Integrations settings](https://app.planetscale.com/settings/integrations), and select **Configure** for the Datadog integration. Paste your Datadog API key into the field.
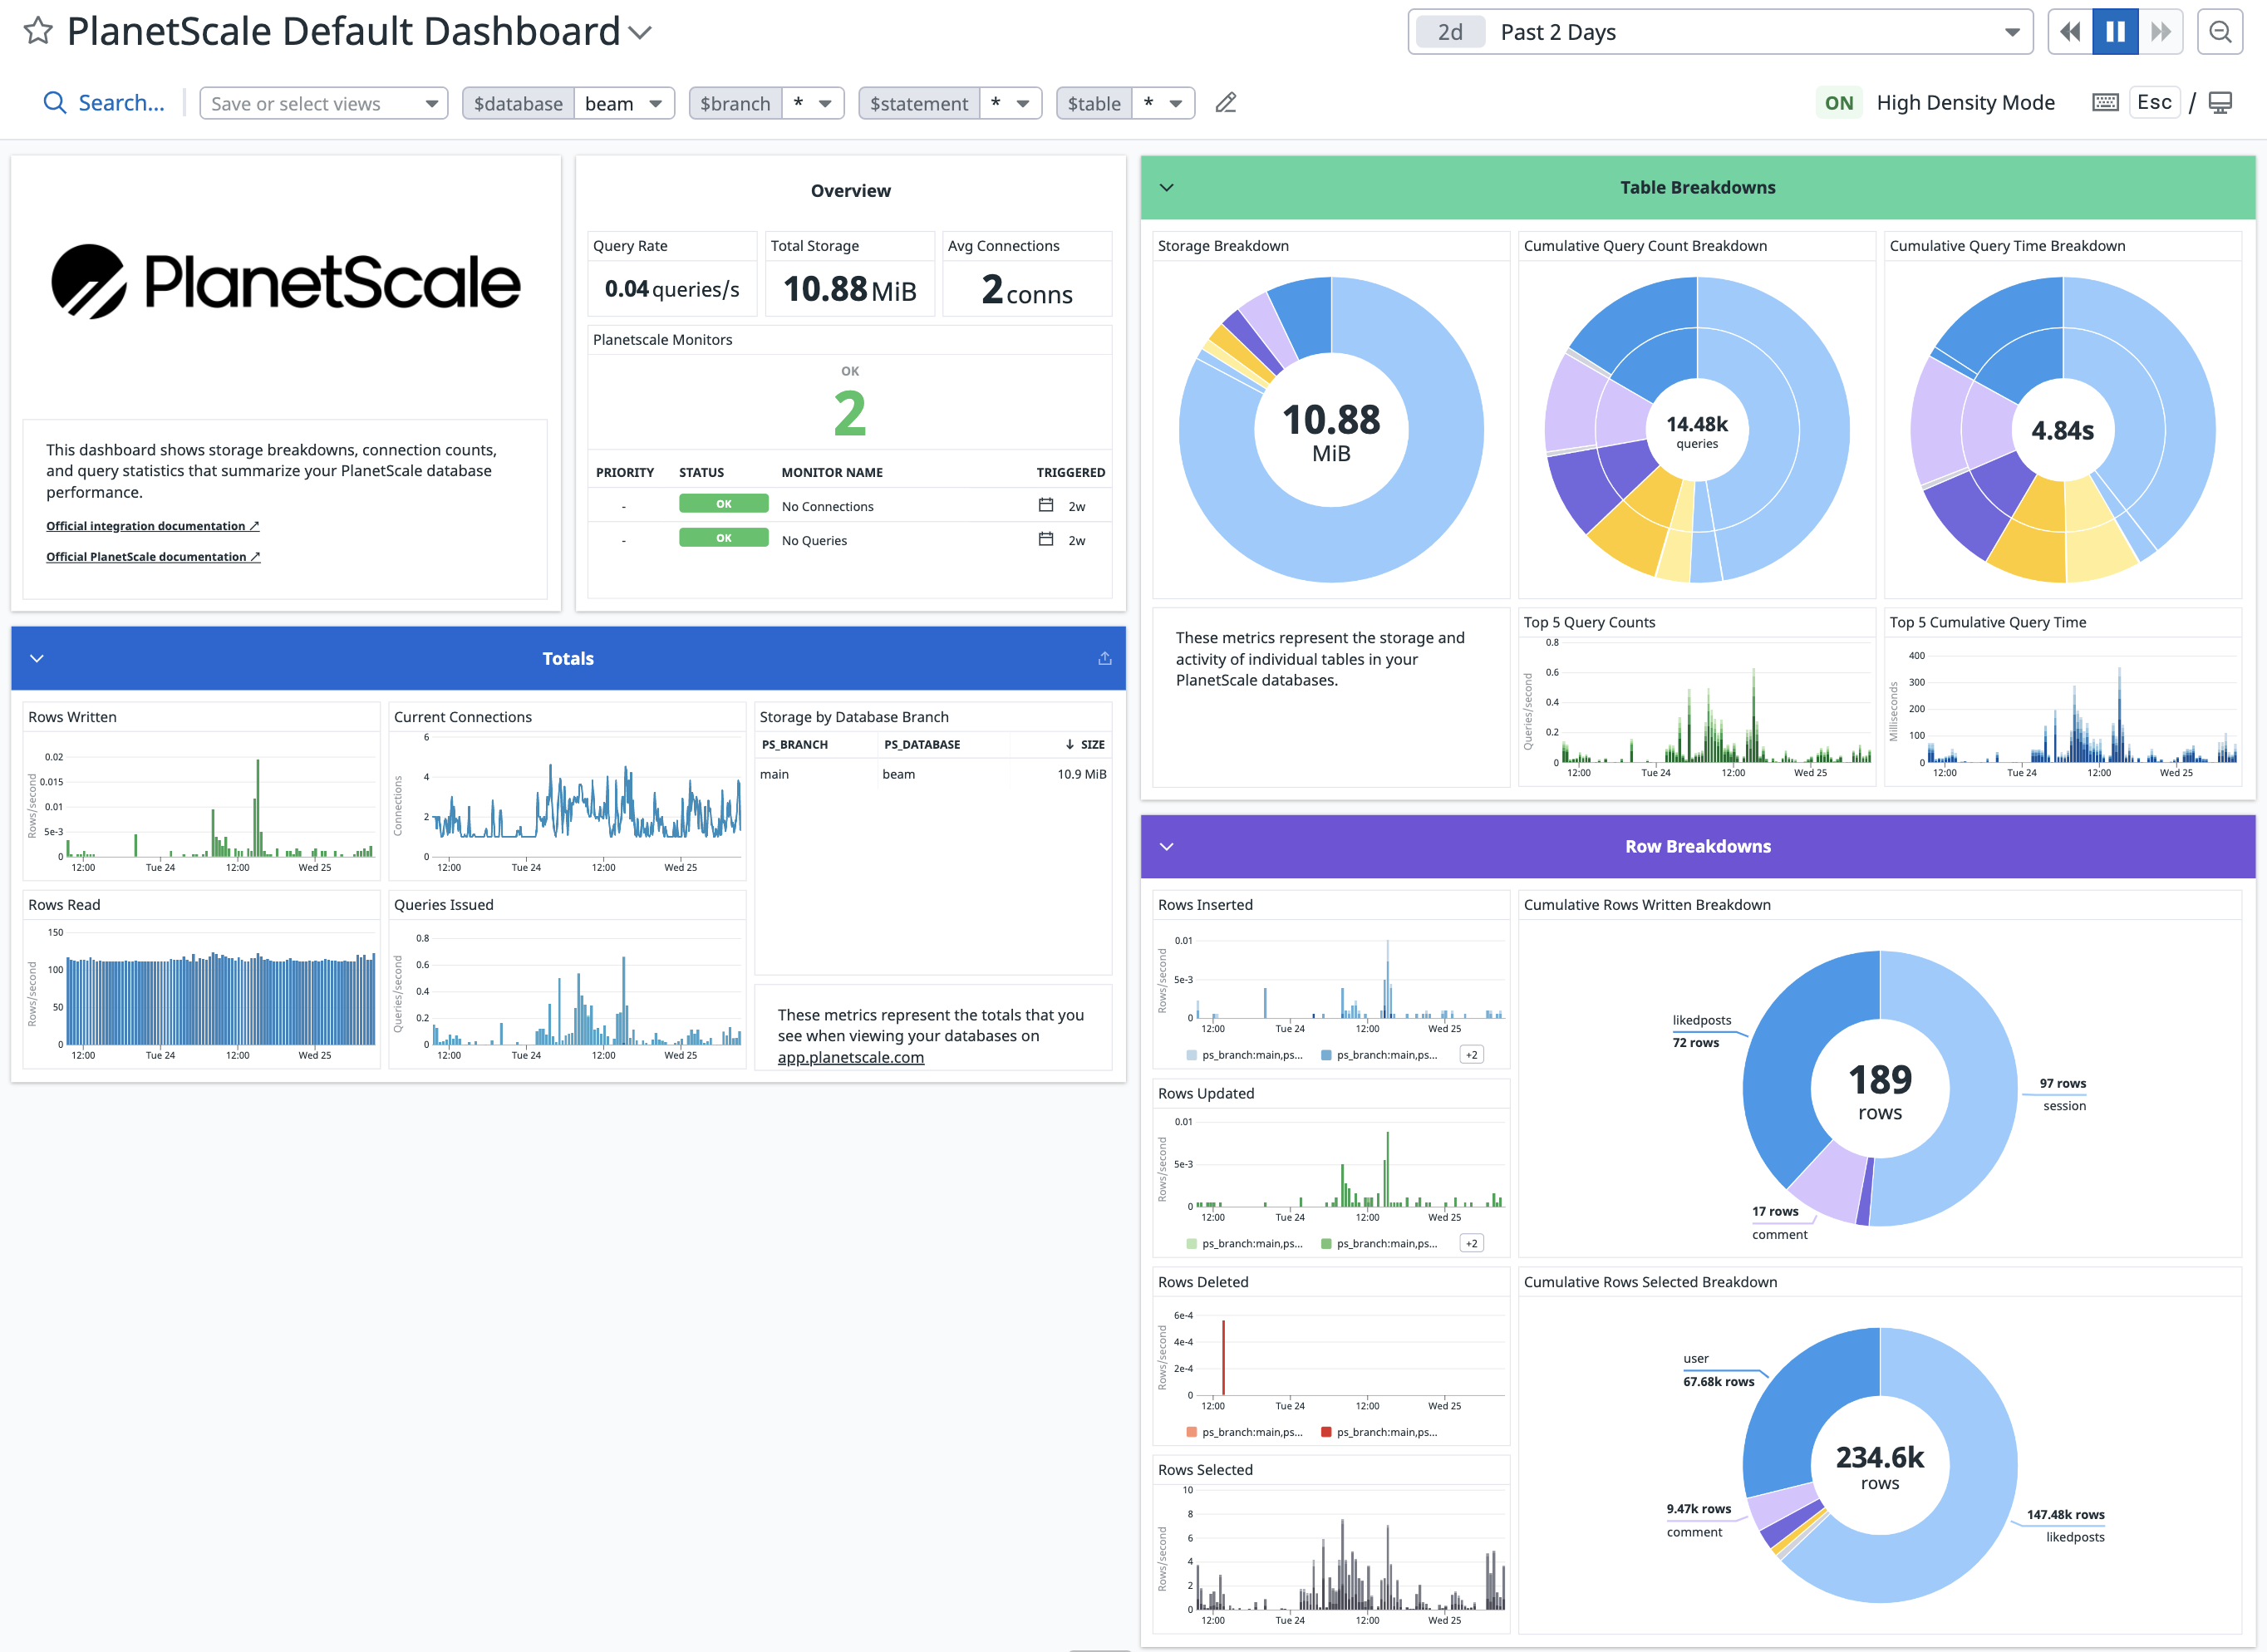
Once complete, a "PlanetScale" dashboard will be available with incoming metrics from PlanetScale.
 ## Metrics We Collect
Once configured, PlanetScale collects the following metrics from every branch in your organization.
| **Metric name** | **Metric type** | **Description** |
| :----------------------------------------- | :-------------- | :-------------------------------------------------------------------------------------------------- |
| planetscale.connections | gauge | Number of active connections to a database branch. *Shown as connection.* |
| planetscale.primary.cpu\_usage | gauge | Percentage of CPU utilized on a database branch's primary. *Shown as percent.* |
| planetscale.primary.memory\_usage | gauge | Percentage of memory utilized on a database branch's primary. *Shown as percent.* |
| planetscale.queries.latency | gauge | Query times in the p50, p95, p99 and p999 percentiles. *Shown as millisecond.* |
| planetscale.replication\_lag | gauge | Replication lag in seconds between a database branch's primary and each replica. *Shown as second.* |
| planetscale.rows\_read | count | Number of rows read from a database branch. *Shown as row.* |
| planetscale.rows\_written | count | Number of rows written to a database branch. *Shown as row.* |
| planetscale.tables.cumulative\_query\_time | count | Cumulative active query time in a database branch, by table and statement. *Shown as nanosecond.* |
| planetscale.tables.queries | count | Number of queries issued to a database branch, by table and statement. *Shown as query.* |
| planetscale.tables.rows\_deleted | count | Number of rows deleted from a database branch, by table. *Shown as row.* |
| planetscale.tables.rows\_inserted | count | Number of rows inserted into a database branch, by table. *Shown as row.* |
| planetscale.tables.rows\_selected | count | Number of rows selected in a database branch, by table. *Shown as row.* |
| planetscale.tables.rows\_updated | count | Number of rows updated in a database branch, by table. *Shown as row.* |
| planetscale.tables.storage | gauge | Total bytes stored in a database branch, by table. *Shown as byte.* |
| planetscale.vtgate.errors | count | Number of errors encountered by a database branch's vtgate. *Shown as error.* |
| planetscale.vttablet.mem\_util.max | gauge | Maximum memory utilization of a database branch's vttablet. *Shown as percent.* |
| planetscale.vttablet.mem\_util.avg | gauge | Average memory utilization of a database branch's vttablet. *Shown as percent.* |
| planetscale.vttablet.iops | gauge | Number of IOPS performed by a database branch's vttablet. *Shown as operation.* |
## Billing
The Datadog integration is available on all of our [paid plans](https://planetscale.com/pricing).
## Frequently asked questions
### How do I track replication lag in Datadog?
You can use the following formula to set alerts for replication lag:
```bash theme={null}
(max:planetscale.replication_lag{ps_database: ps_tablet_type:replica, ps_branch:})
```
Make sure you replace `` with your PlanetScale database name and `` with the name of the branch for which you'd like to track replication lag.
## Need help?
Get help from [the PlanetScale Support team](https://planetscale.com/contact?initial=support), or join our [Discord community](https://pscale.link/community) to see how others are using PlanetScale.
## Metrics We Collect
Once configured, PlanetScale collects the following metrics from every branch in your organization.
| **Metric name** | **Metric type** | **Description** |
| :----------------------------------------- | :-------------- | :-------------------------------------------------------------------------------------------------- |
| planetscale.connections | gauge | Number of active connections to a database branch. *Shown as connection.* |
| planetscale.primary.cpu\_usage | gauge | Percentage of CPU utilized on a database branch's primary. *Shown as percent.* |
| planetscale.primary.memory\_usage | gauge | Percentage of memory utilized on a database branch's primary. *Shown as percent.* |
| planetscale.queries.latency | gauge | Query times in the p50, p95, p99 and p999 percentiles. *Shown as millisecond.* |
| planetscale.replication\_lag | gauge | Replication lag in seconds between a database branch's primary and each replica. *Shown as second.* |
| planetscale.rows\_read | count | Number of rows read from a database branch. *Shown as row.* |
| planetscale.rows\_written | count | Number of rows written to a database branch. *Shown as row.* |
| planetscale.tables.cumulative\_query\_time | count | Cumulative active query time in a database branch, by table and statement. *Shown as nanosecond.* |
| planetscale.tables.queries | count | Number of queries issued to a database branch, by table and statement. *Shown as query.* |
| planetscale.tables.rows\_deleted | count | Number of rows deleted from a database branch, by table. *Shown as row.* |
| planetscale.tables.rows\_inserted | count | Number of rows inserted into a database branch, by table. *Shown as row.* |
| planetscale.tables.rows\_selected | count | Number of rows selected in a database branch, by table. *Shown as row.* |
| planetscale.tables.rows\_updated | count | Number of rows updated in a database branch, by table. *Shown as row.* |
| planetscale.tables.storage | gauge | Total bytes stored in a database branch, by table. *Shown as byte.* |
| planetscale.vtgate.errors | count | Number of errors encountered by a database branch's vtgate. *Shown as error.* |
| planetscale.vttablet.mem\_util.max | gauge | Maximum memory utilization of a database branch's vttablet. *Shown as percent.* |
| planetscale.vttablet.mem\_util.avg | gauge | Average memory utilization of a database branch's vttablet. *Shown as percent.* |
| planetscale.vttablet.iops | gauge | Number of IOPS performed by a database branch's vttablet. *Shown as operation.* |
## Billing
The Datadog integration is available on all of our [paid plans](https://planetscale.com/pricing).
## Frequently asked questions
### How do I track replication lag in Datadog?
You can use the following formula to set alerts for replication lag:
```bash theme={null}
(max:planetscale.replication_lag{ps_database: ps_tablet_type:replica, ps_branch:})
```
Make sure you replace `` with your PlanetScale database name and `` with the name of the branch for which you'd like to track replication lag.
## Need help?
Get help from [the PlanetScale Support team](https://planetscale.com/contact?initial=support), or join our [Discord community](https://pscale.link/community) to see how others are using PlanetScale.