> ## Documentation Index
> Fetch the complete documentation index at: https://planetscale.com/docs/llms.txt
> Use this file to discover all available pages before exploring further.
# PlanetScale Vitess architecture
> PlanetScale's Vitess product is designed for reliability, scalability, and developer productivity.
## Overview
We achieve these goals through a combination of [MySQL](/vitess/terminology#mysql), [Vitess](/vitess/terminology#vitess), and our own application and ecosystem we have built atop these open-source technologies.
There is a great deal of infrastructure that enables our databases to be highly-available, secure, and resilient.
In this article, you'll learn about what powers PlanetScale databases and how you can view your database's configuration on our app.
## The infrastructure diagram
After creating a PlanetScale account and joining at least one organization, you can create a database.
Each new database has a single default [keyspace](/vitess/terminology#keyspace) — a logical database — with the same name as the database.
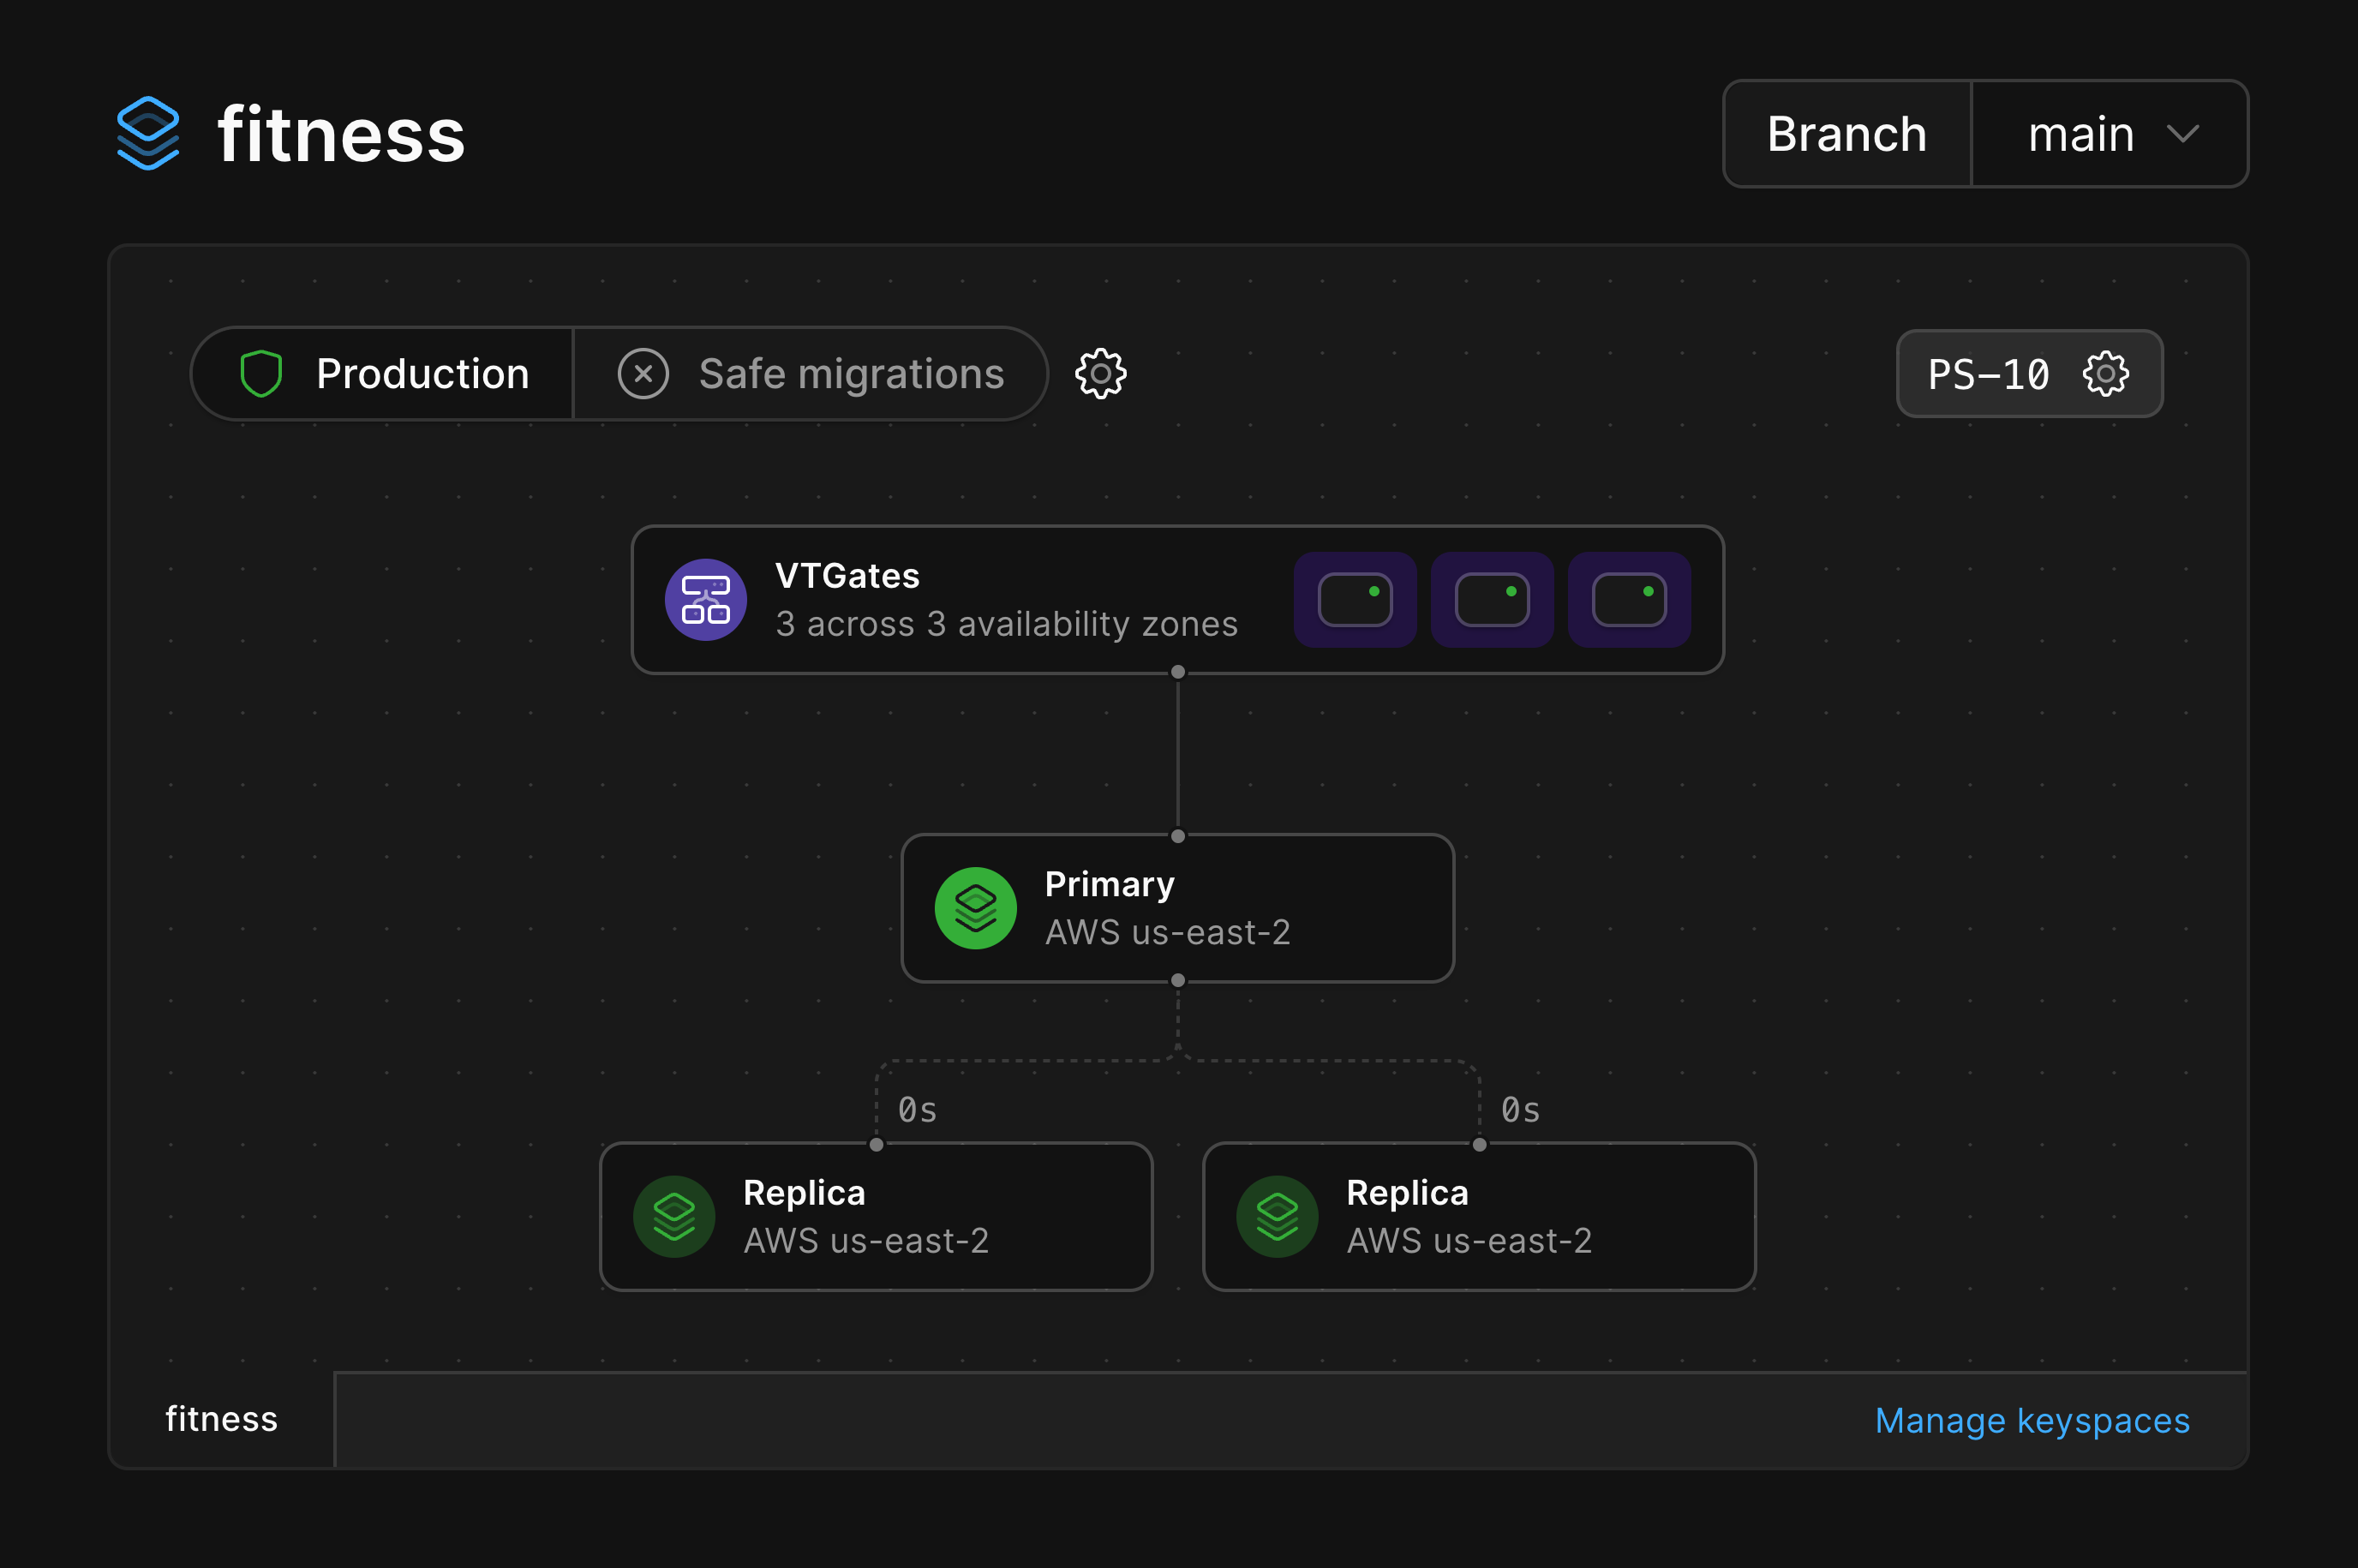
On the dashboard of every PlanetScale database is a diagram outlining the infrastructure that powers the database.
 By default, the architecture diagram will show the architecture for the keyspace corresponding to your default branch.
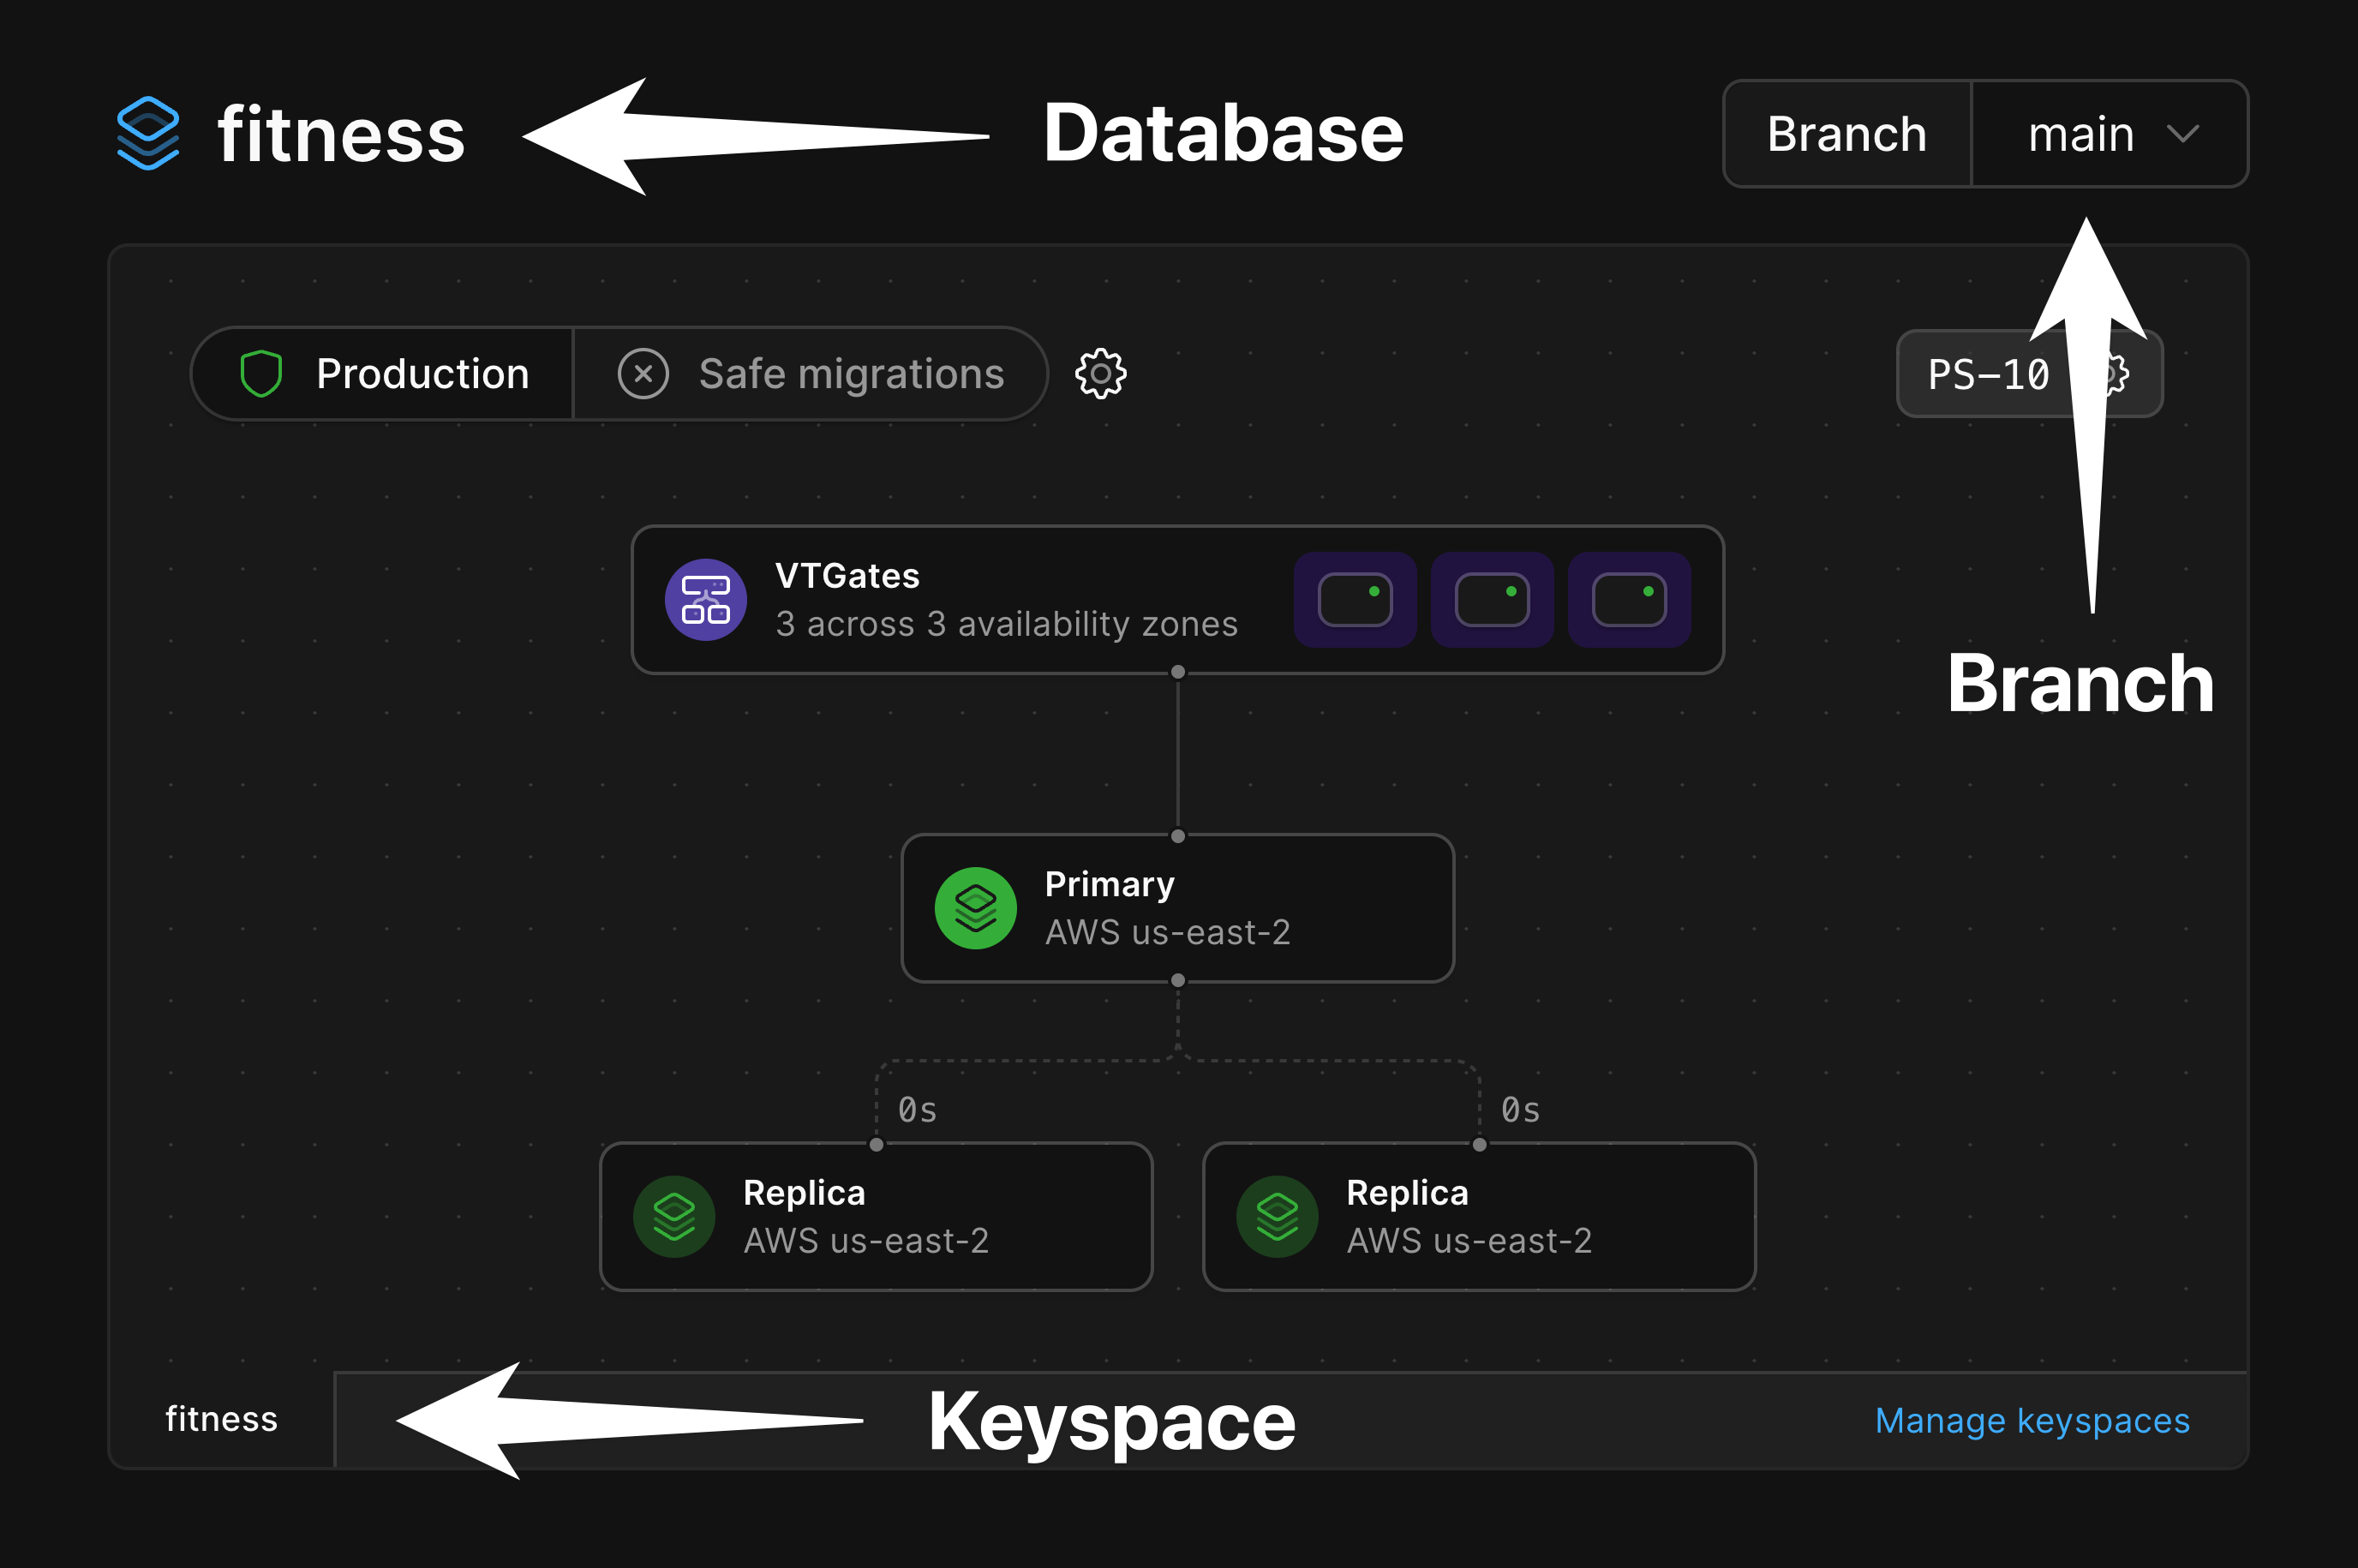
Here's how you can tell what keyspace and branch you are viewing the diagram of:
By default, the architecture diagram will show the architecture for the keyspace corresponding to your default branch.
Here's how you can tell what keyspace and branch you are viewing the diagram of:
 ### Production branches
Production branches are designed for production workloads, and as such are given enough resources to ensure high availability.
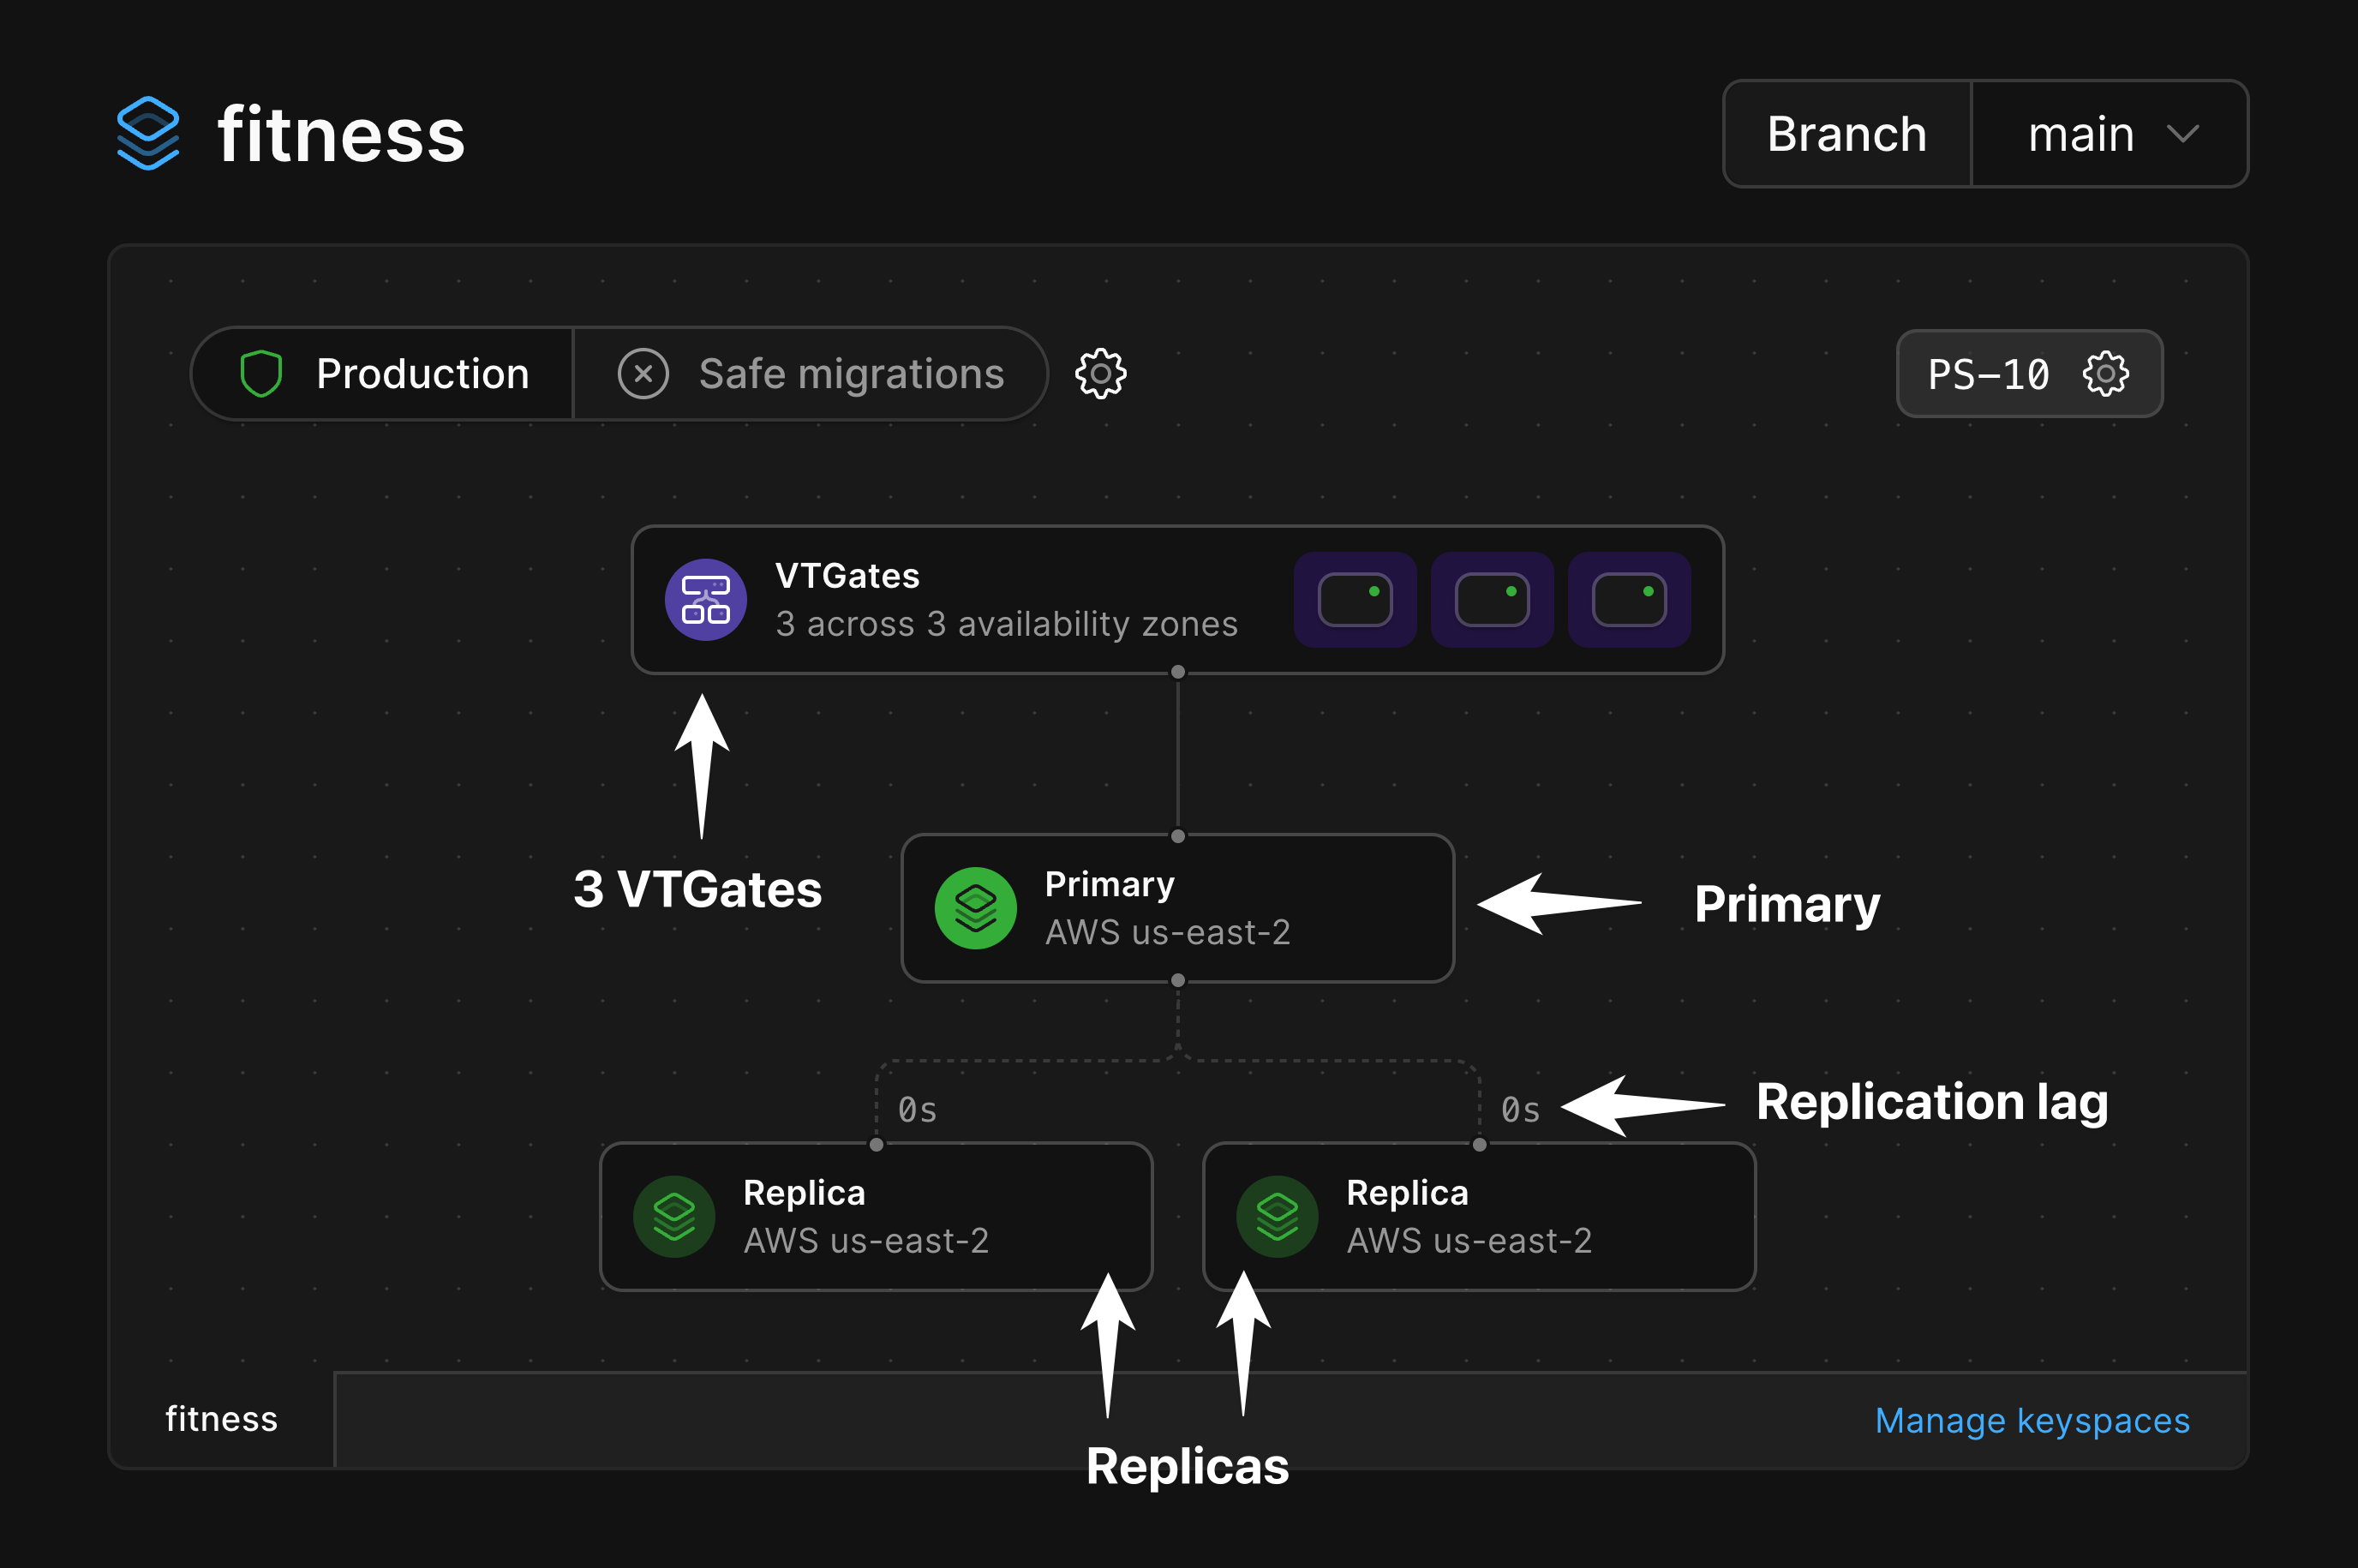
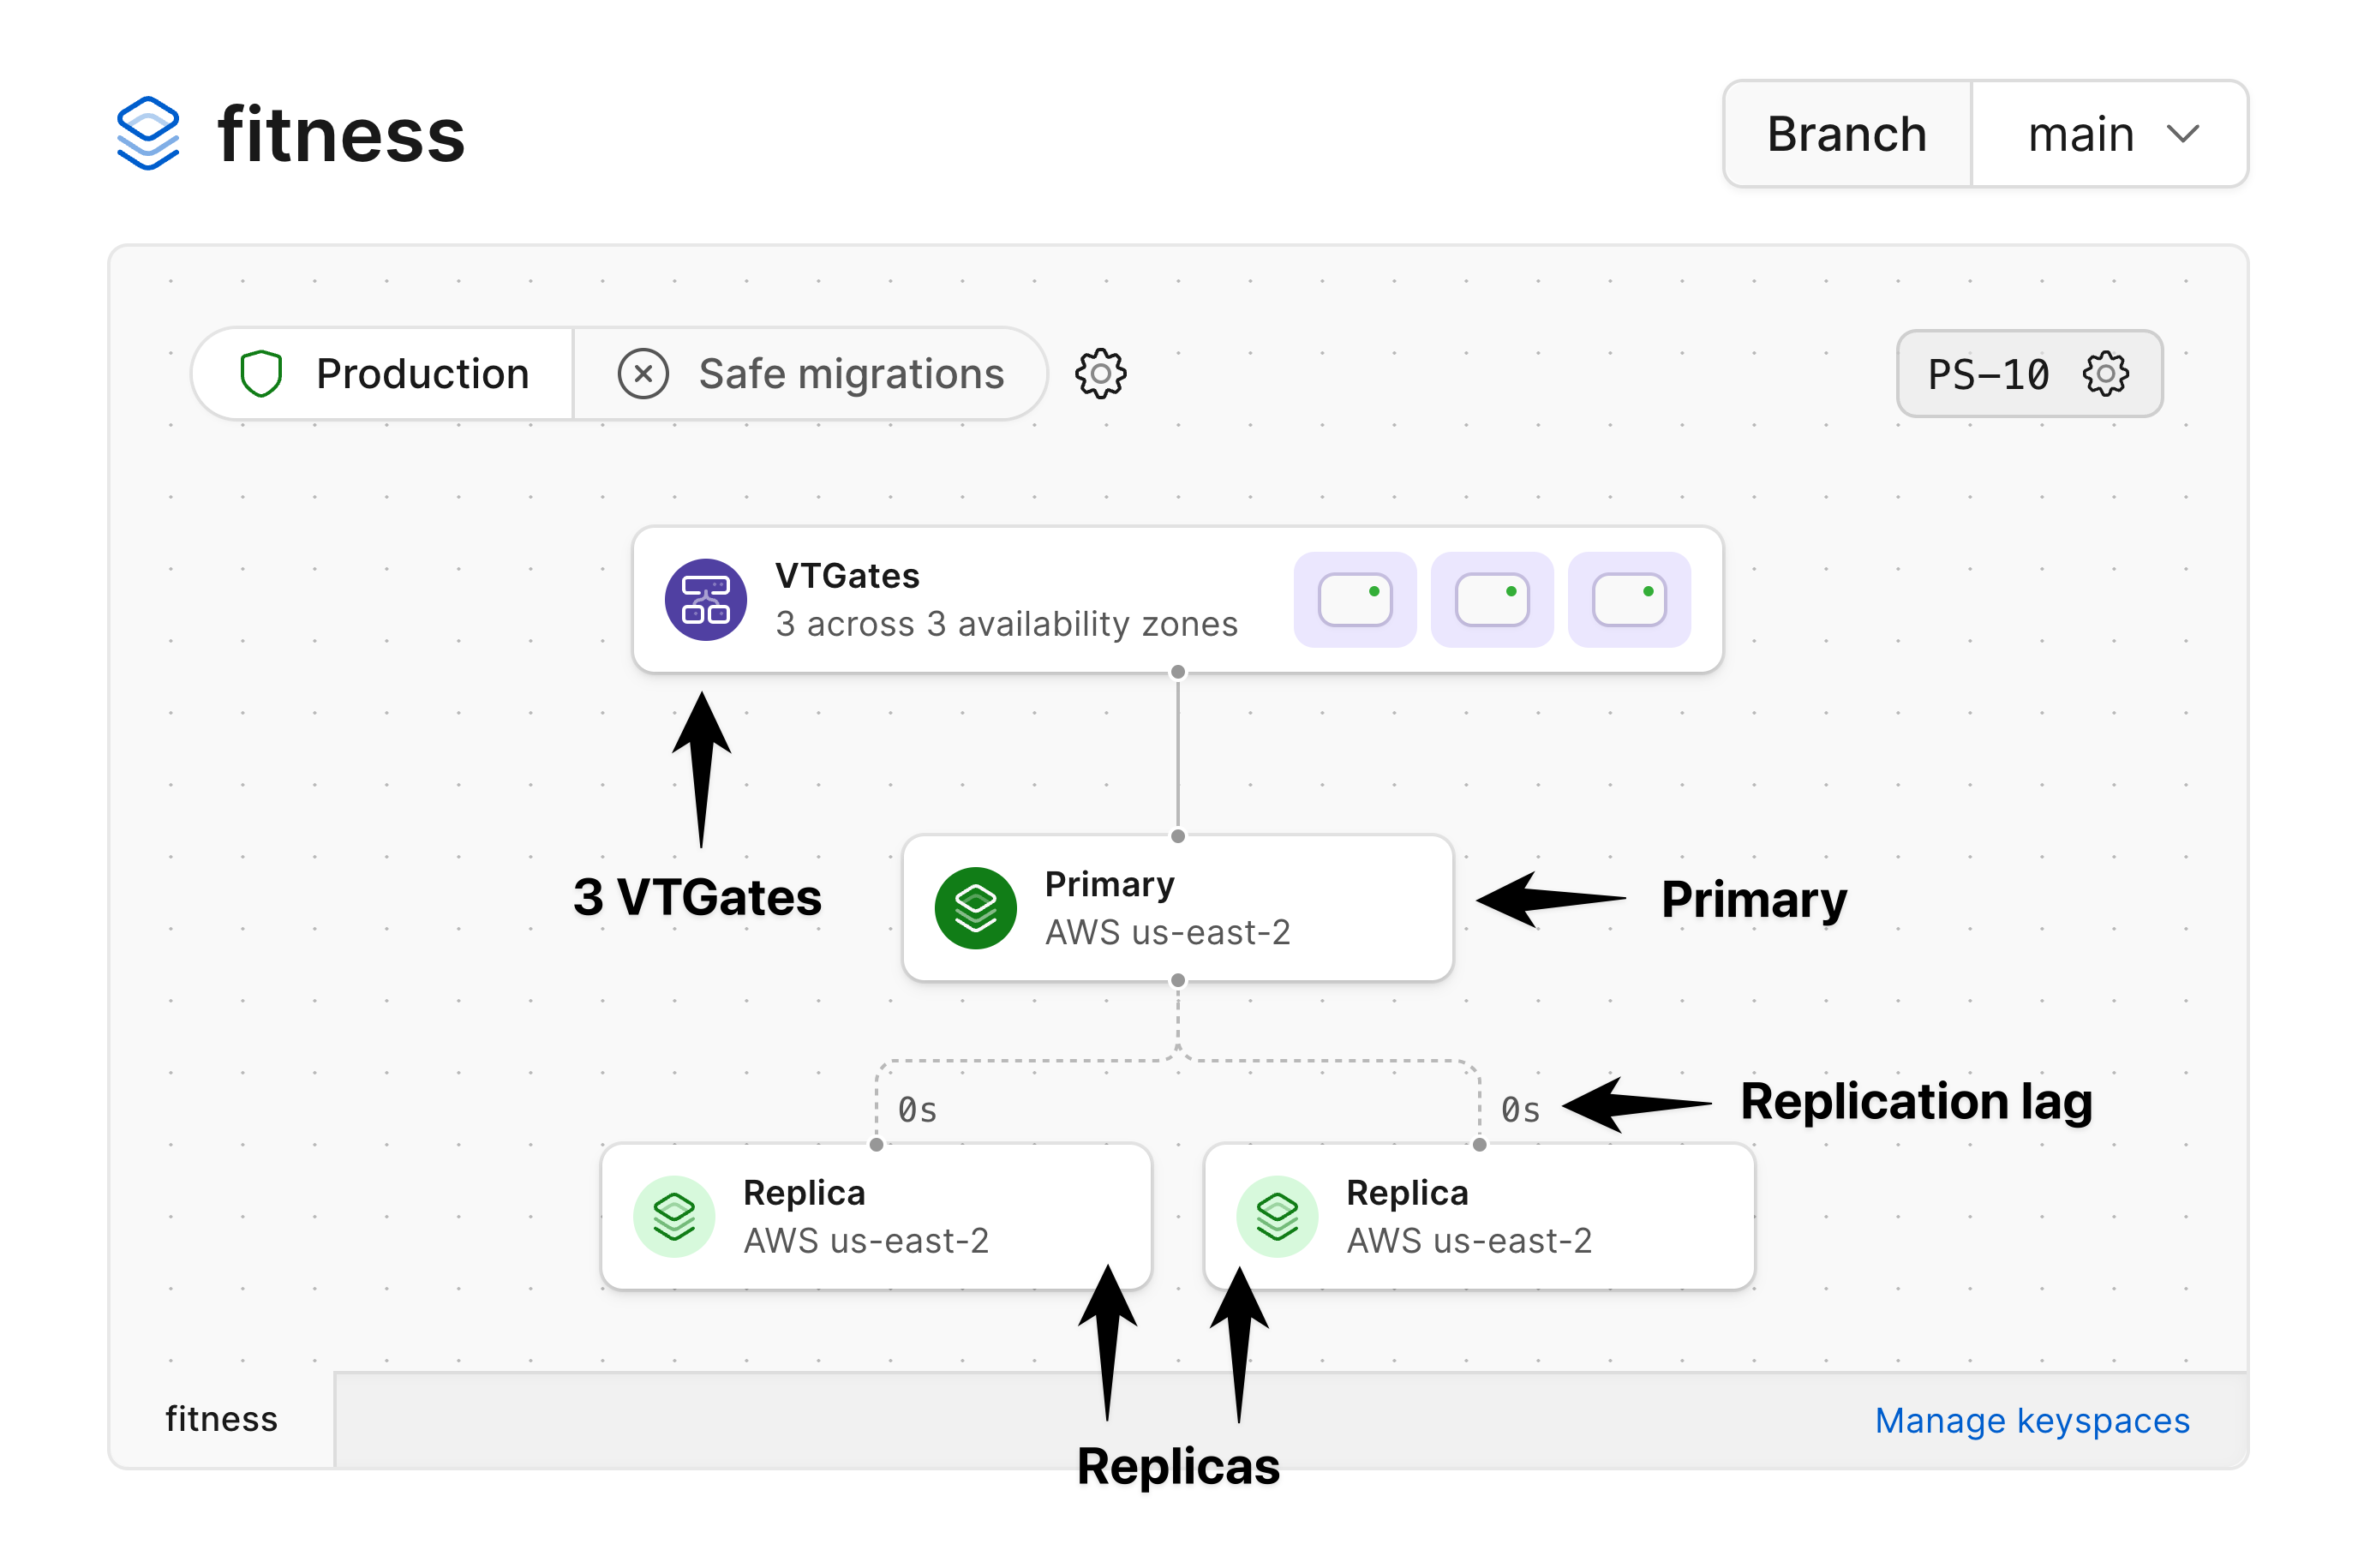
By default, every production branch has a single primary MySQL instance and two replicas.
Each primary also comes with 3 [VTGates](/vitess/terminology#vtgate) across 3 availability zones, which act as proxies for your MySQL instances.
These are all pictured in the diagram for a production branch:
### Production branches
Production branches are designed for production workloads, and as such are given enough resources to ensure high availability.
By default, every production branch has a single primary MySQL instance and two replicas.
Each primary also comes with 3 [VTGates](/vitess/terminology#vtgate) across 3 availability zones, which act as proxies for your MySQL instances.
These are all pictured in the diagram for a production branch:
 Generally, the application connecting to this database need not be aware of these various components.
One exception to this is if you are specifically trying to [send queries to a replica](/vitess/scaling/replicas#how-to-query-replicas).
### Development branches
Development branches are specced to enable the development and testing of new features and are not designed for production workloads.
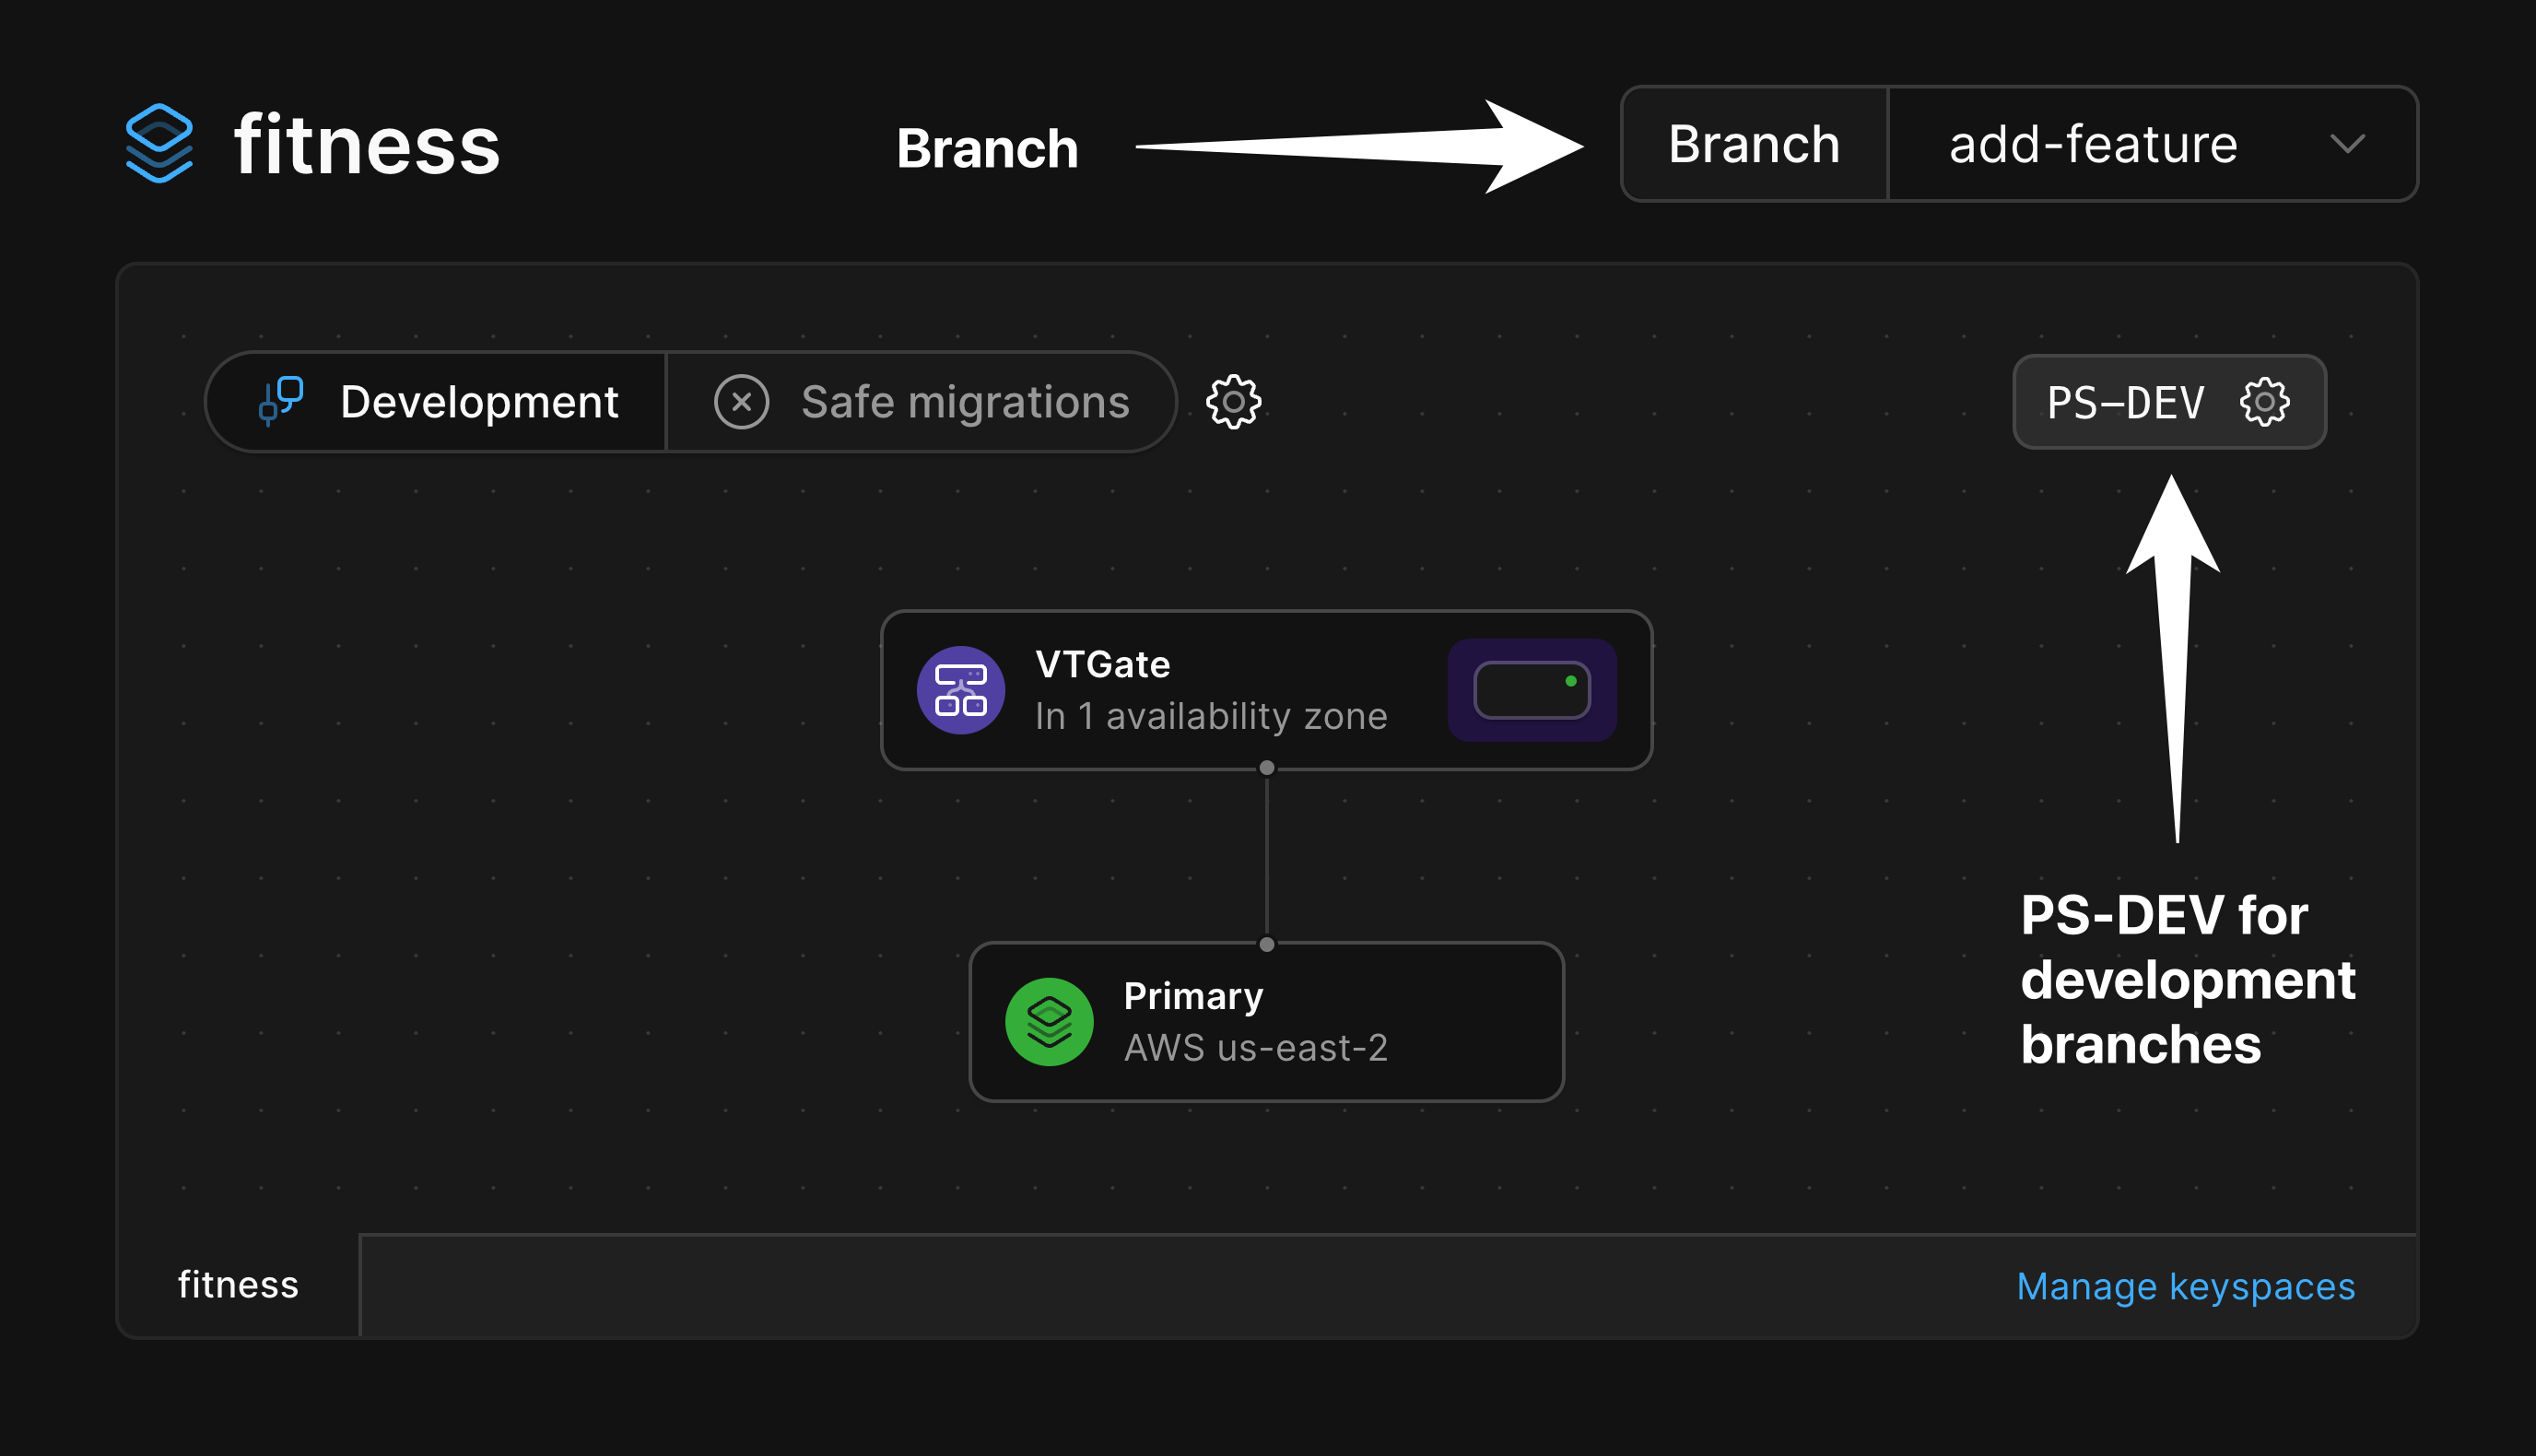
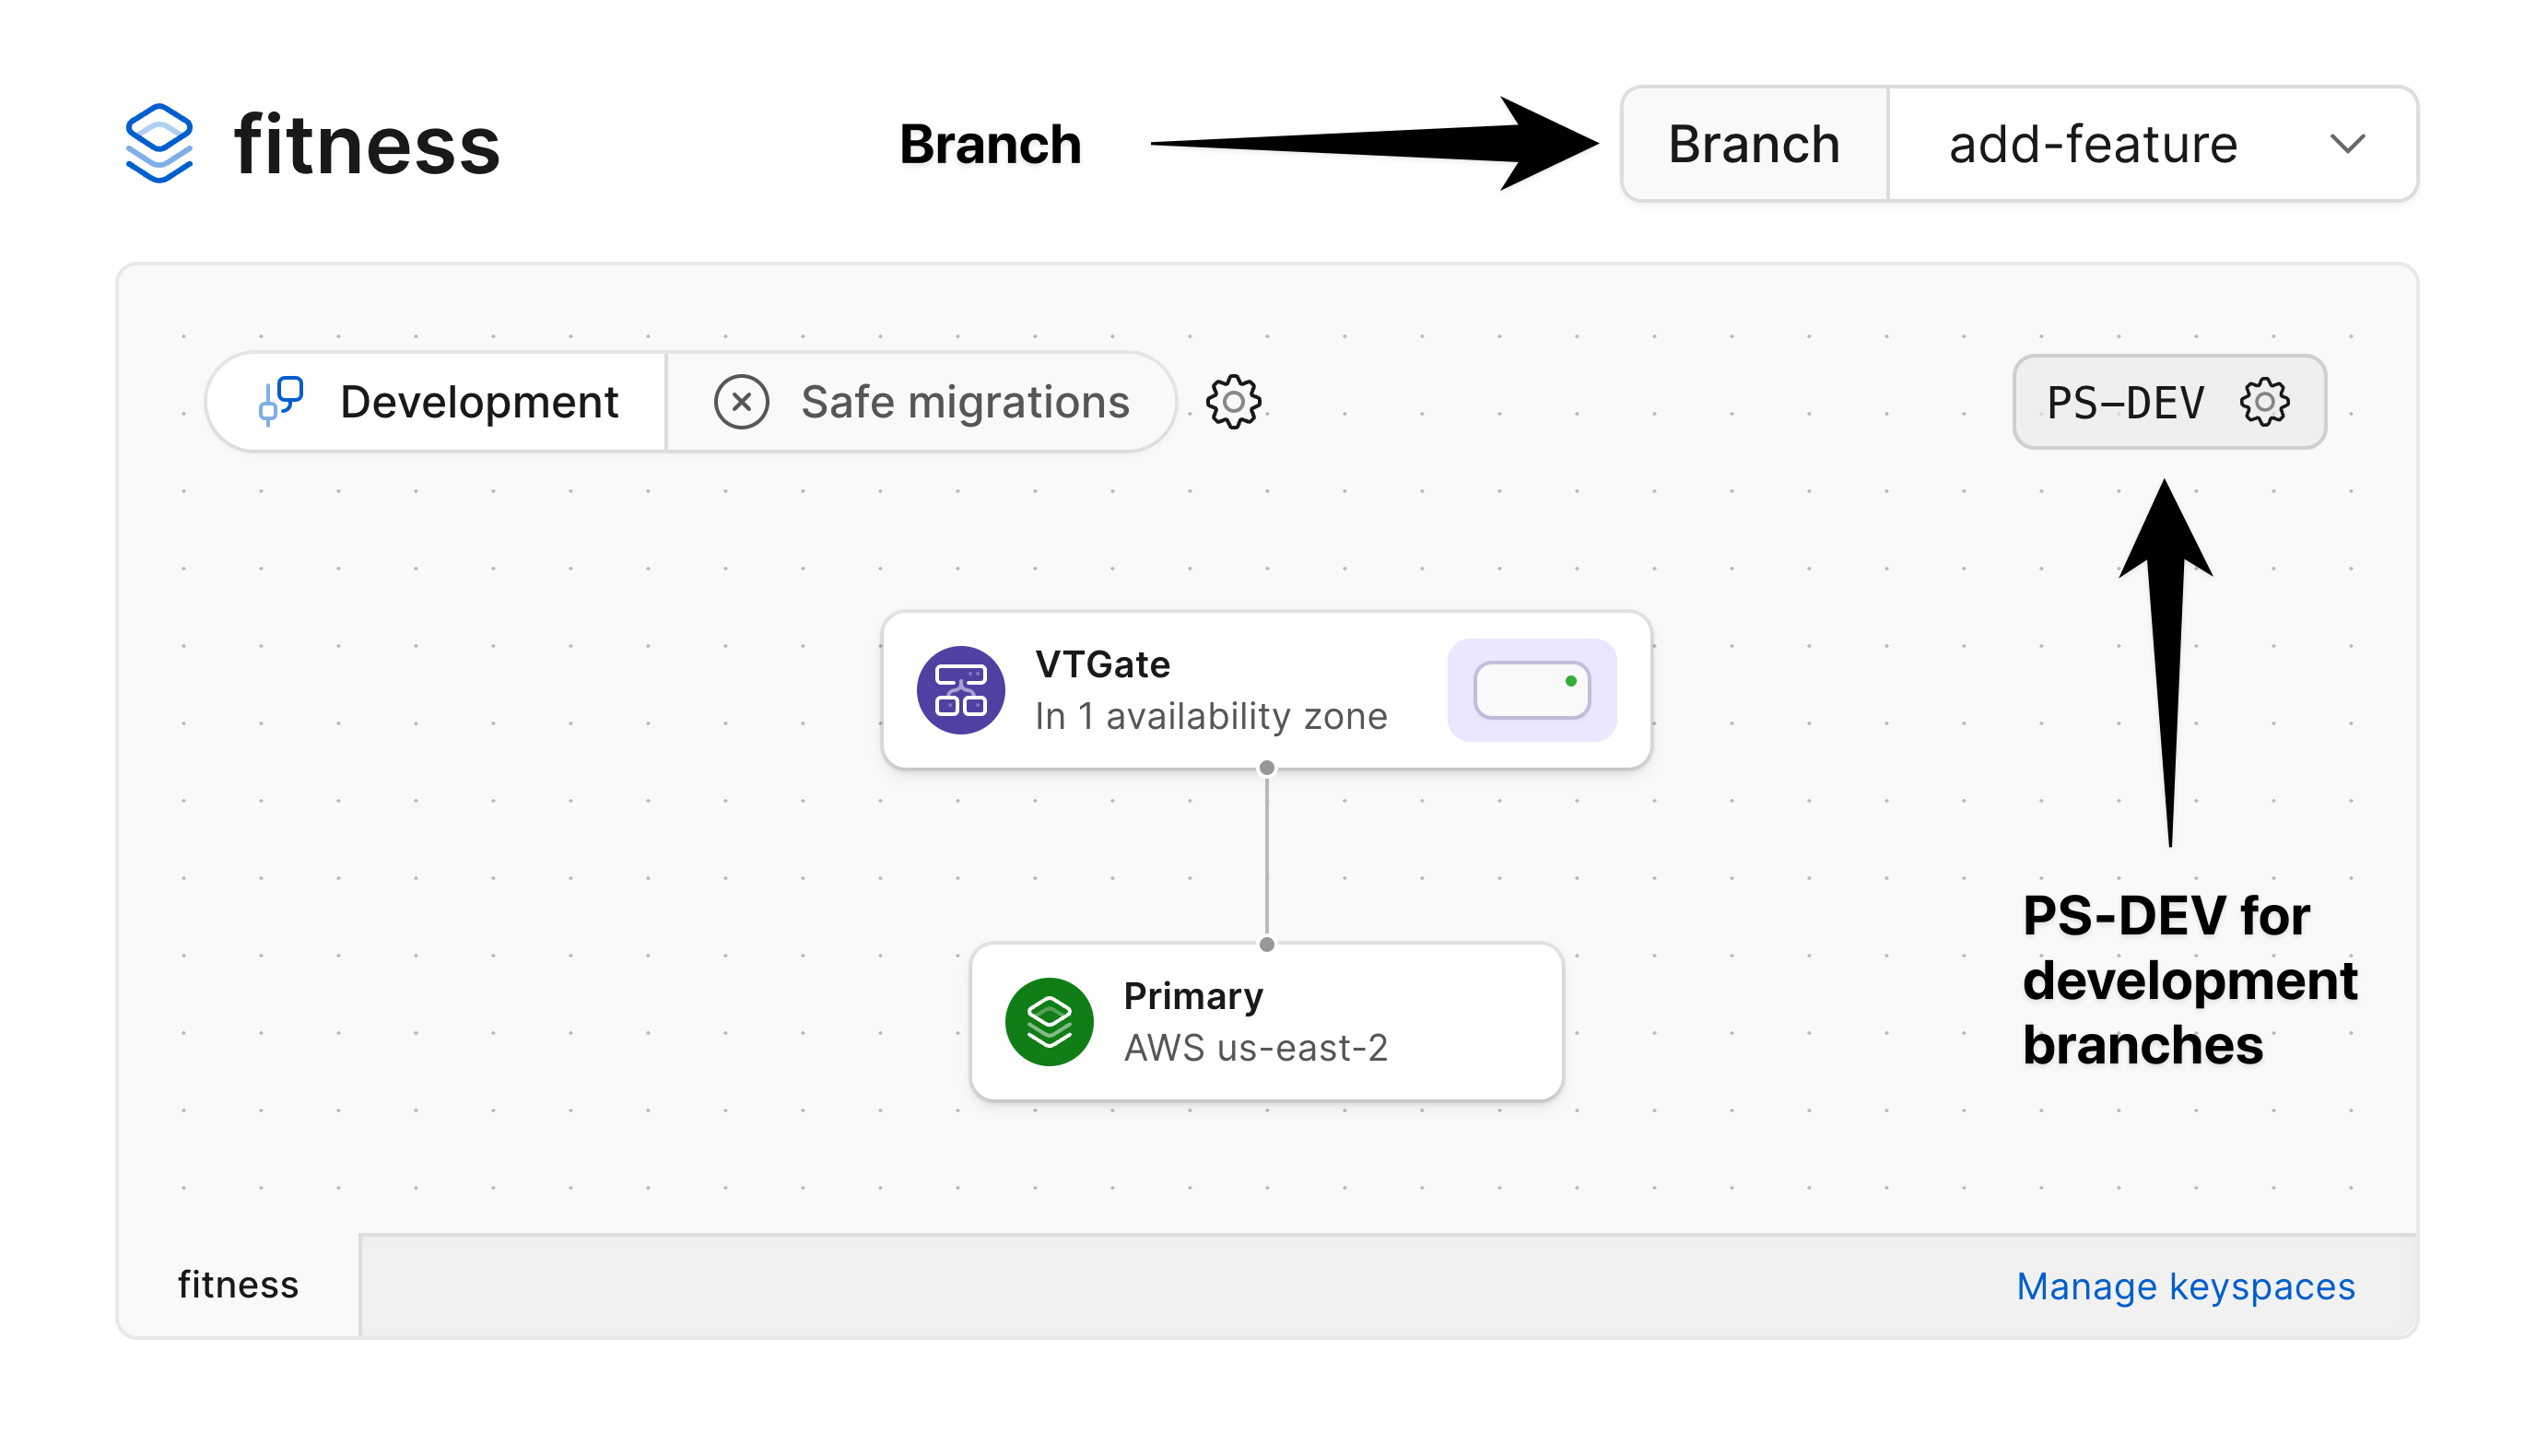
When a new development branch is created, a single MySQL node is created along with a VTGate that handles connections to that node.
This is reflected in the diagram of a development branch.
Generally, the application connecting to this database need not be aware of these various components.
One exception to this is if you are specifically trying to [send queries to a replica](/vitess/scaling/replicas#how-to-query-replicas).
### Development branches
Development branches are specced to enable the development and testing of new features and are not designed for production workloads.
When a new development branch is created, a single MySQL node is created along with a VTGate that handles connections to that node.
This is reflected in the diagram of a development branch.
 When you promote a development branch to production status, PlanetScale automatically adds additional replicas and VTGates deployed across multiple availability zones in a given region.
### Read-only regions
The primary of your database is the only node that can accept writes, and it resides in a single region.
You can add [read-only regions](/vitess/scaling/read-only-regions) to each keyspace on a production branch, which adds replicas in another region that can be used to serve read traffic.
This can help reduce read latency for application servers that are distributed around the world.
Each read-only region's cluster size and number of replicas are configured per keyspace on the [Clusters page](/vitess/cluster-configuration).
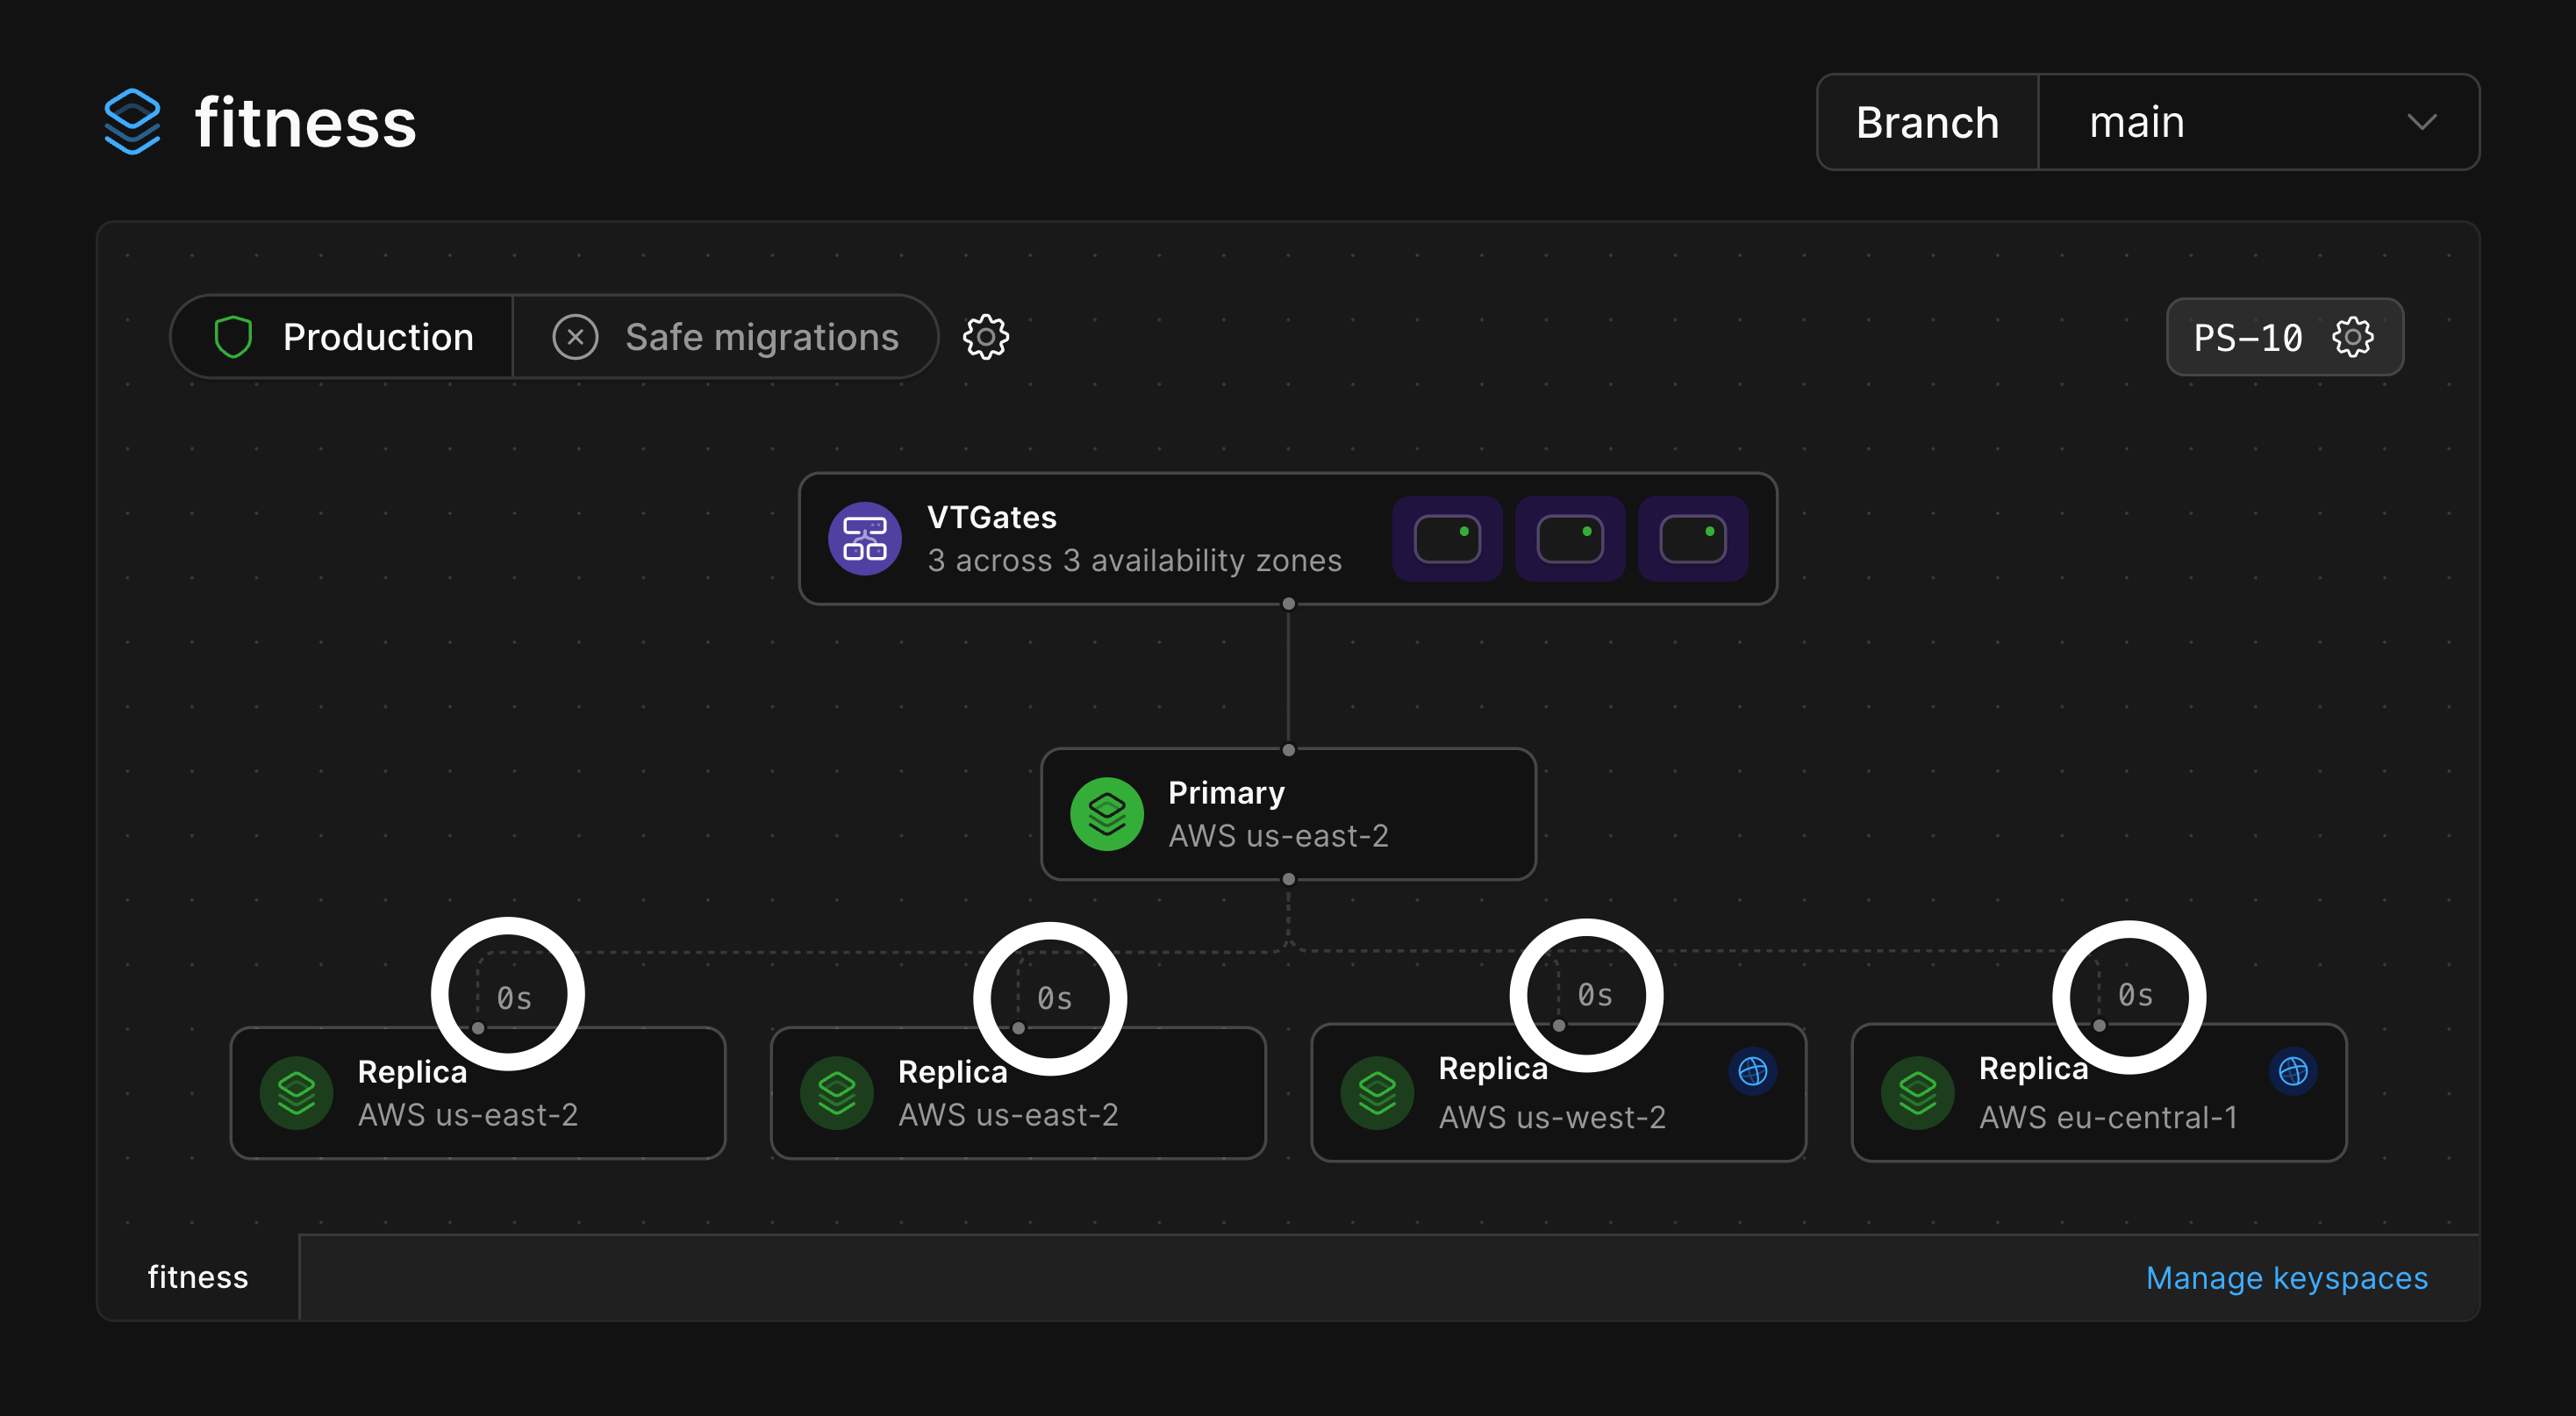
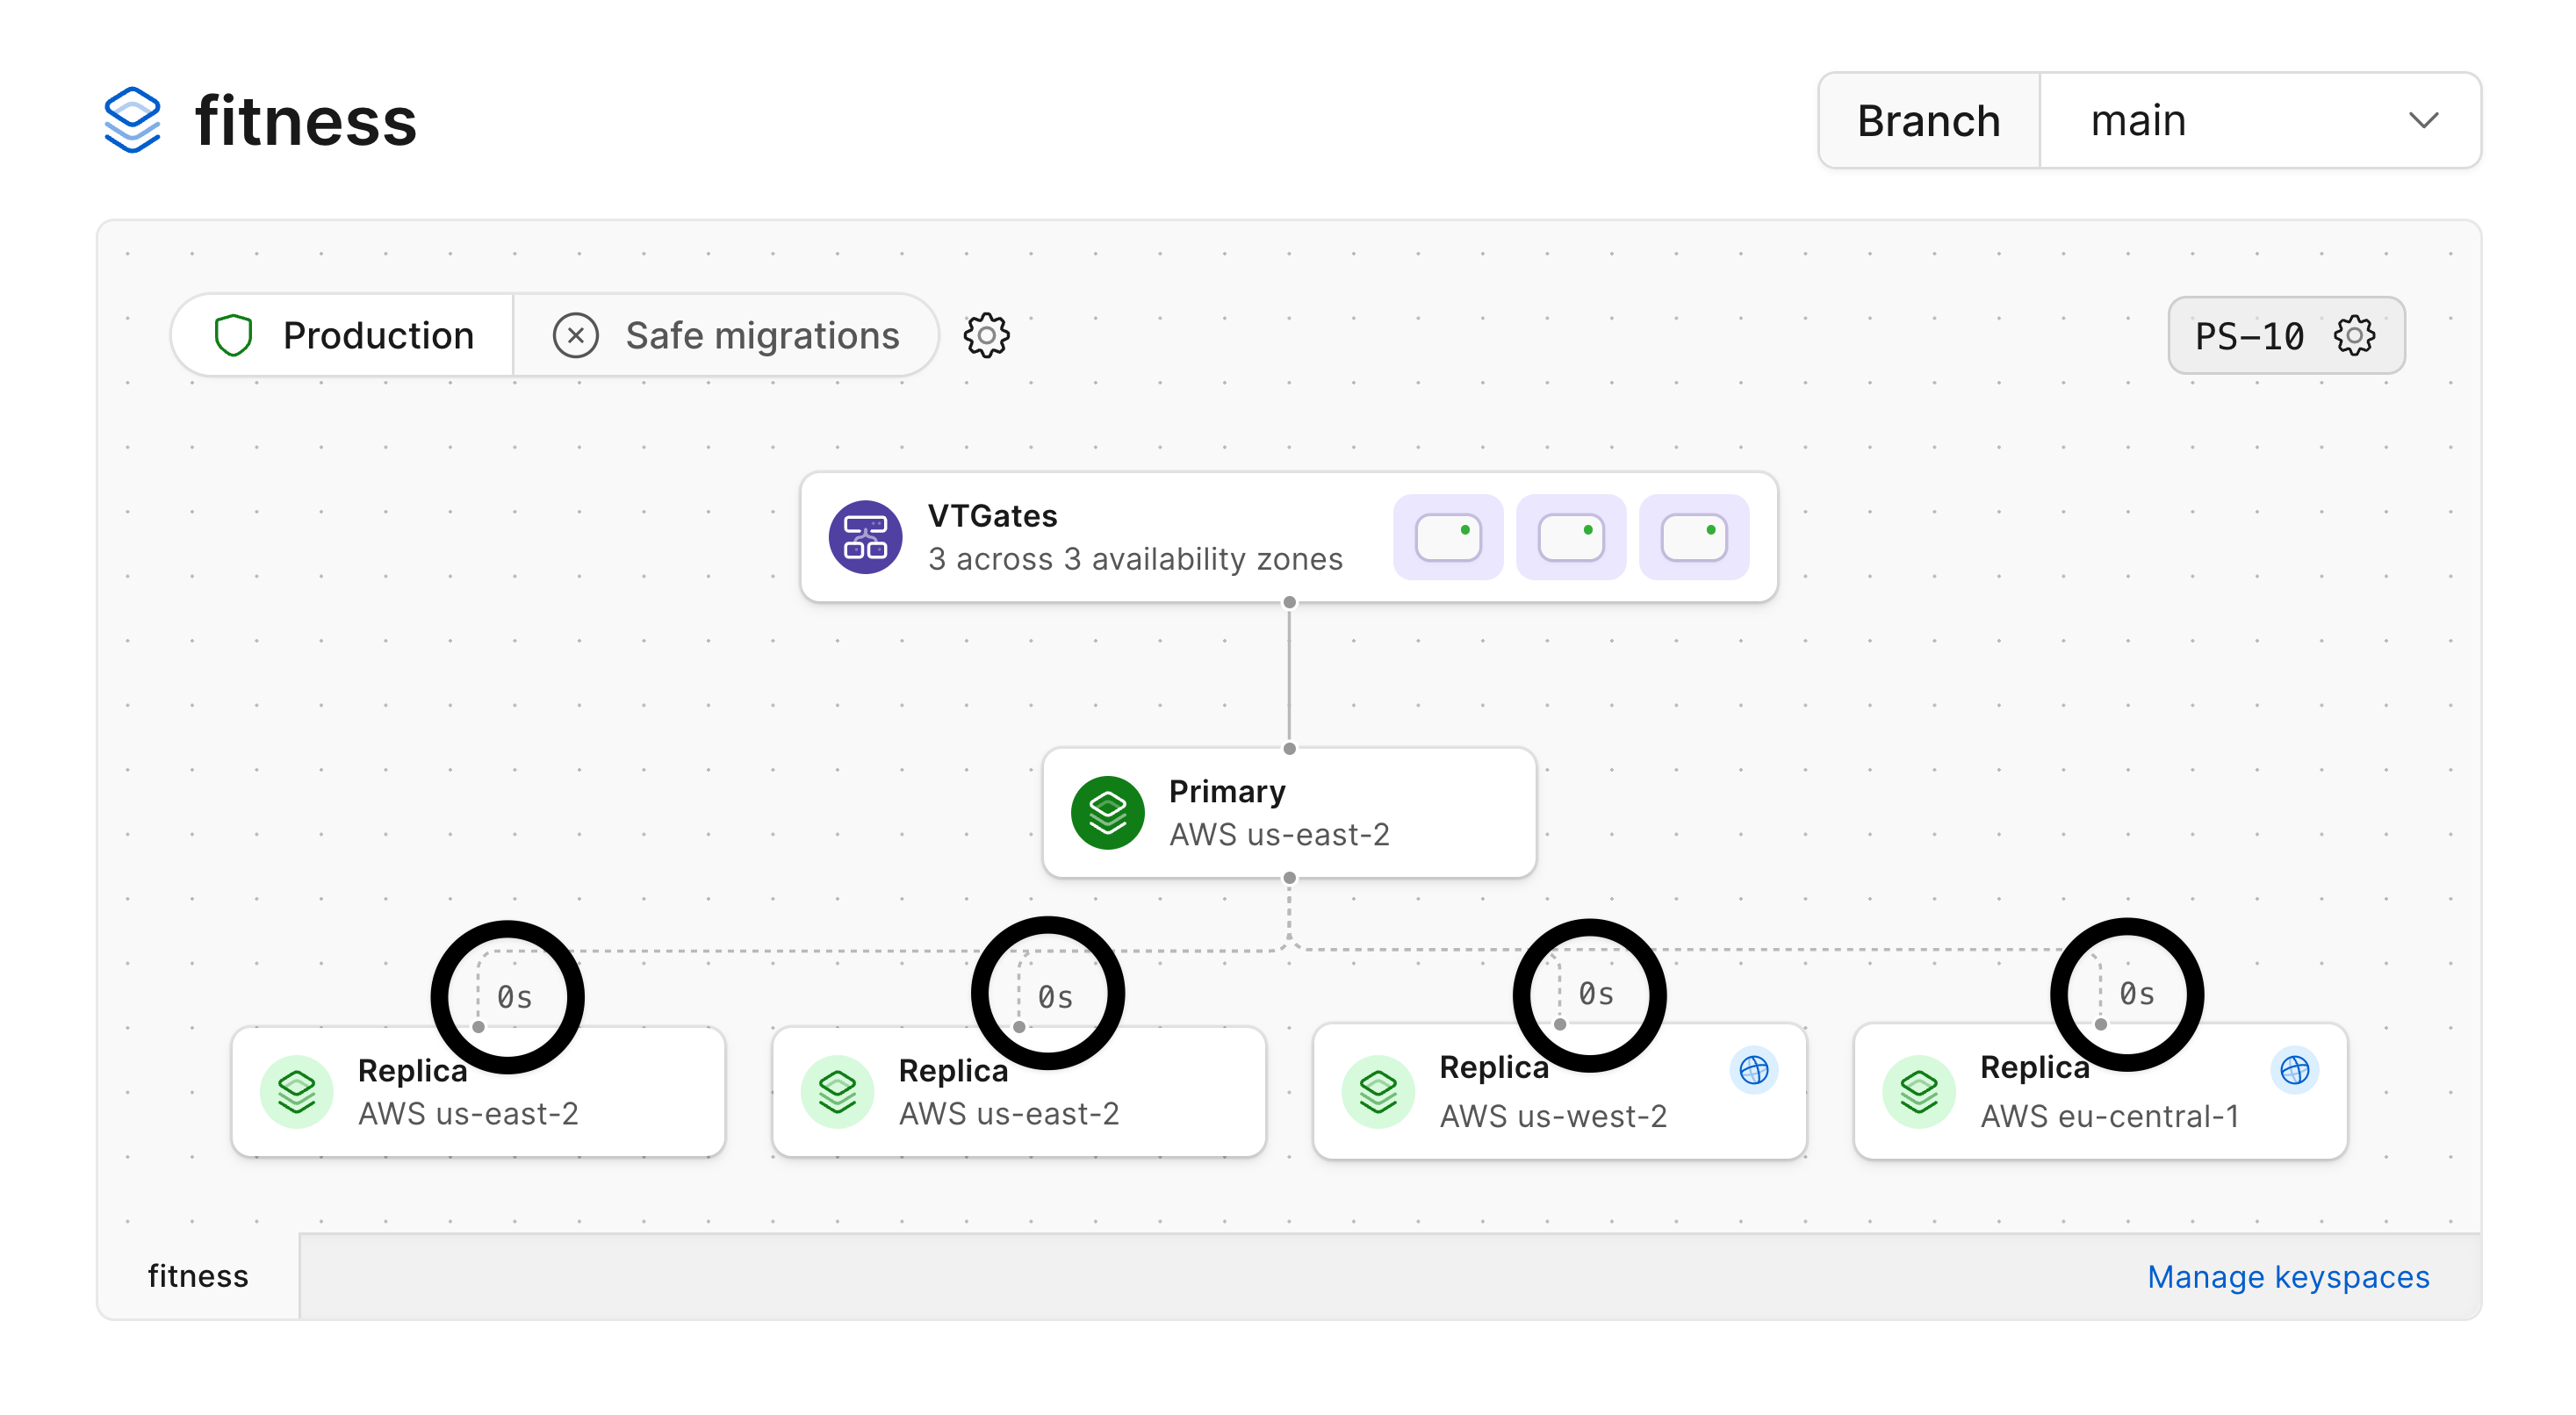
Below, you can see our database has the primary and two replicas in `us-east-2` with read-only replicas added in both `us-west-2` and `eu-central-1`.
When you promote a development branch to production status, PlanetScale automatically adds additional replicas and VTGates deployed across multiple availability zones in a given region.
### Read-only regions
The primary of your database is the only node that can accept writes, and it resides in a single region.
You can add [read-only regions](/vitess/scaling/read-only-regions) to each keyspace on a production branch, which adds replicas in another region that can be used to serve read traffic.
This can help reduce read latency for application servers that are distributed around the world.
Each read-only region's cluster size and number of replicas are configured per keyspace on the [Clusters page](/vitess/cluster-configuration).
Below, you can see our database has the primary and two replicas in `us-east-2` with read-only replicas added in both `us-west-2` and `eu-central-1`.
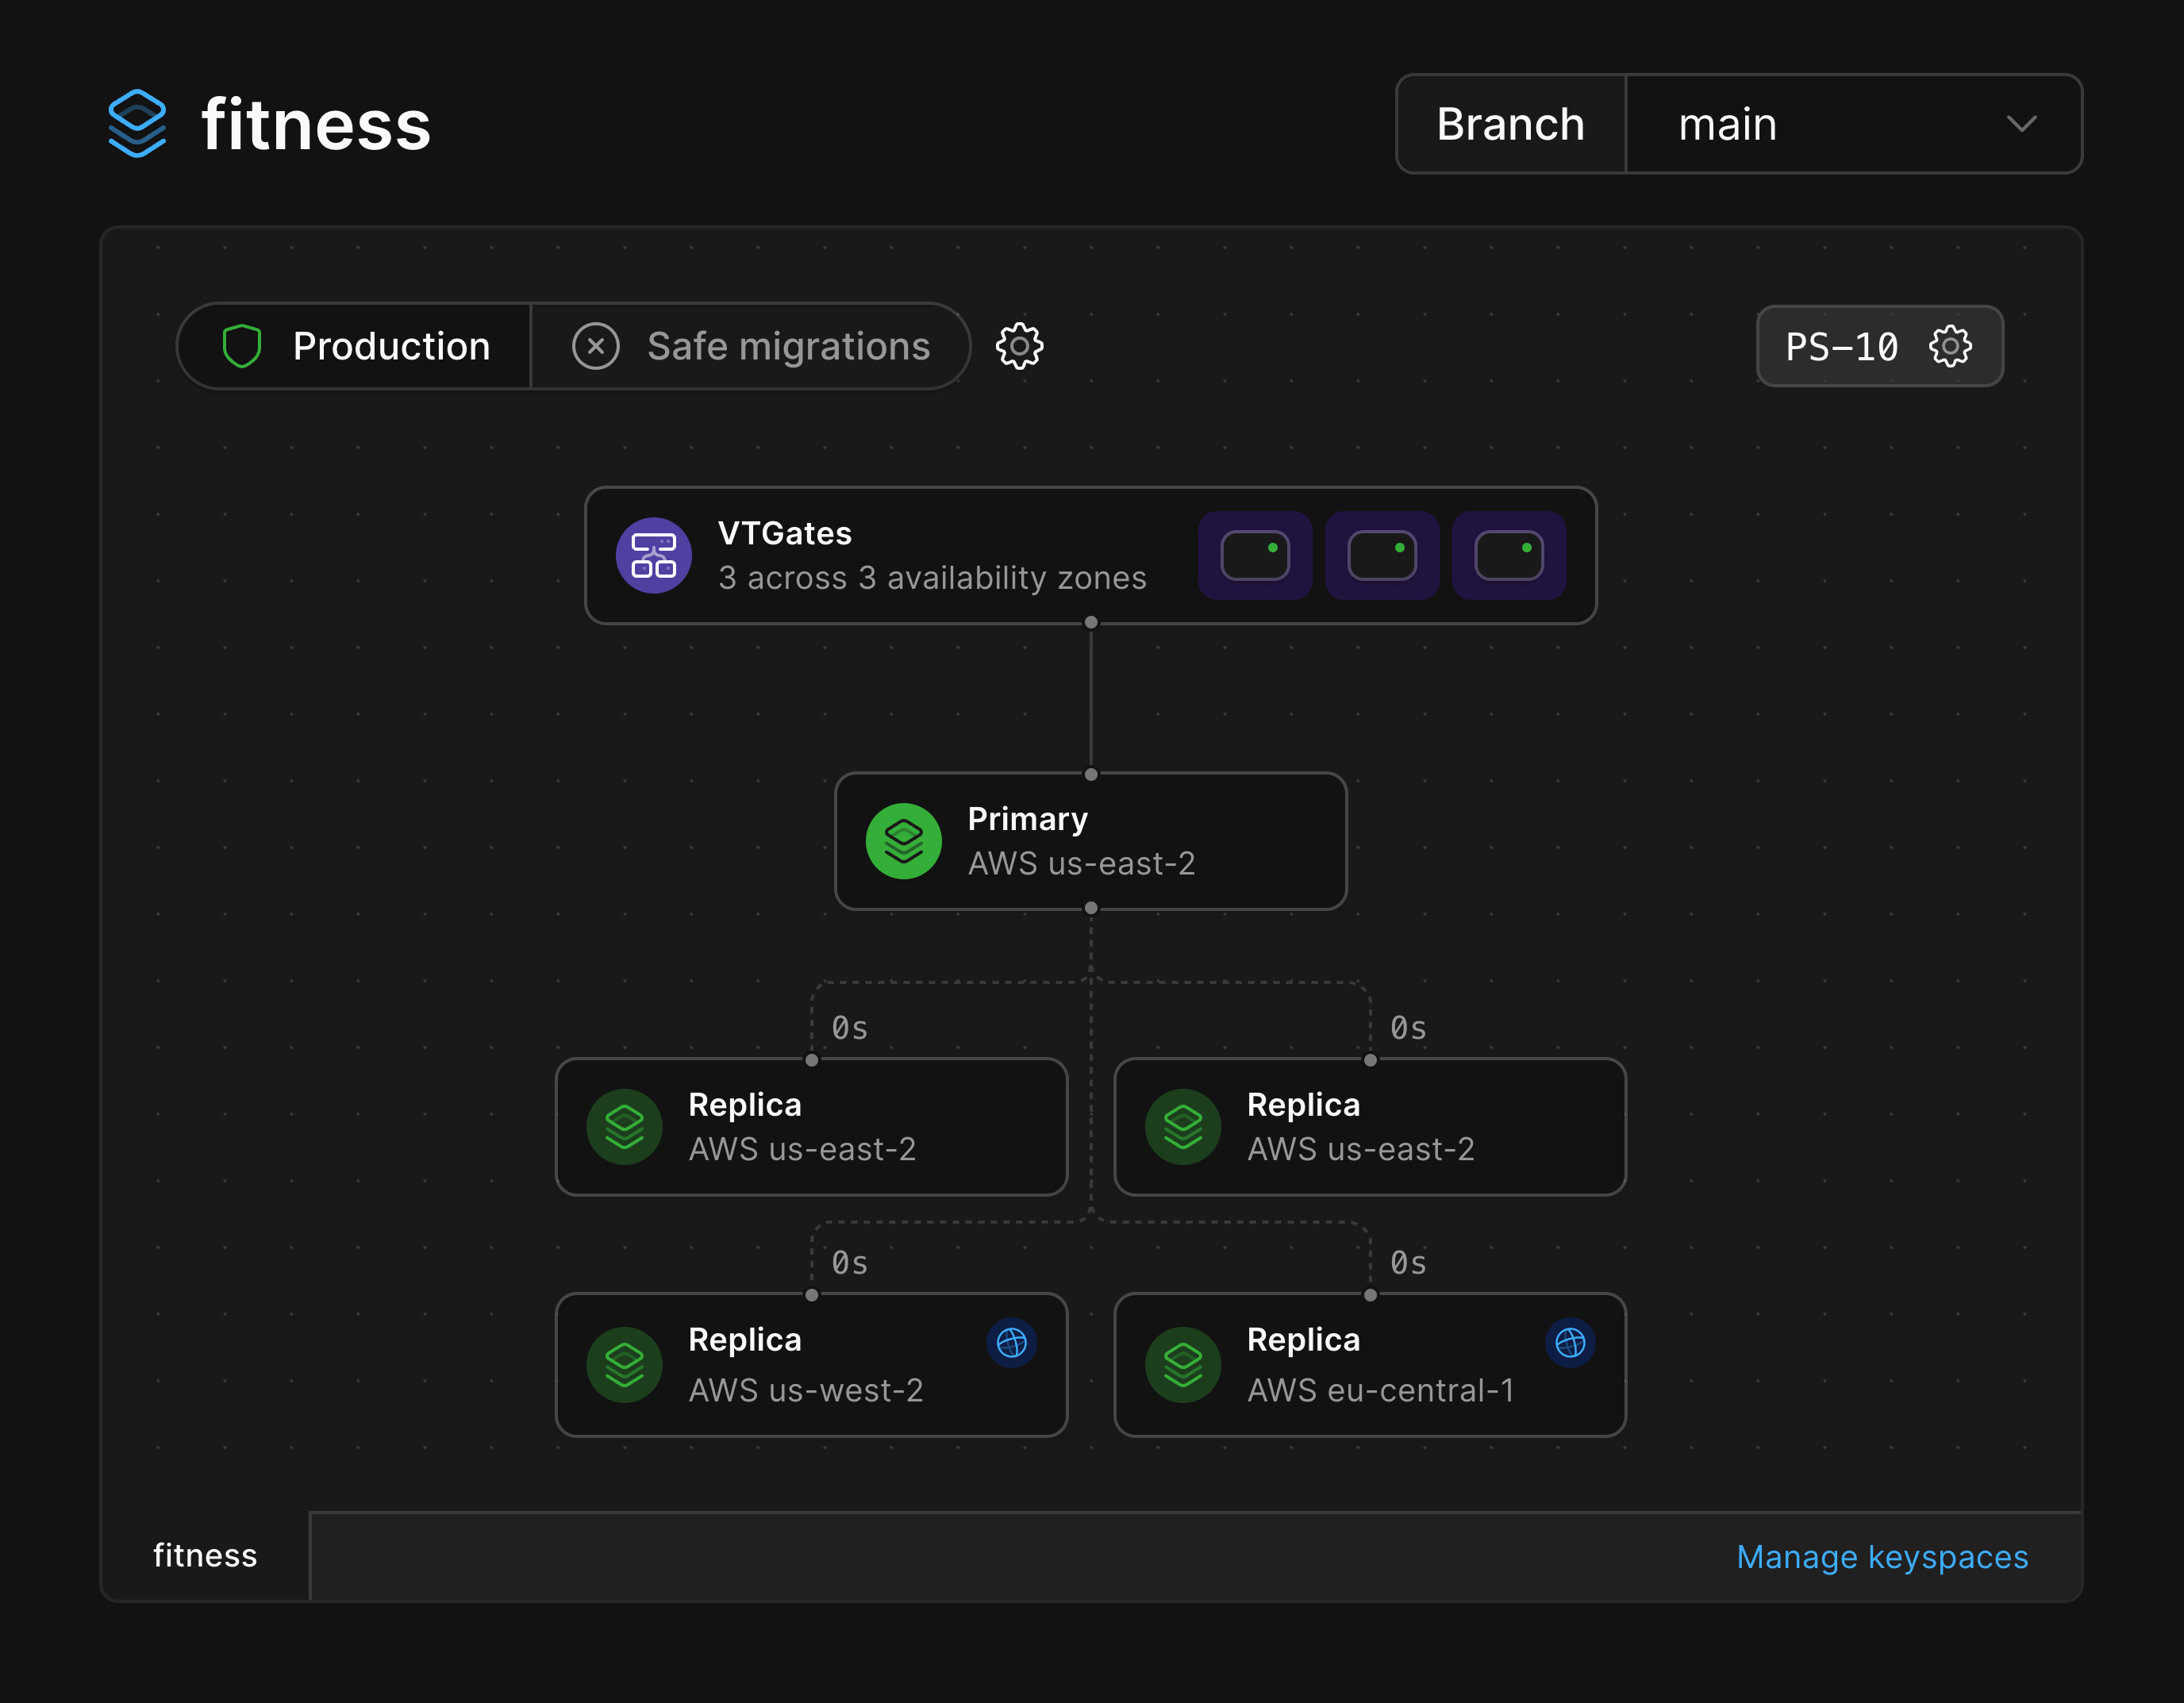
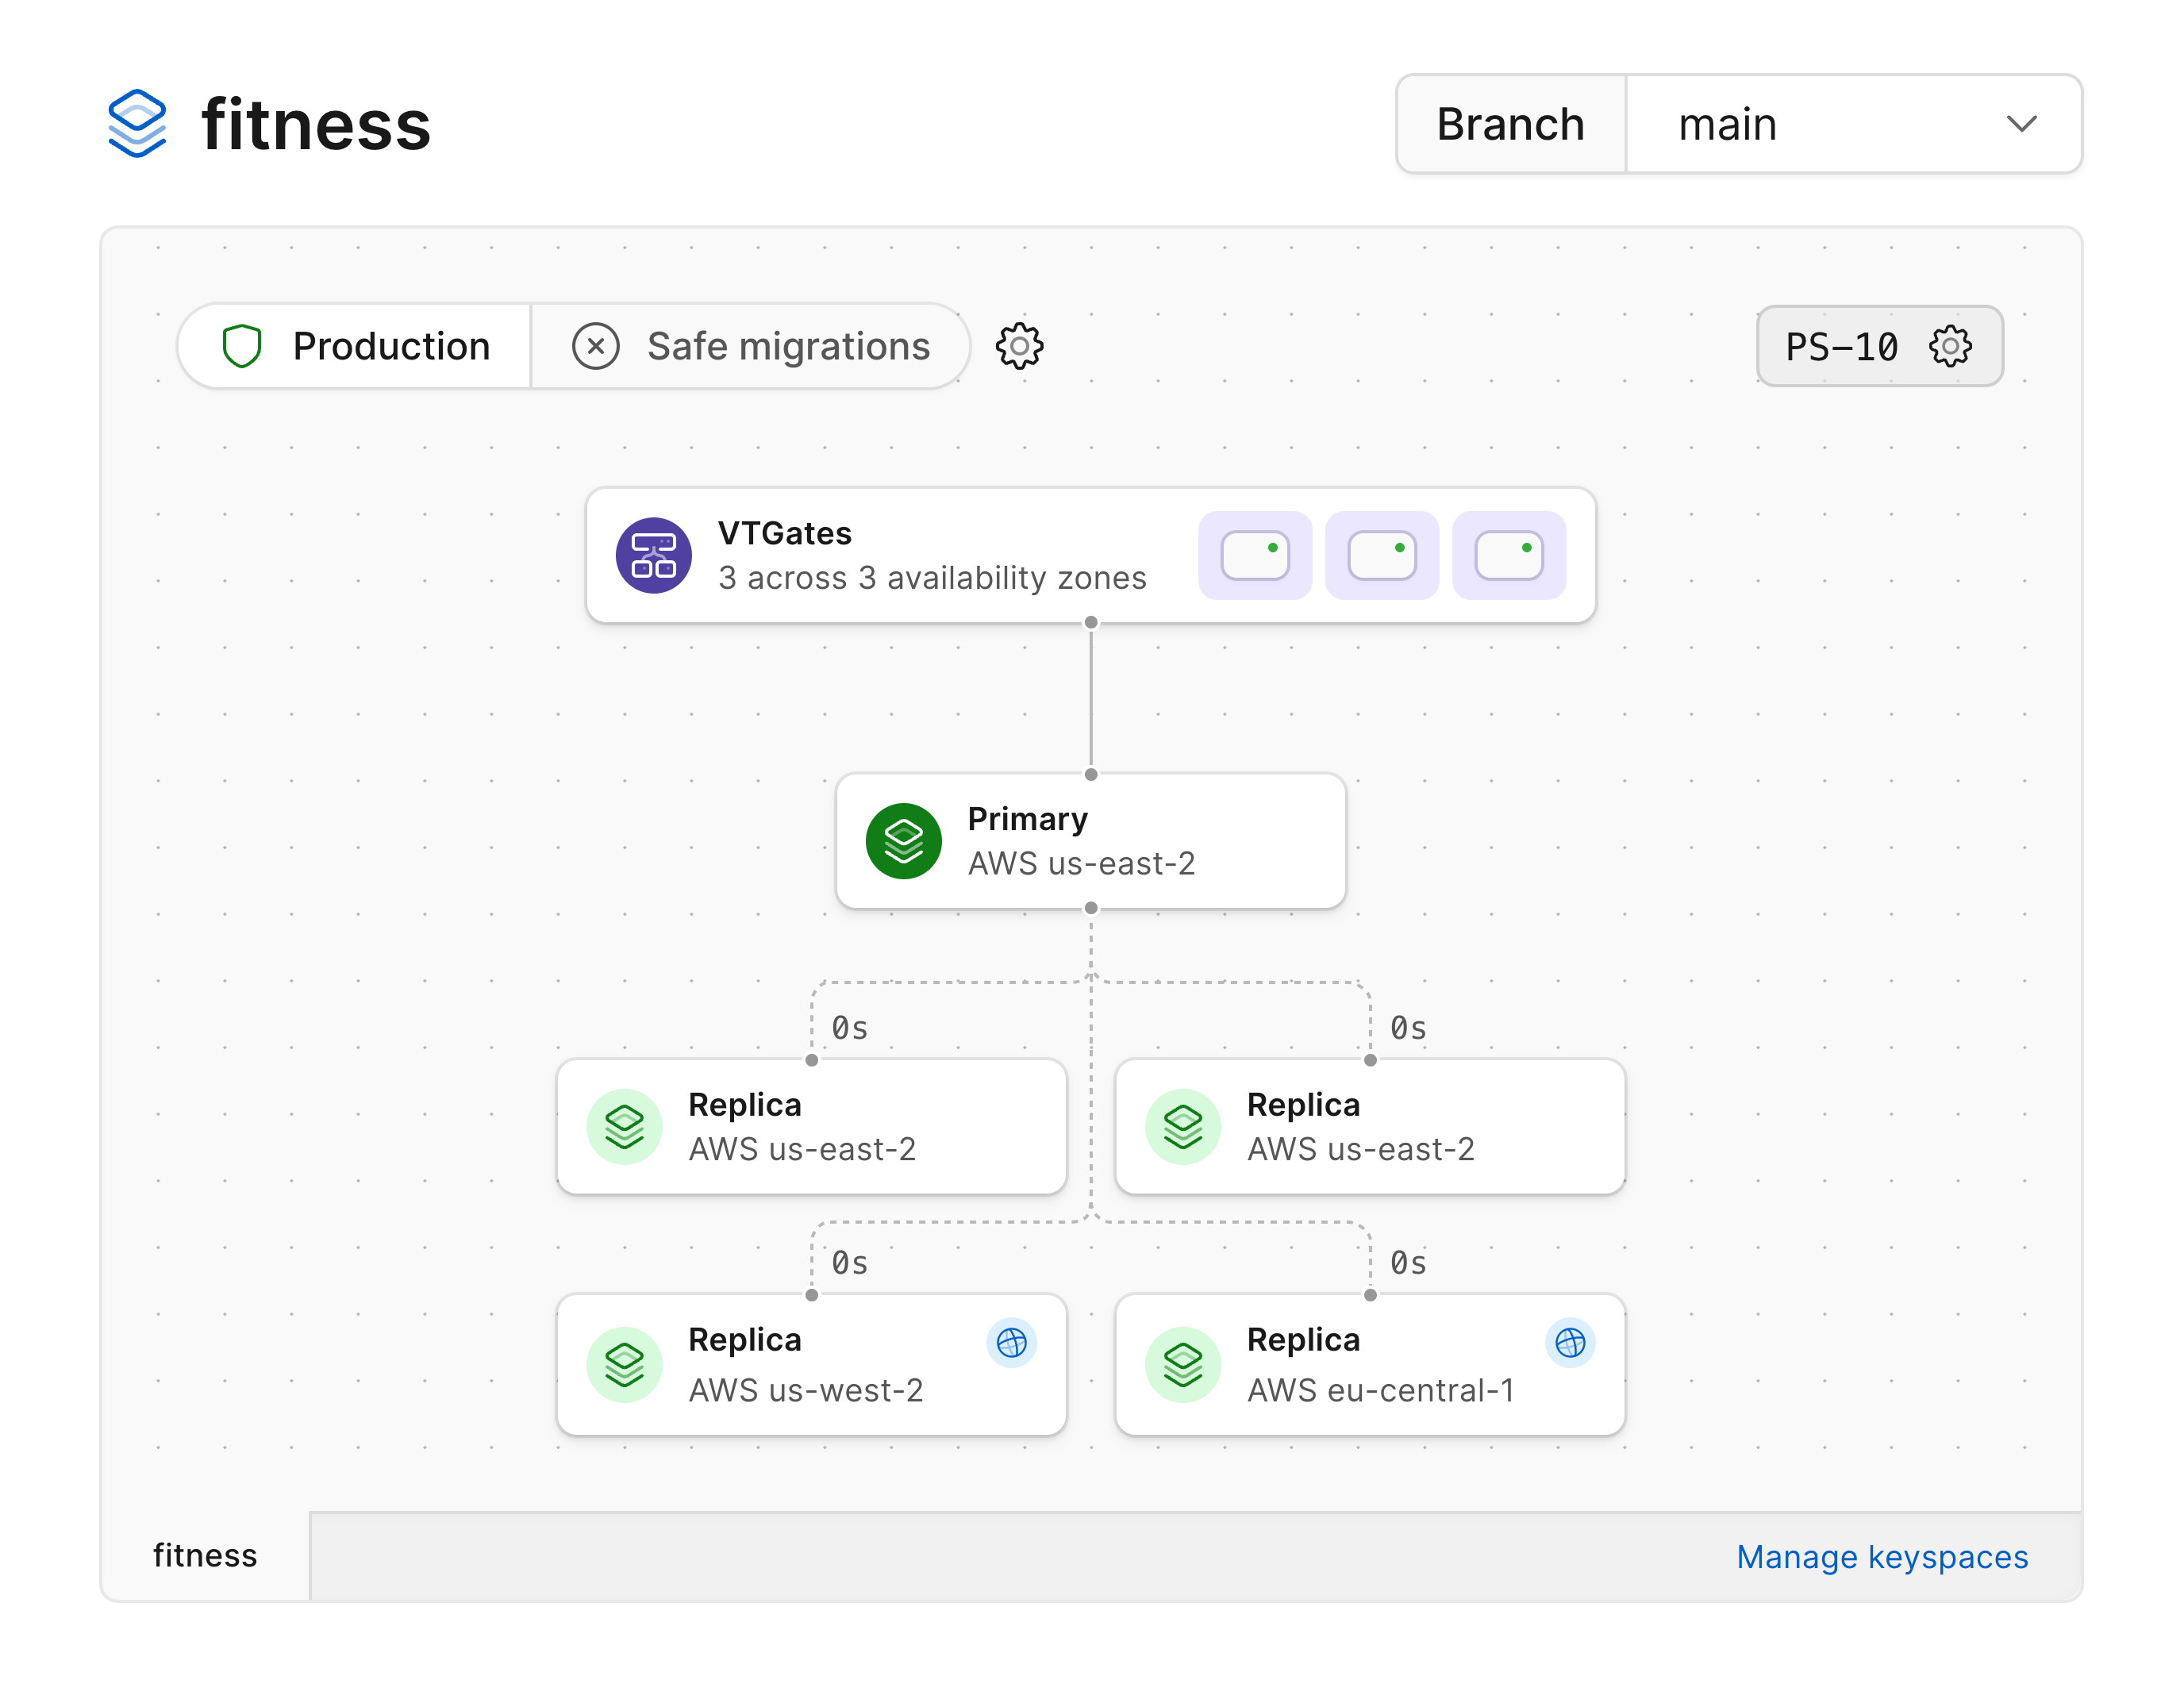 The read-only replicas can be identified by the blue globe icon.
## Infrastructure metrics
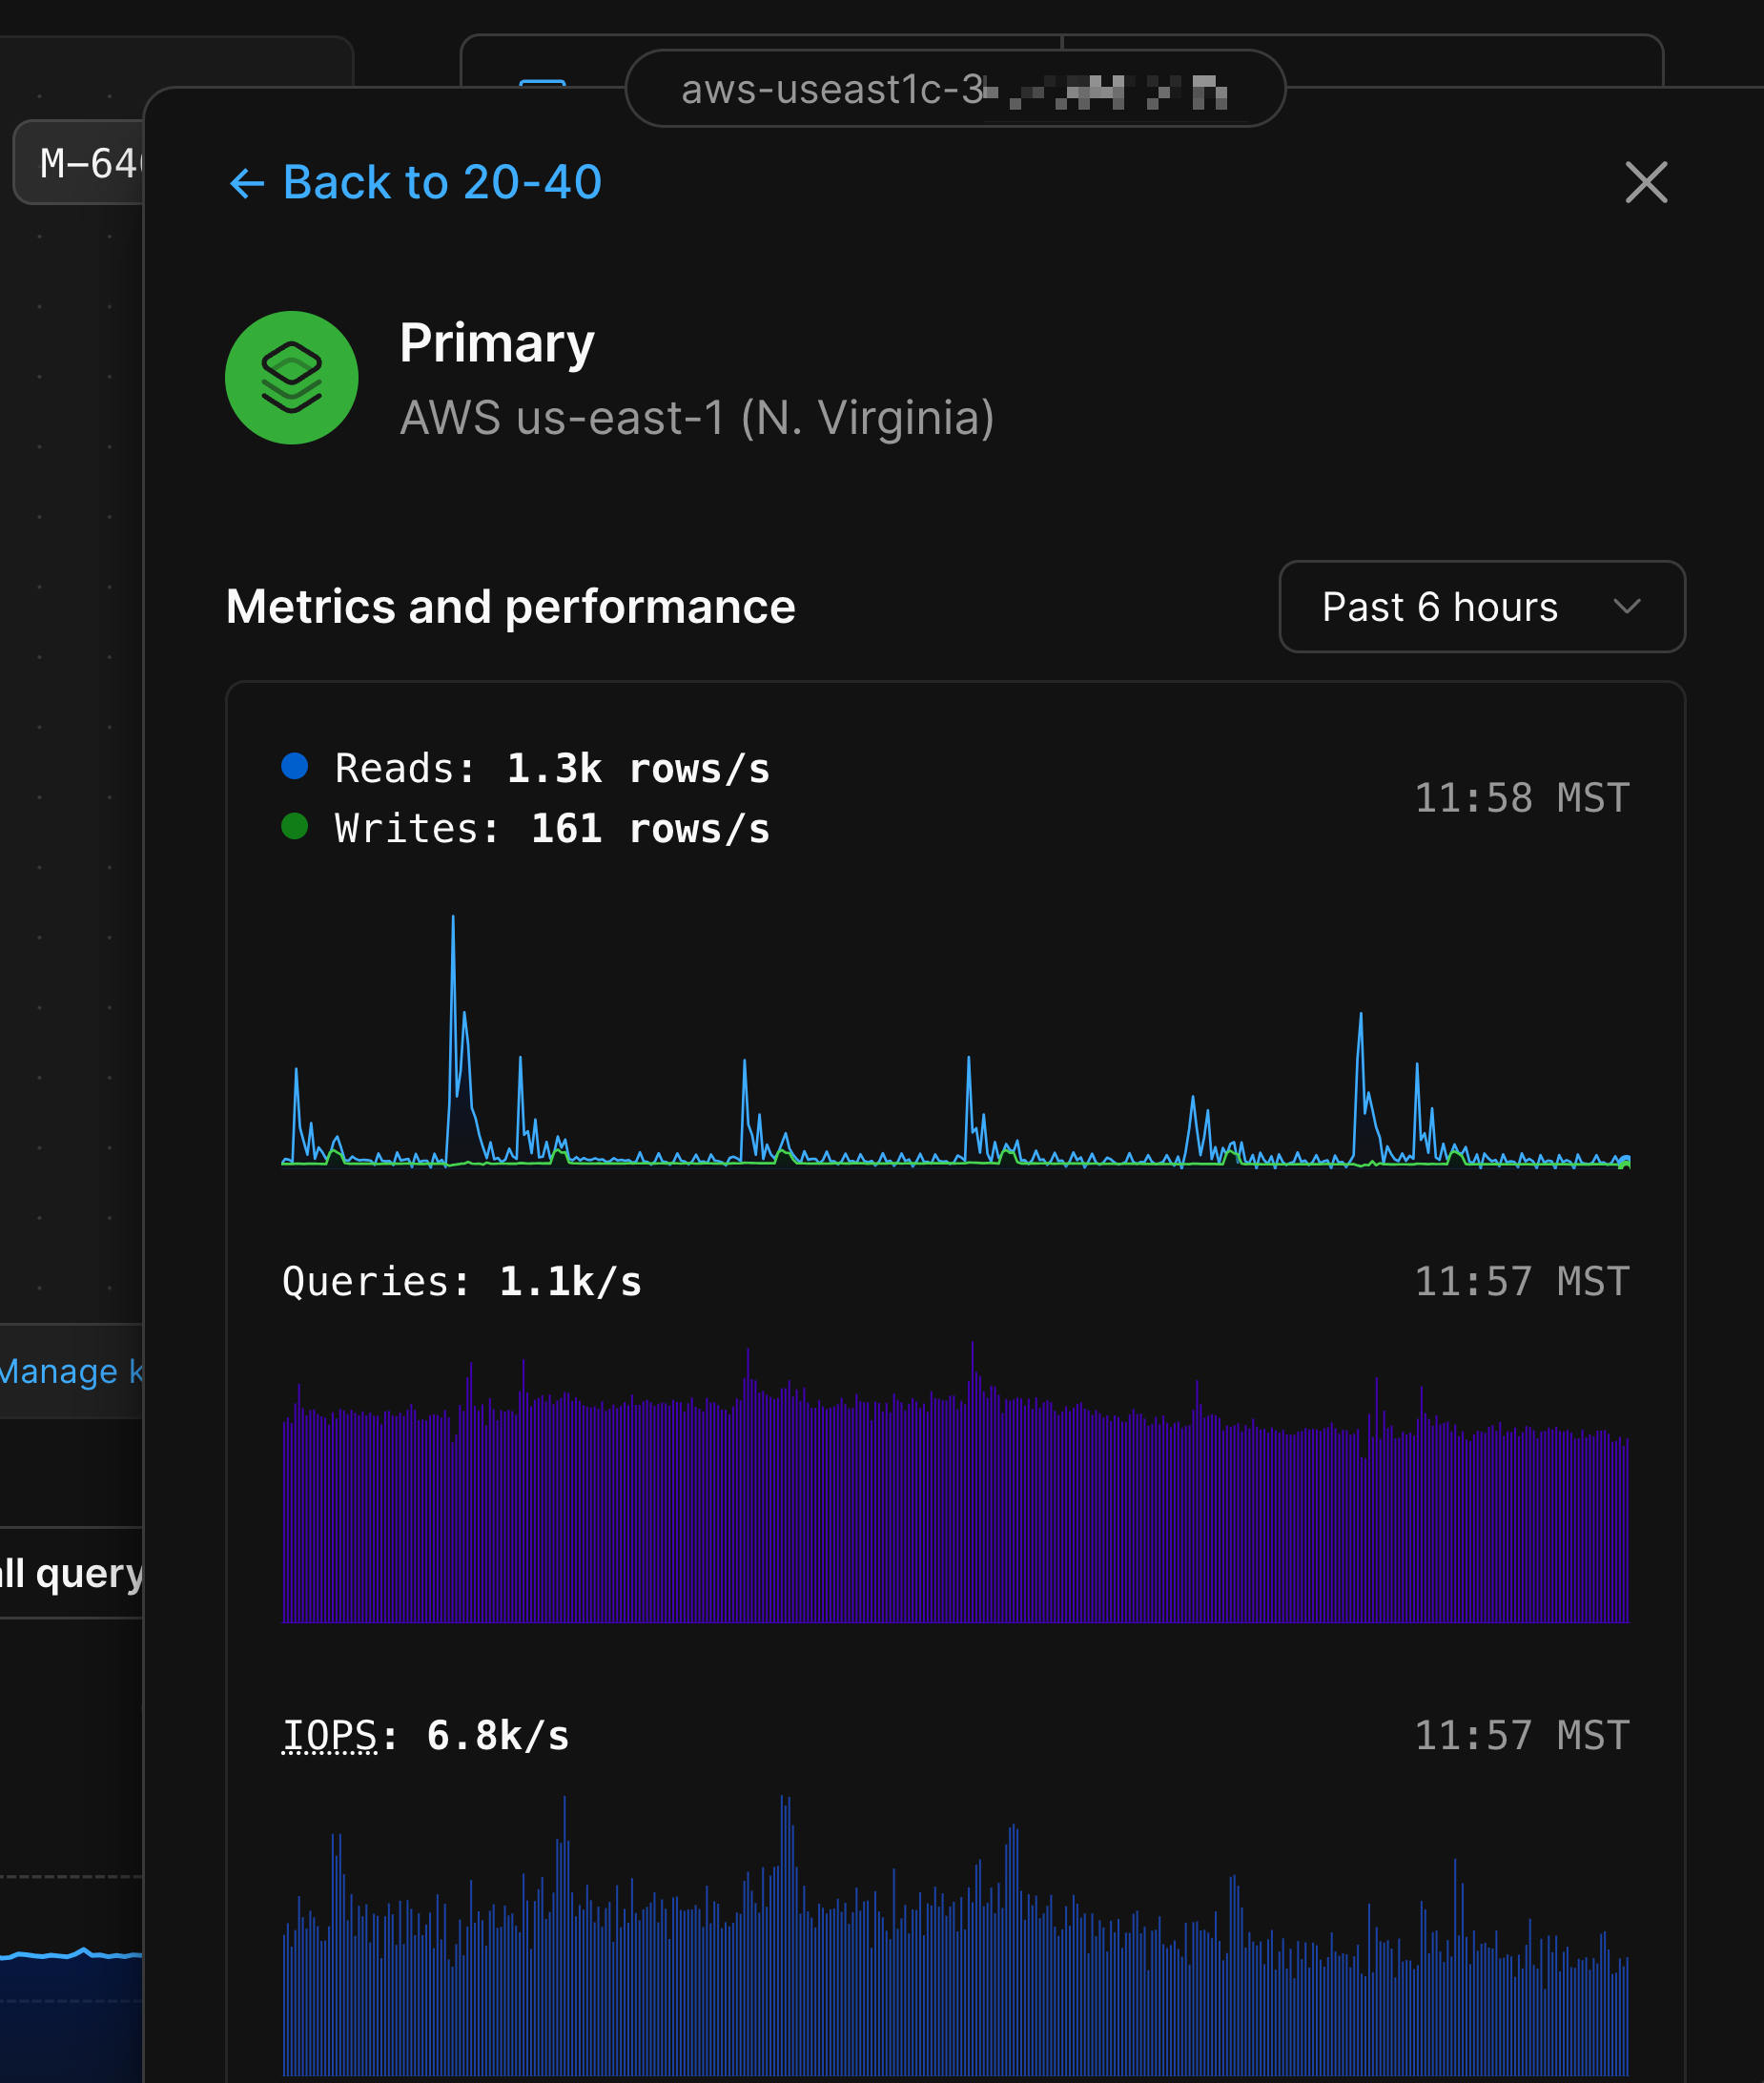
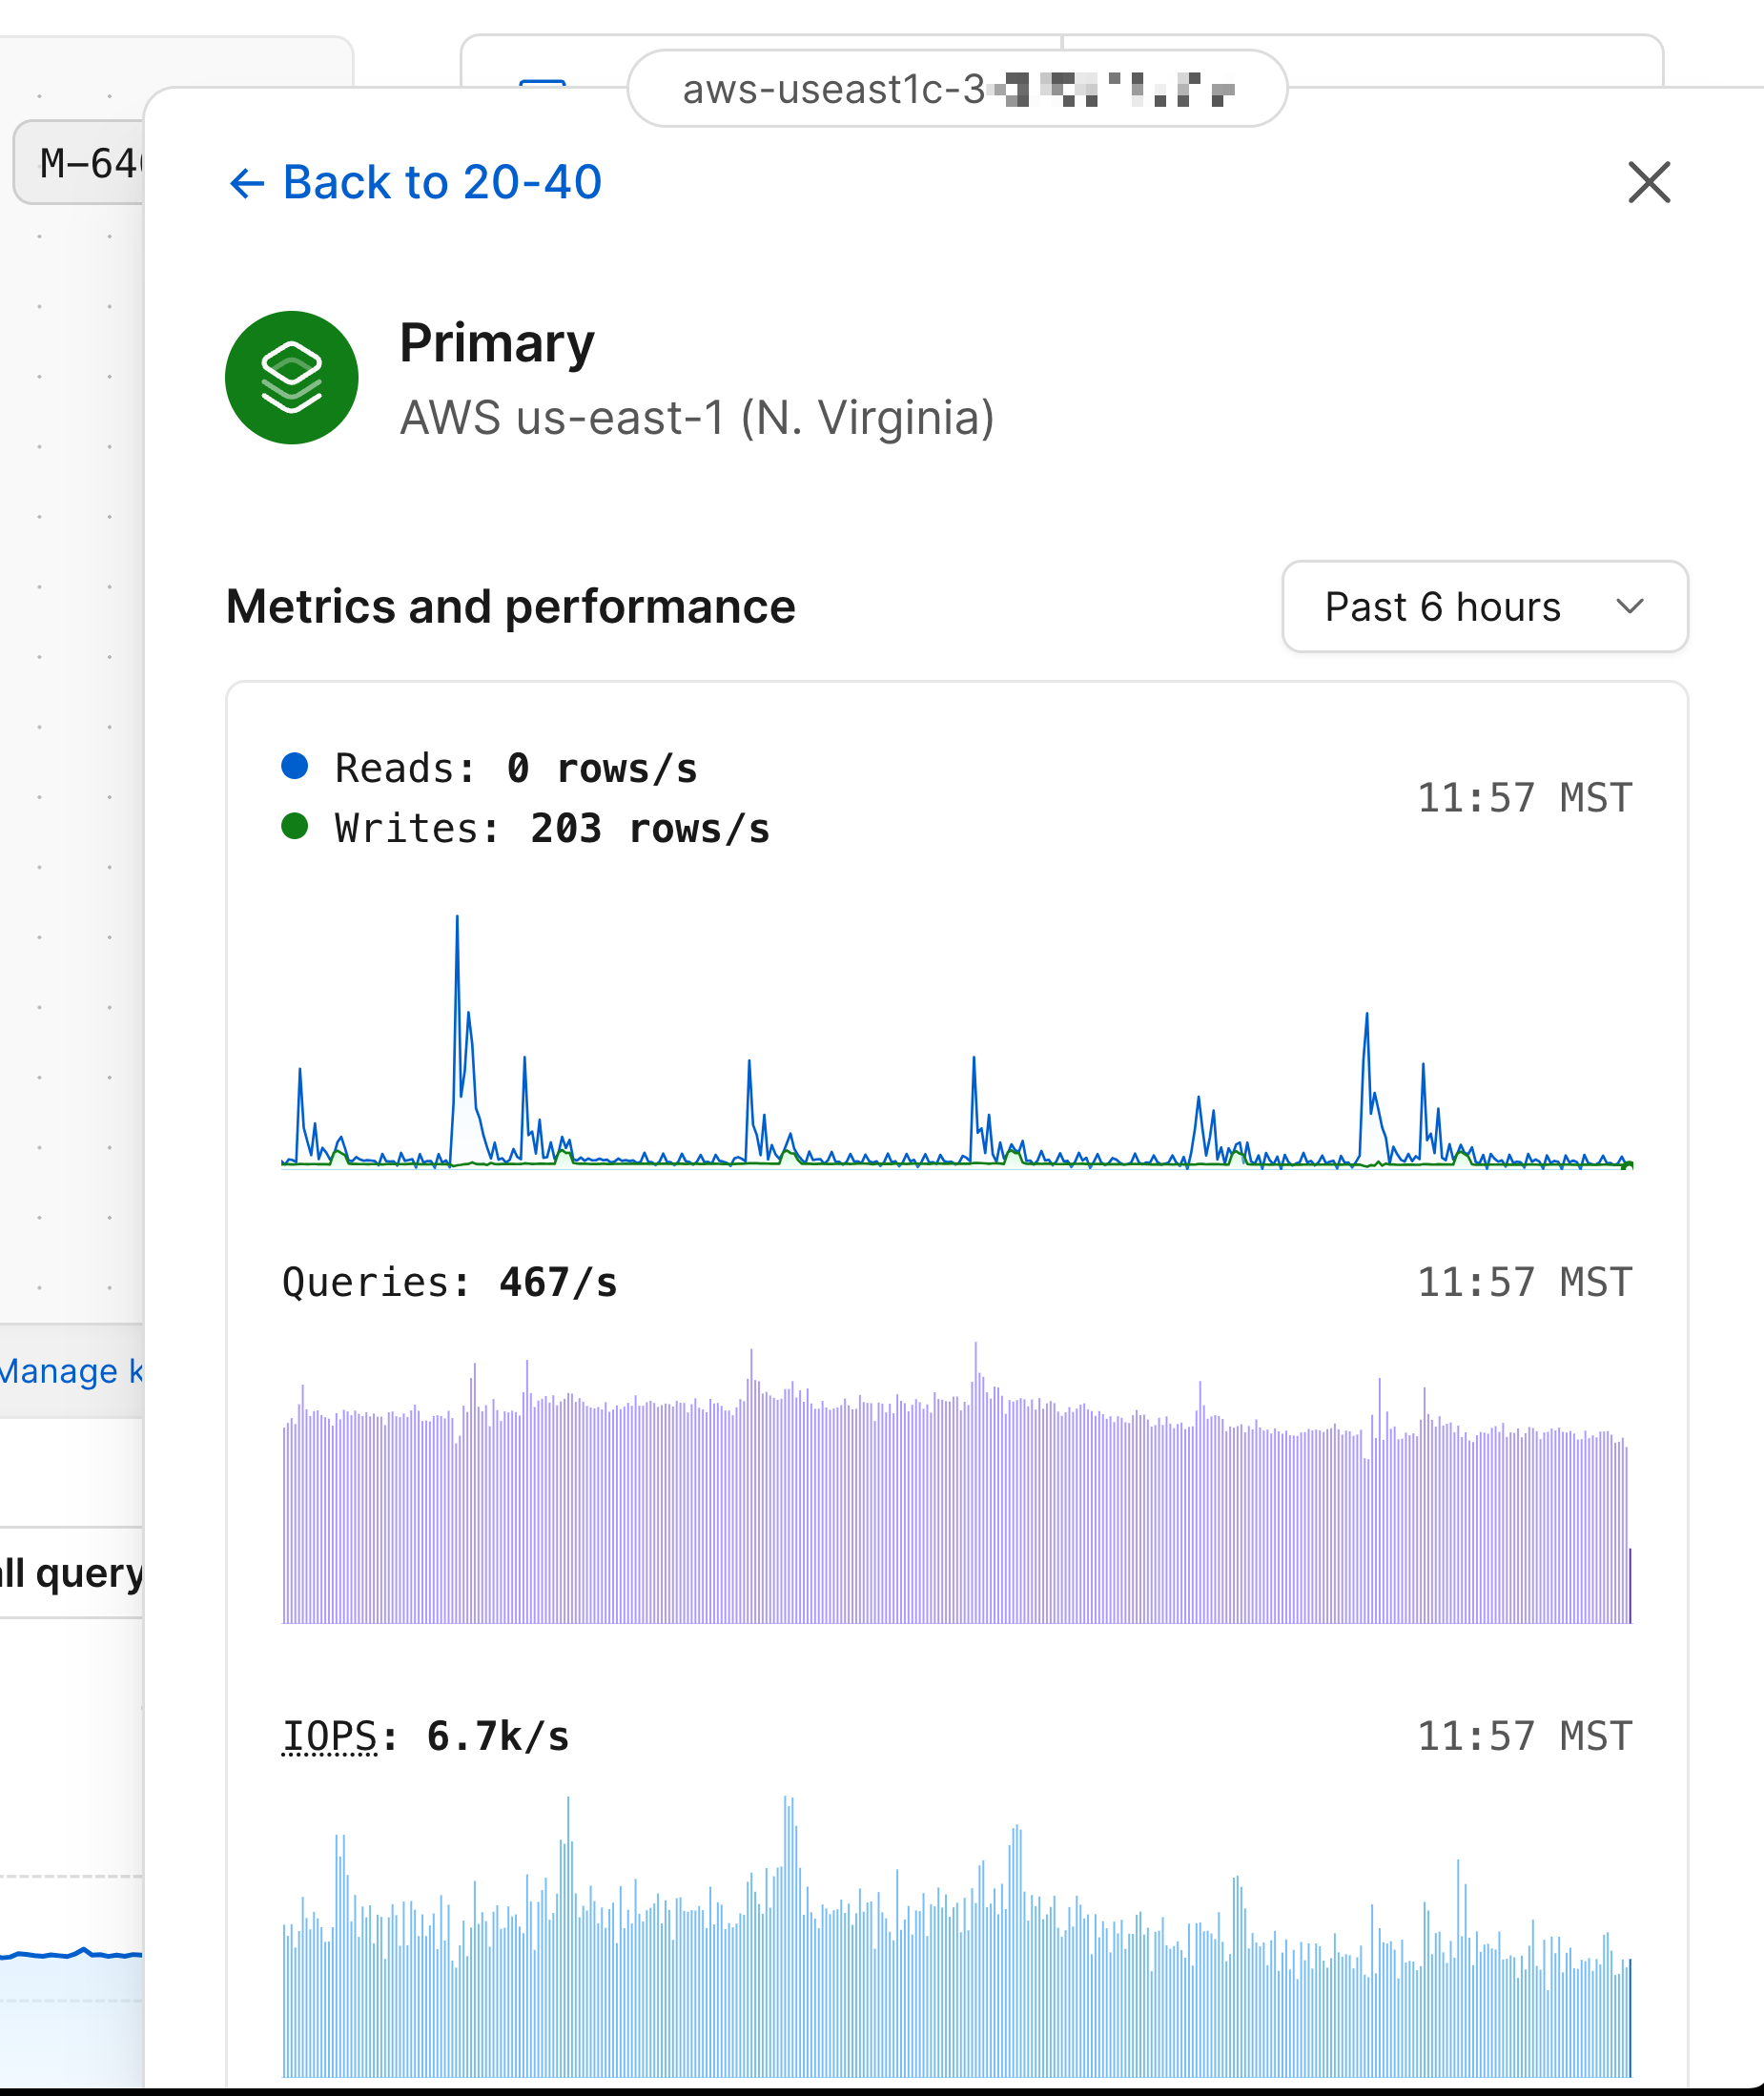
Each element within the infrastructure diagram for PlanetScale database branches can be selected to display additional metrics related to that element.
These metrics are displayed in expandable cards that present themselves when an element is selected.
By default, the cards display metrics from the last 6 hours but can be adjusted if additional data is needed.
### VTGates
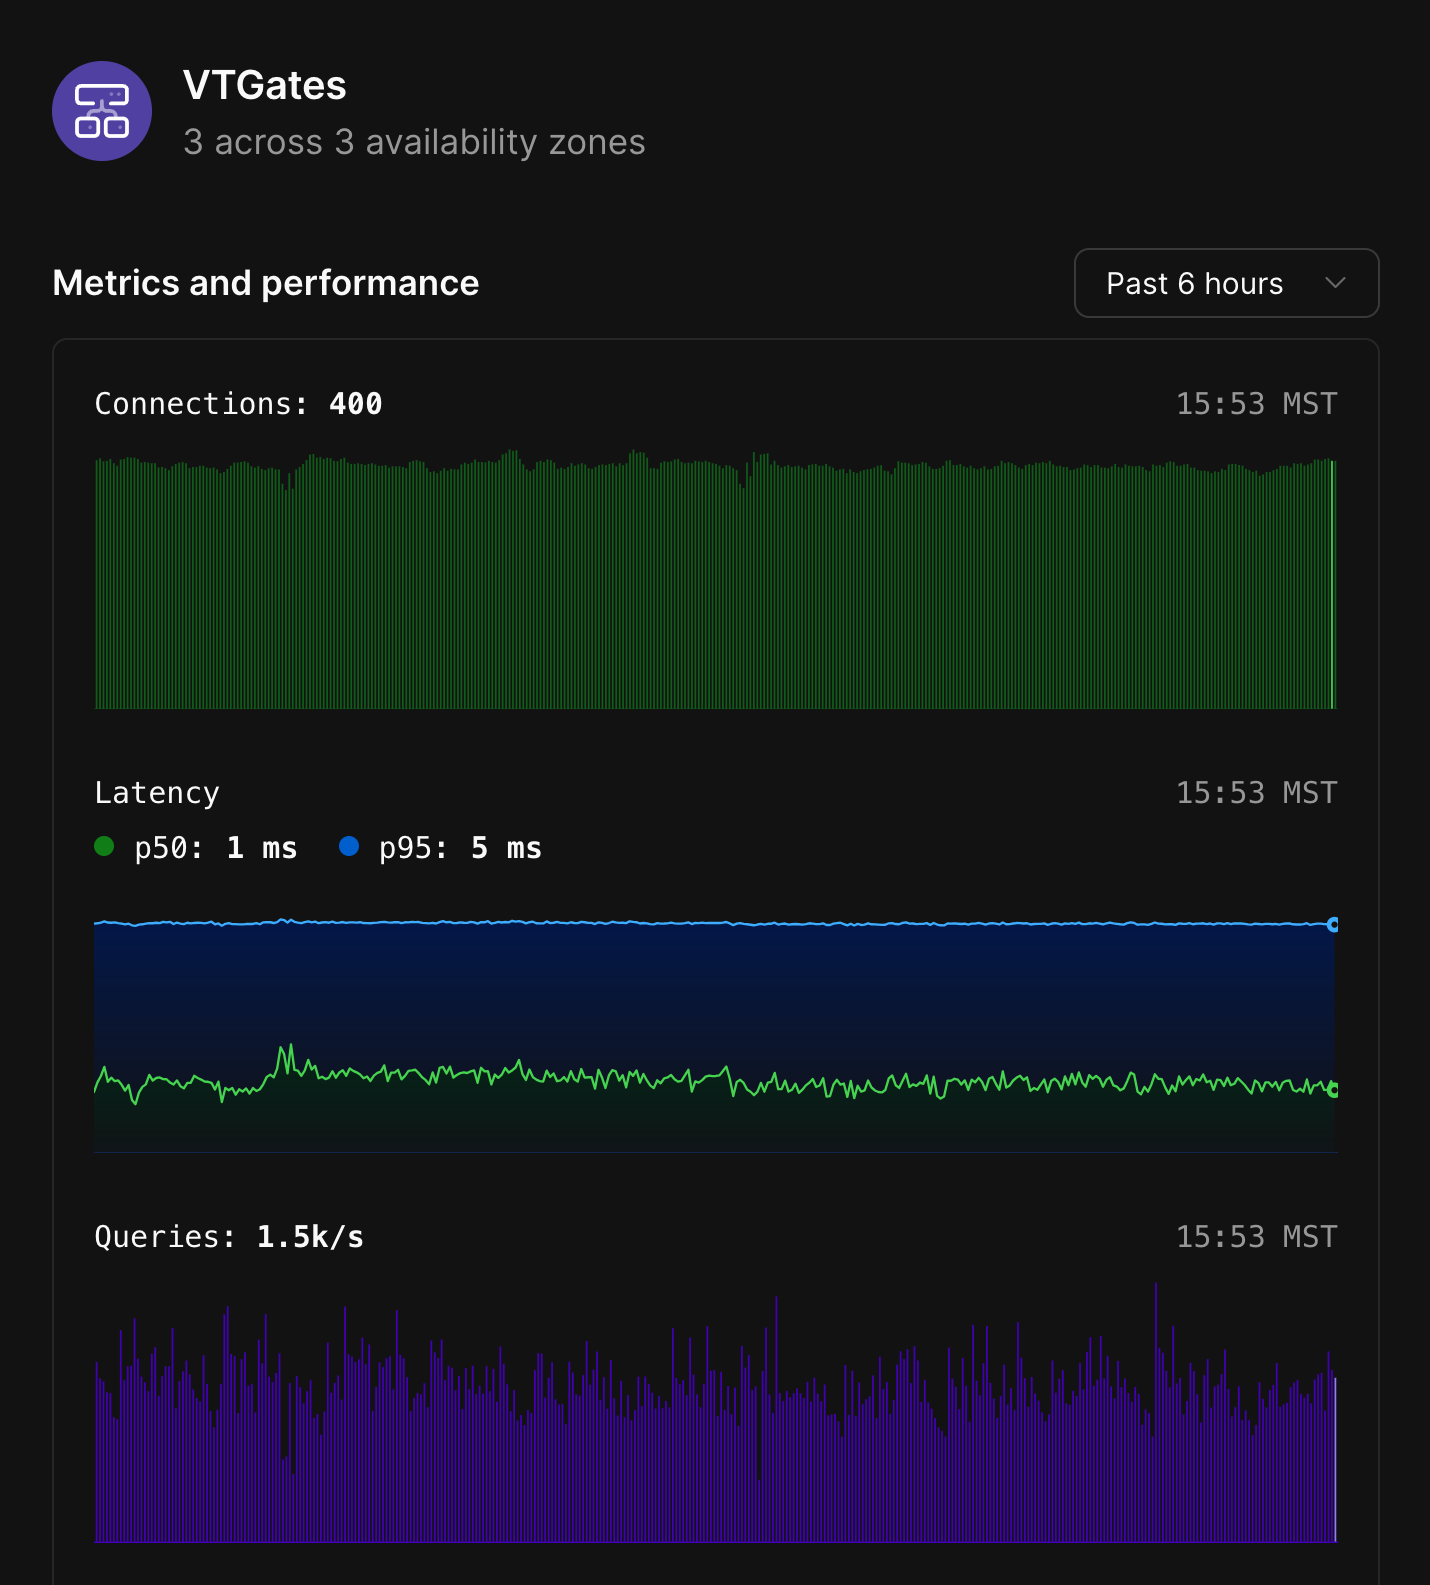
The VTGate node displays the total number of VTGates that exist for a given branch, as well as the number of availability zones in which they live.
Selecting the VTGates node will show the following metrics:
* Number of connections.
* Latency.
* Queries received.
* CPU.
* Memory consumption.
The read-only replicas can be identified by the blue globe icon.
## Infrastructure metrics
Each element within the infrastructure diagram for PlanetScale database branches can be selected to display additional metrics related to that element.
These metrics are displayed in expandable cards that present themselves when an element is selected.
By default, the cards display metrics from the last 6 hours but can be adjusted if additional data is needed.
### VTGates
The VTGate node displays the total number of VTGates that exist for a given branch, as well as the number of availability zones in which they live.
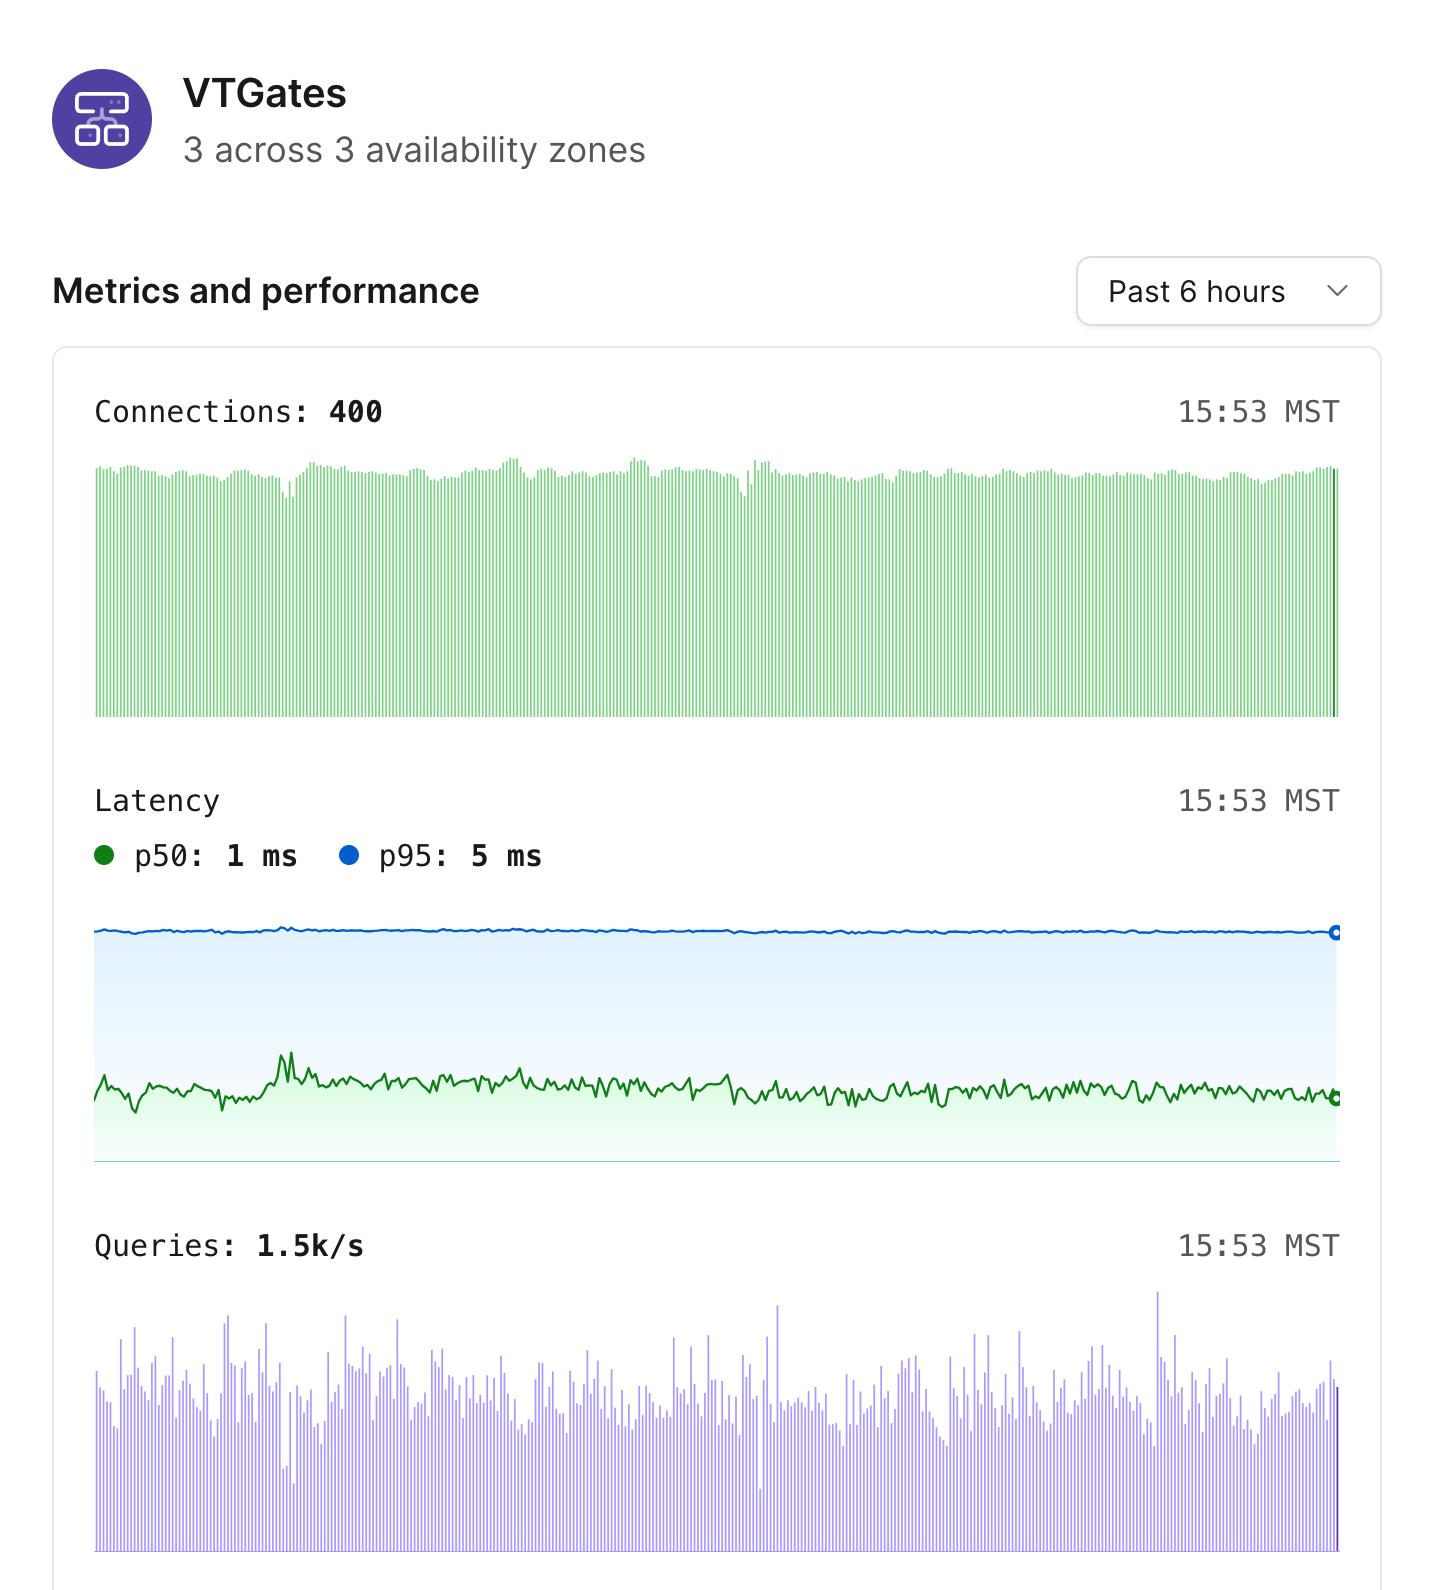
Selecting the VTGates node will show the following metrics:
* Number of connections.
* Latency.
* Queries received.
* CPU.
* Memory consumption.
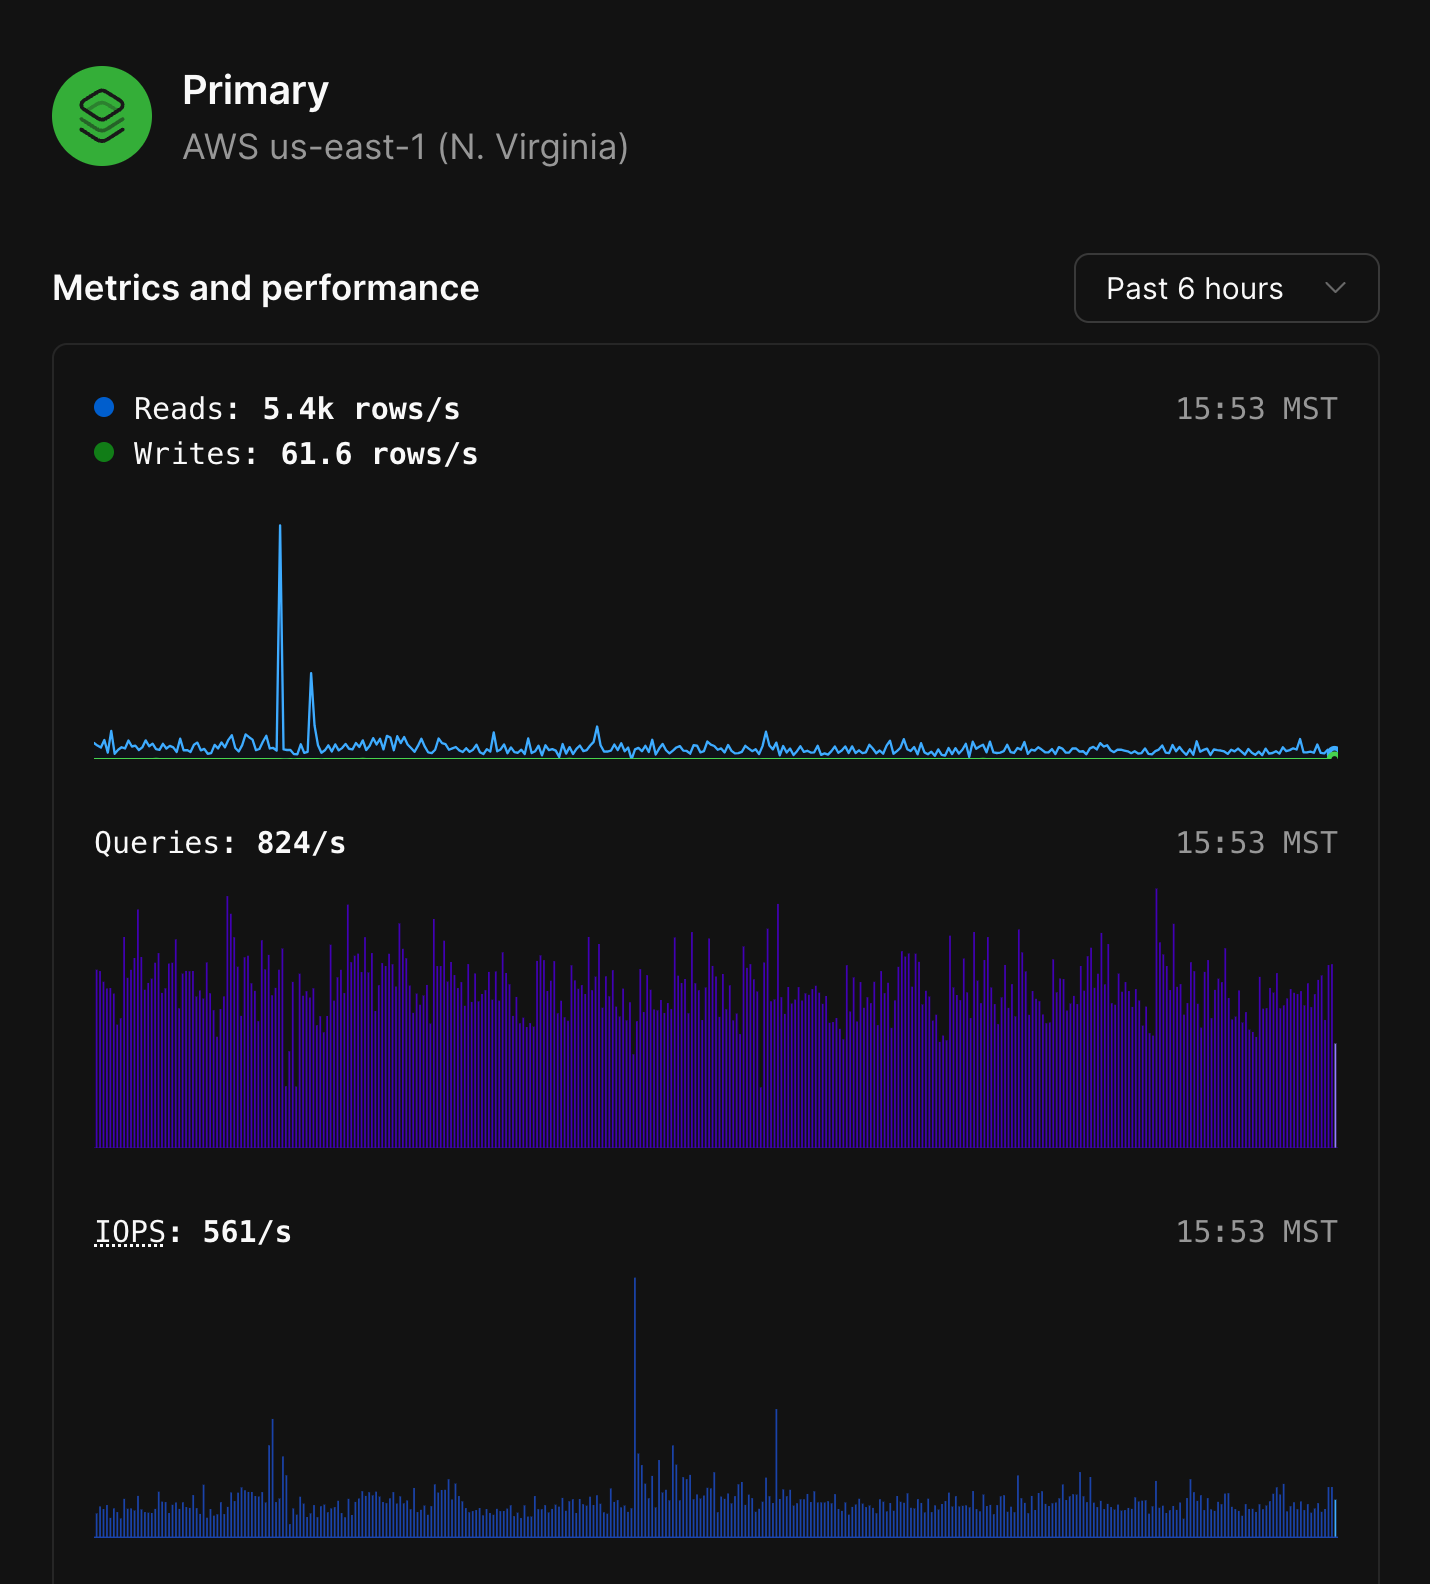
 ### MySQL nodes
Each MySQL node in the diagram will display whether it is the primary node or a replica, along with the region where that node is deployed to.
Clicking any of the MySQL nodes will display the following metrics:
* Database reads and writes for that node.
* Queries served.
* IOPS.
* CPU and Memory utilization.
* Storage utilization over the past week.
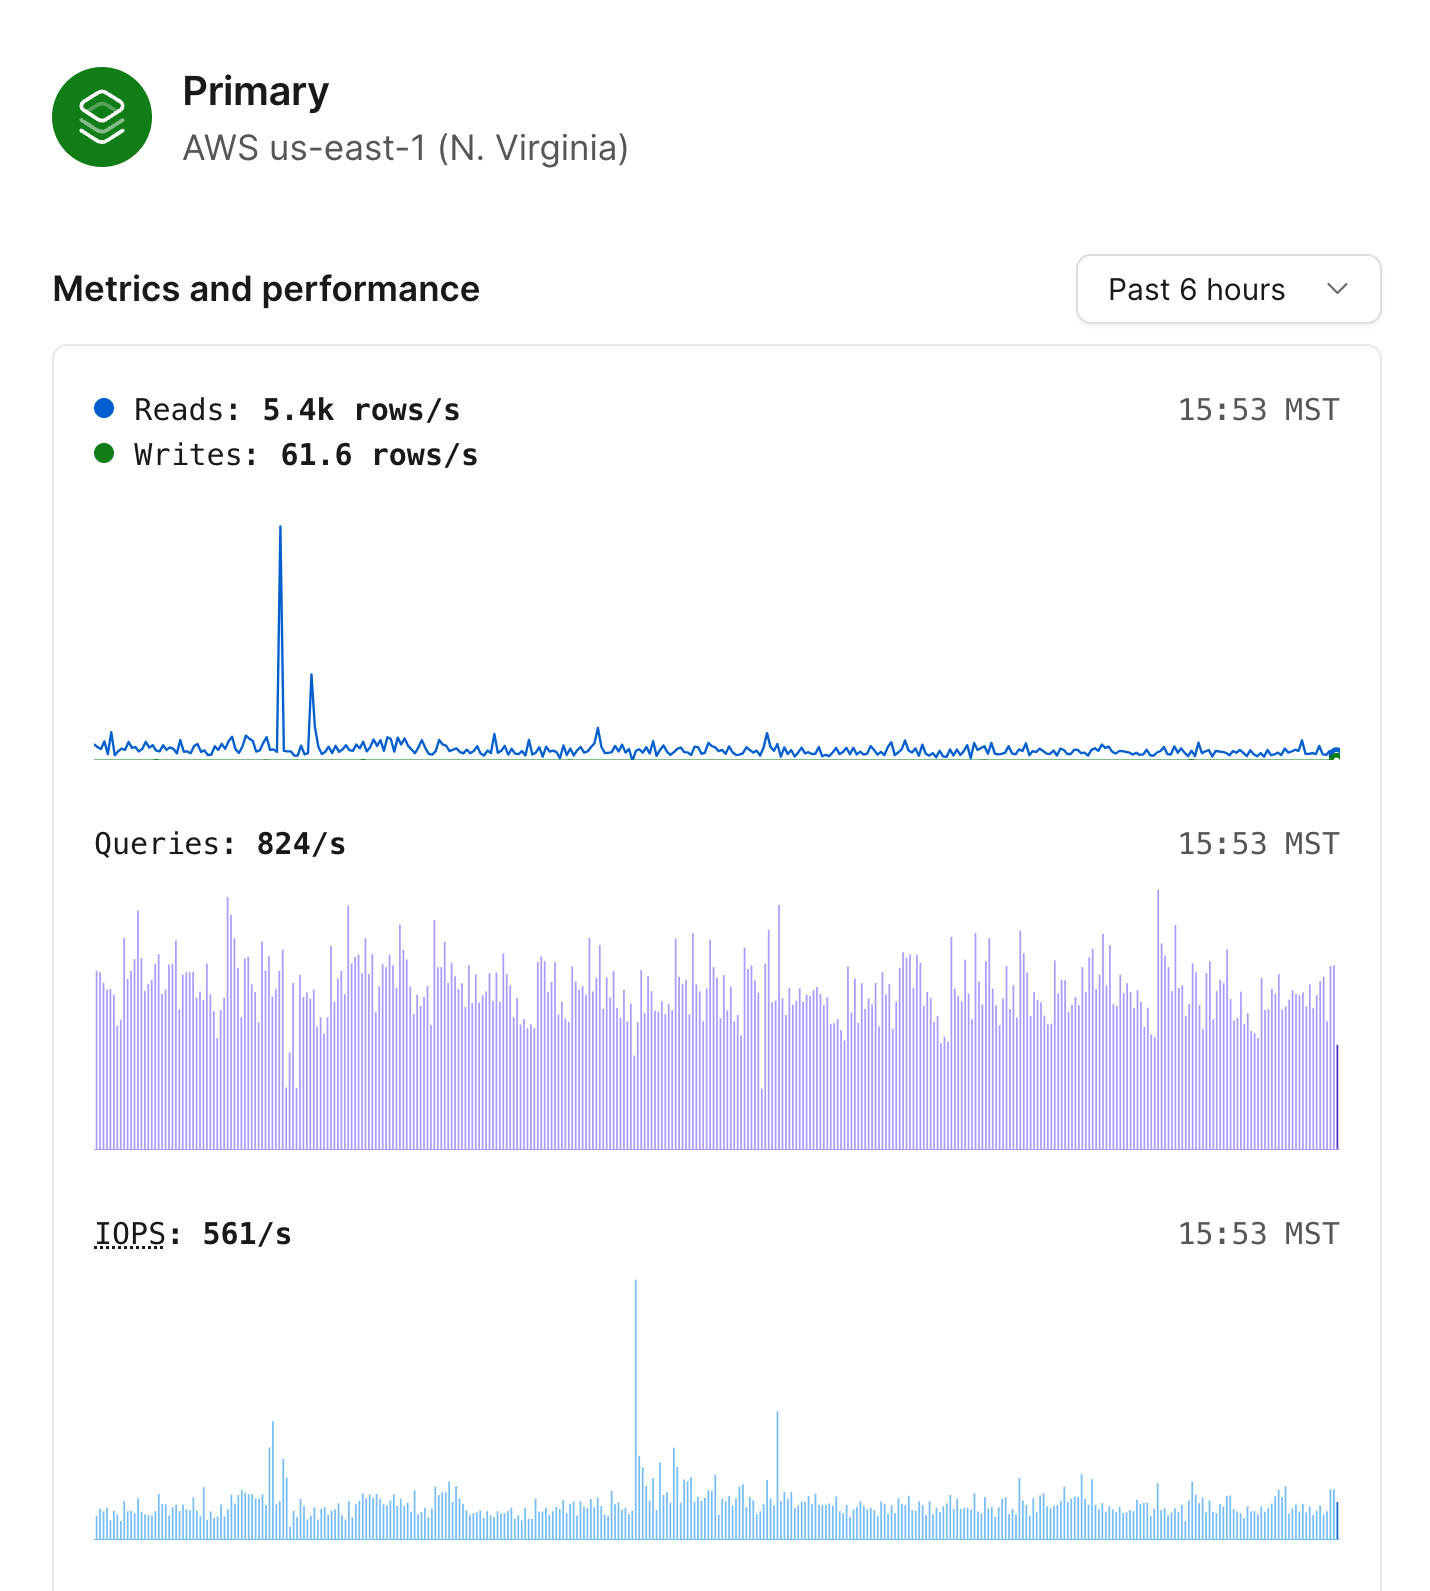
### MySQL nodes
Each MySQL node in the diagram will display whether it is the primary node or a replica, along with the region where that node is deployed to.
Clicking any of the MySQL nodes will display the following metrics:
* Database reads and writes for that node.
* Queries served.
* IOPS.
* CPU and Memory utilization.
* Storage utilization over the past week.
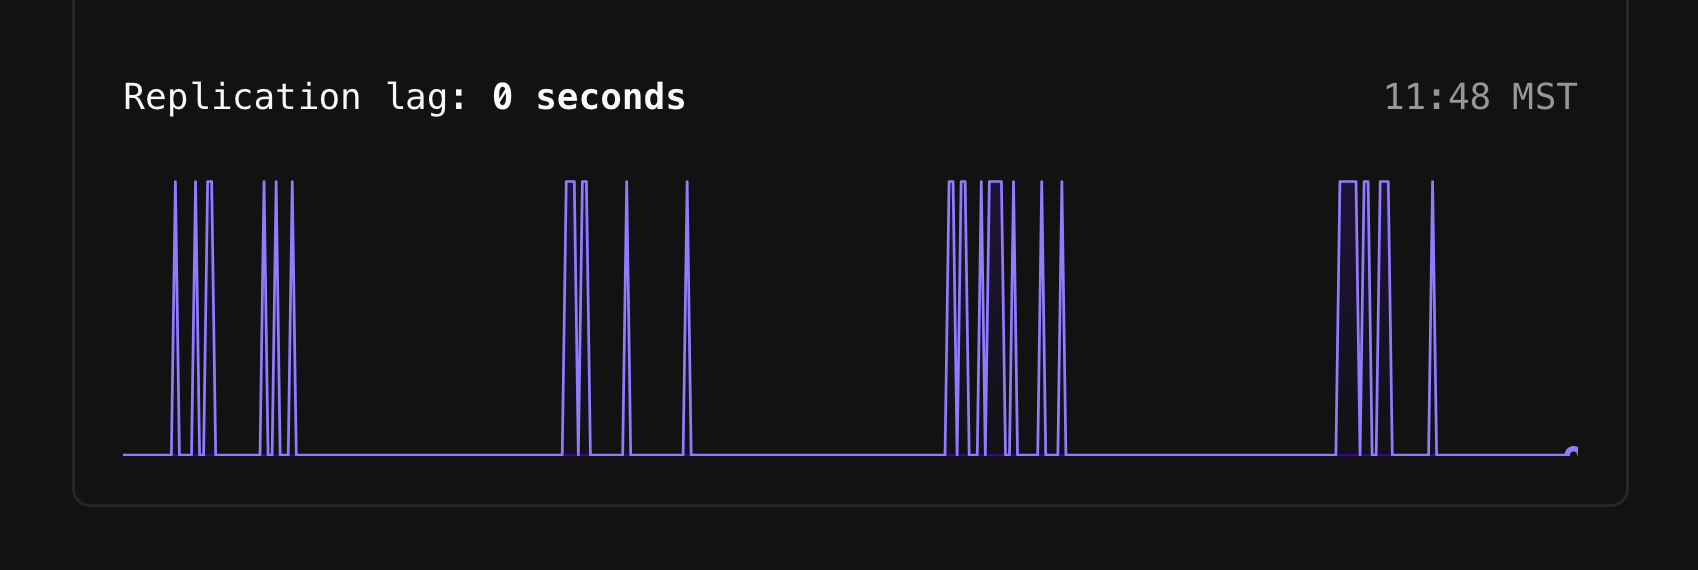
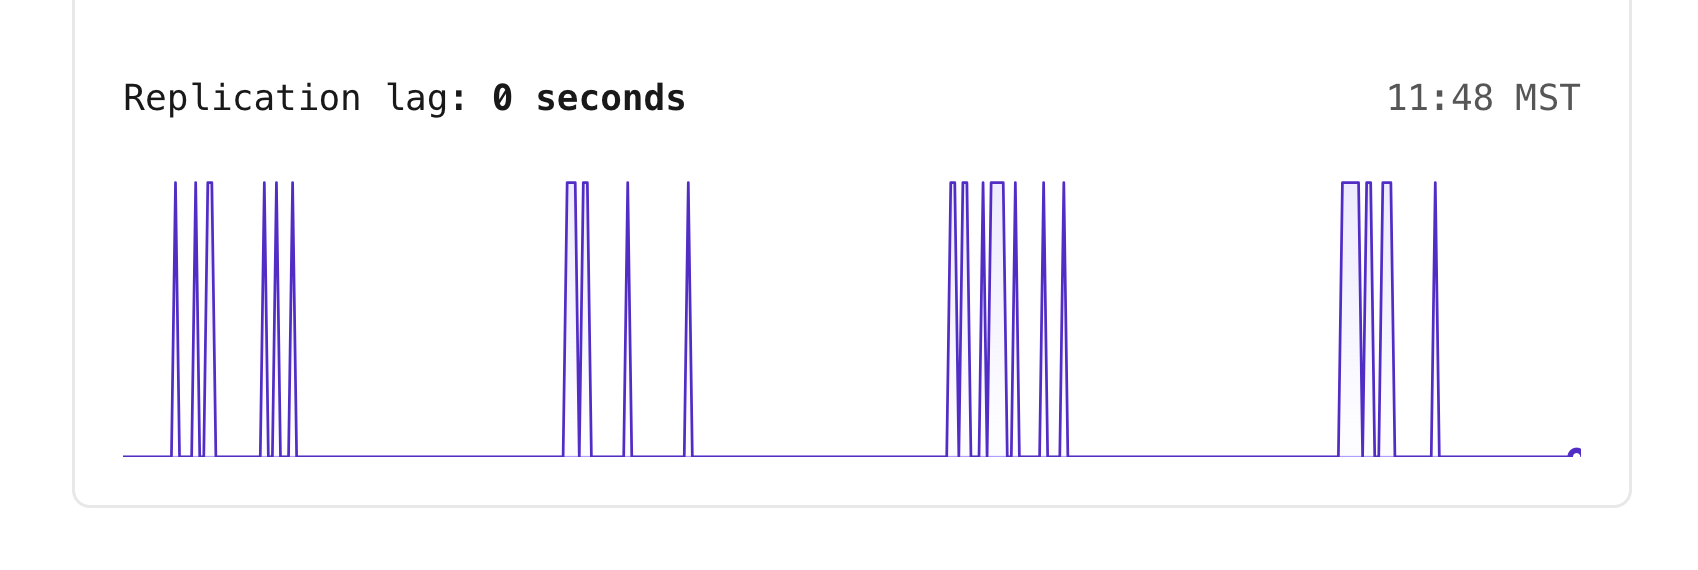
 Selecting a replica will display the replication lag in addition to the other metrics.
 ### Replication lag at a glance
Within the infrastructure diagram, you'll also notice that there is a number near the connection points for each replica.
These numbers are a way to read the replication lag between the Primary node and that given node at a glance.
### Replication lag at a glance
Within the infrastructure diagram, you'll also notice that there is a number near the connection points for each replica.
These numbers are a way to read the replication lag between the Primary node and that given node at a glance.
 ### Database shards
If your database is [sharded](/vitess/sharding), the infrastructure diagram will represent that as a green stack of shards.
### Database shards
If your database is [sharded](/vitess/sharding), the infrastructure diagram will represent that as a green stack of shards.
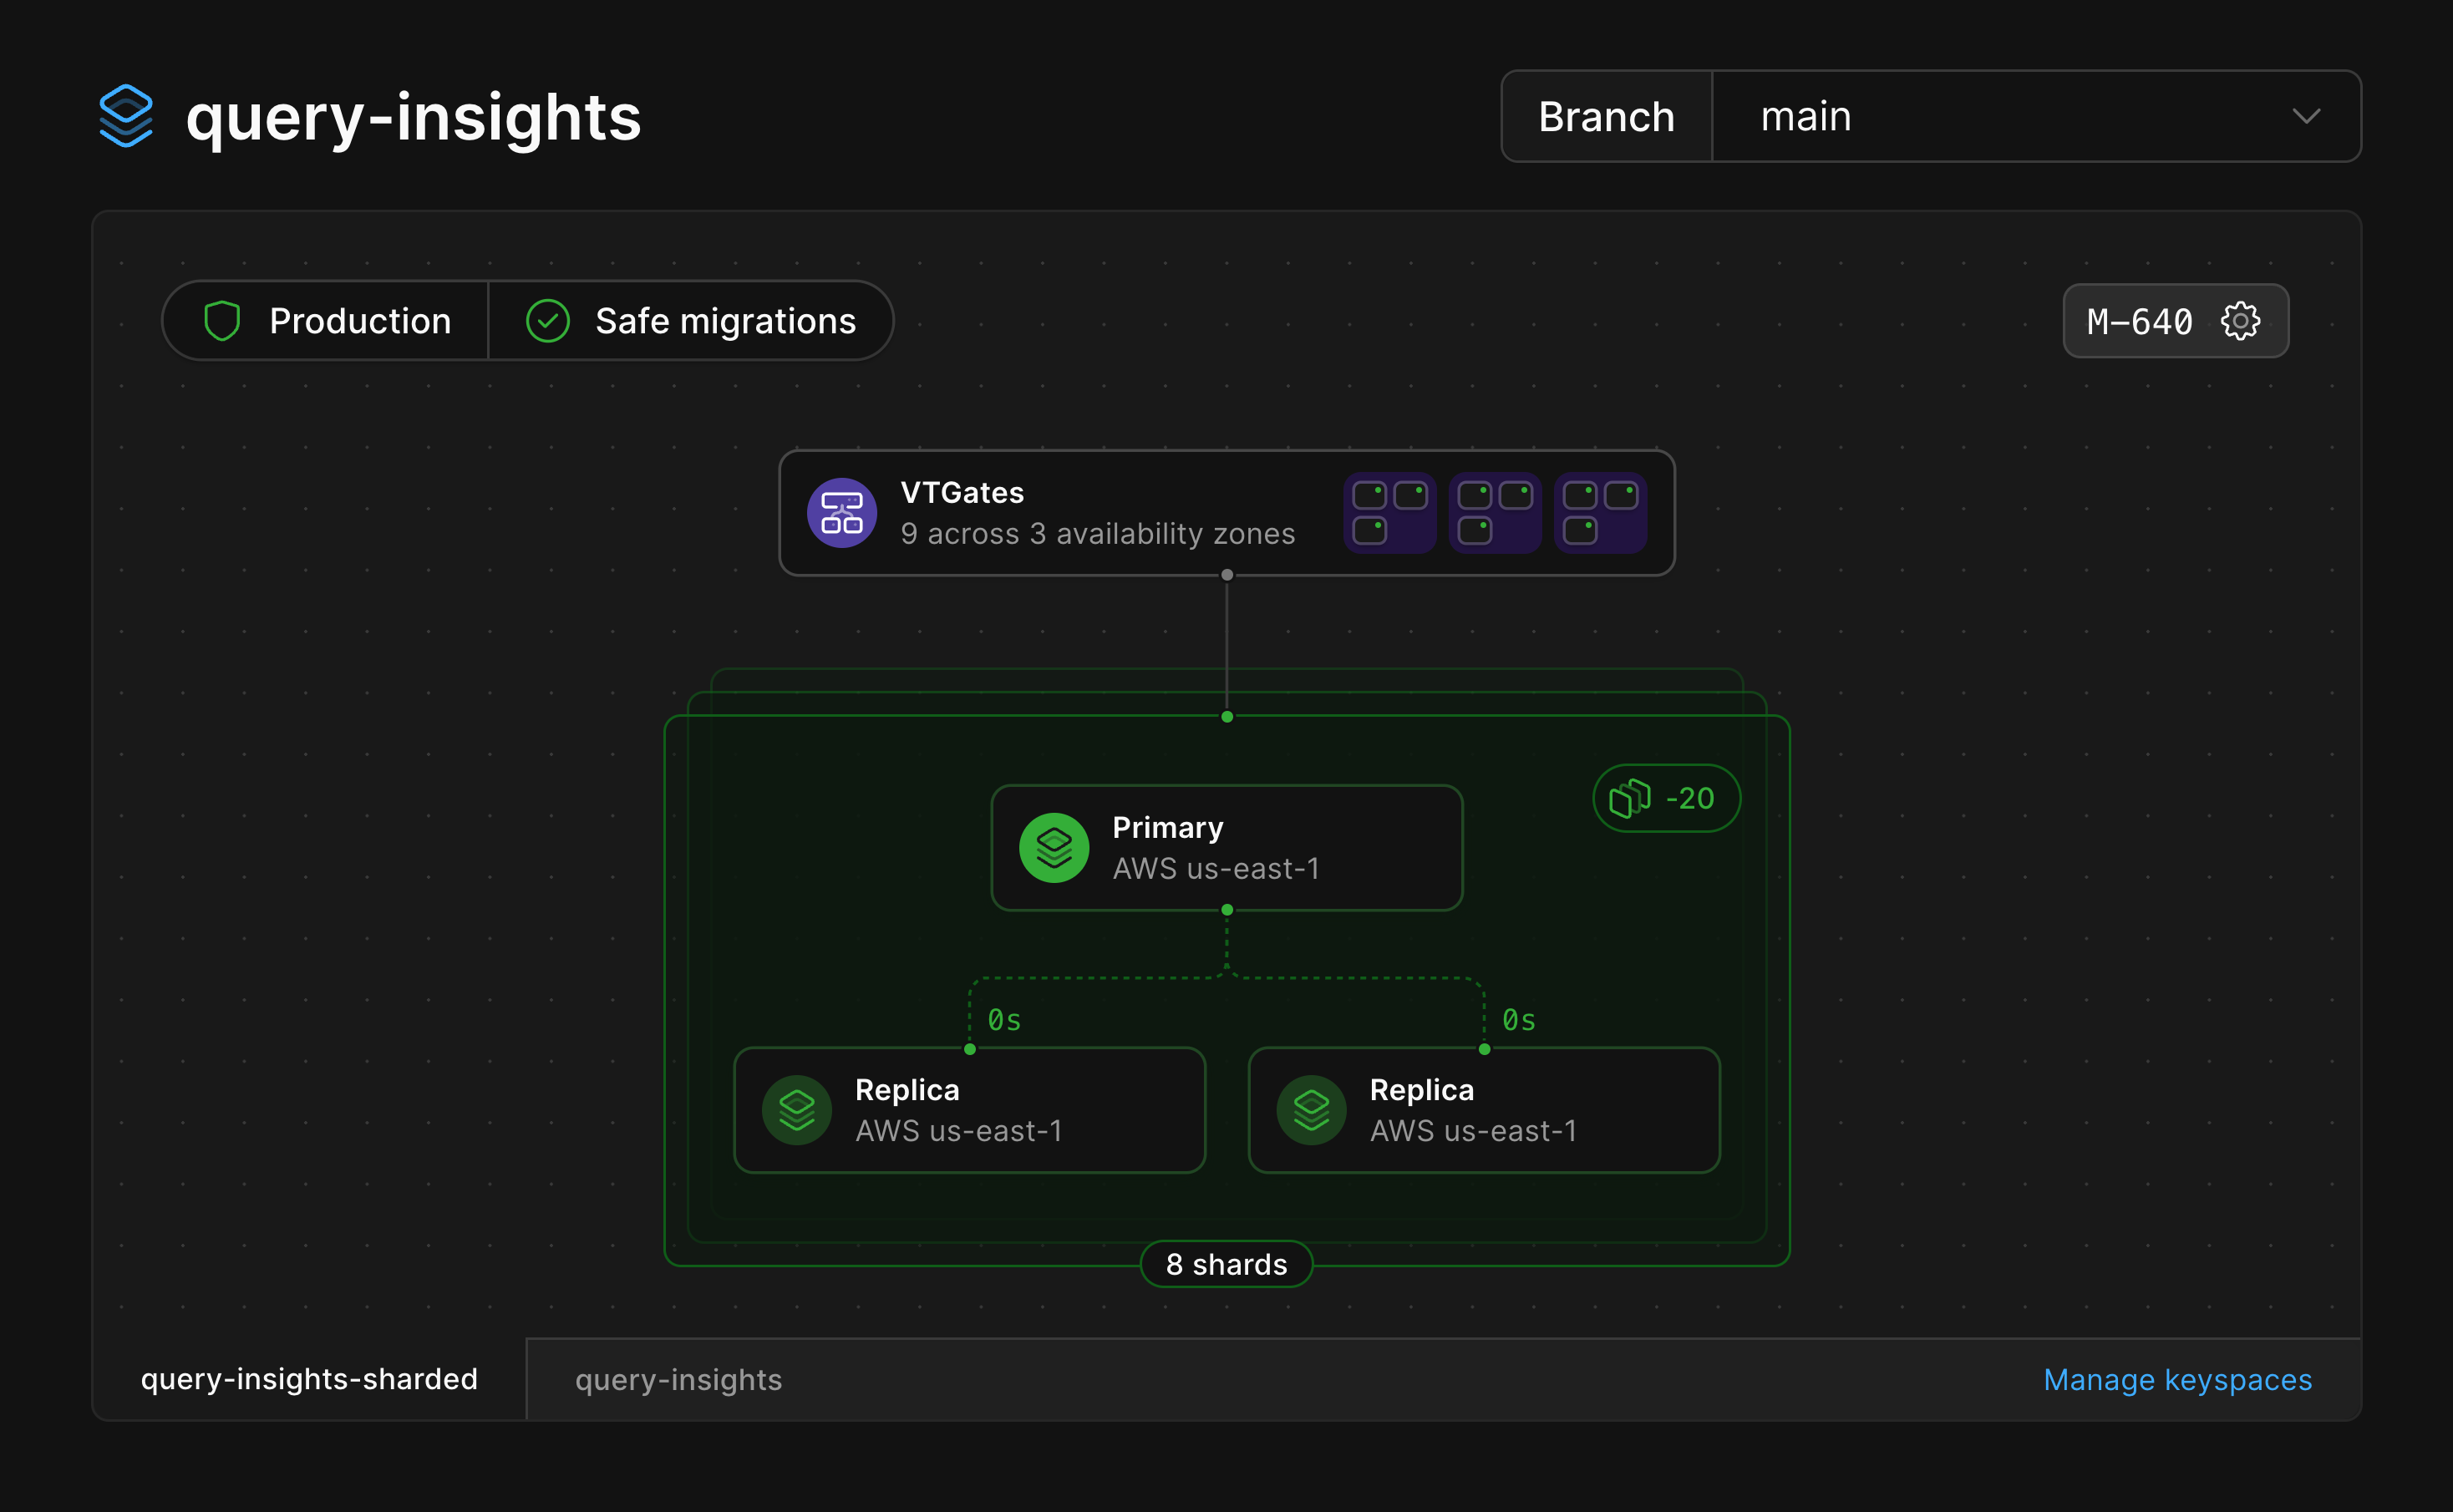
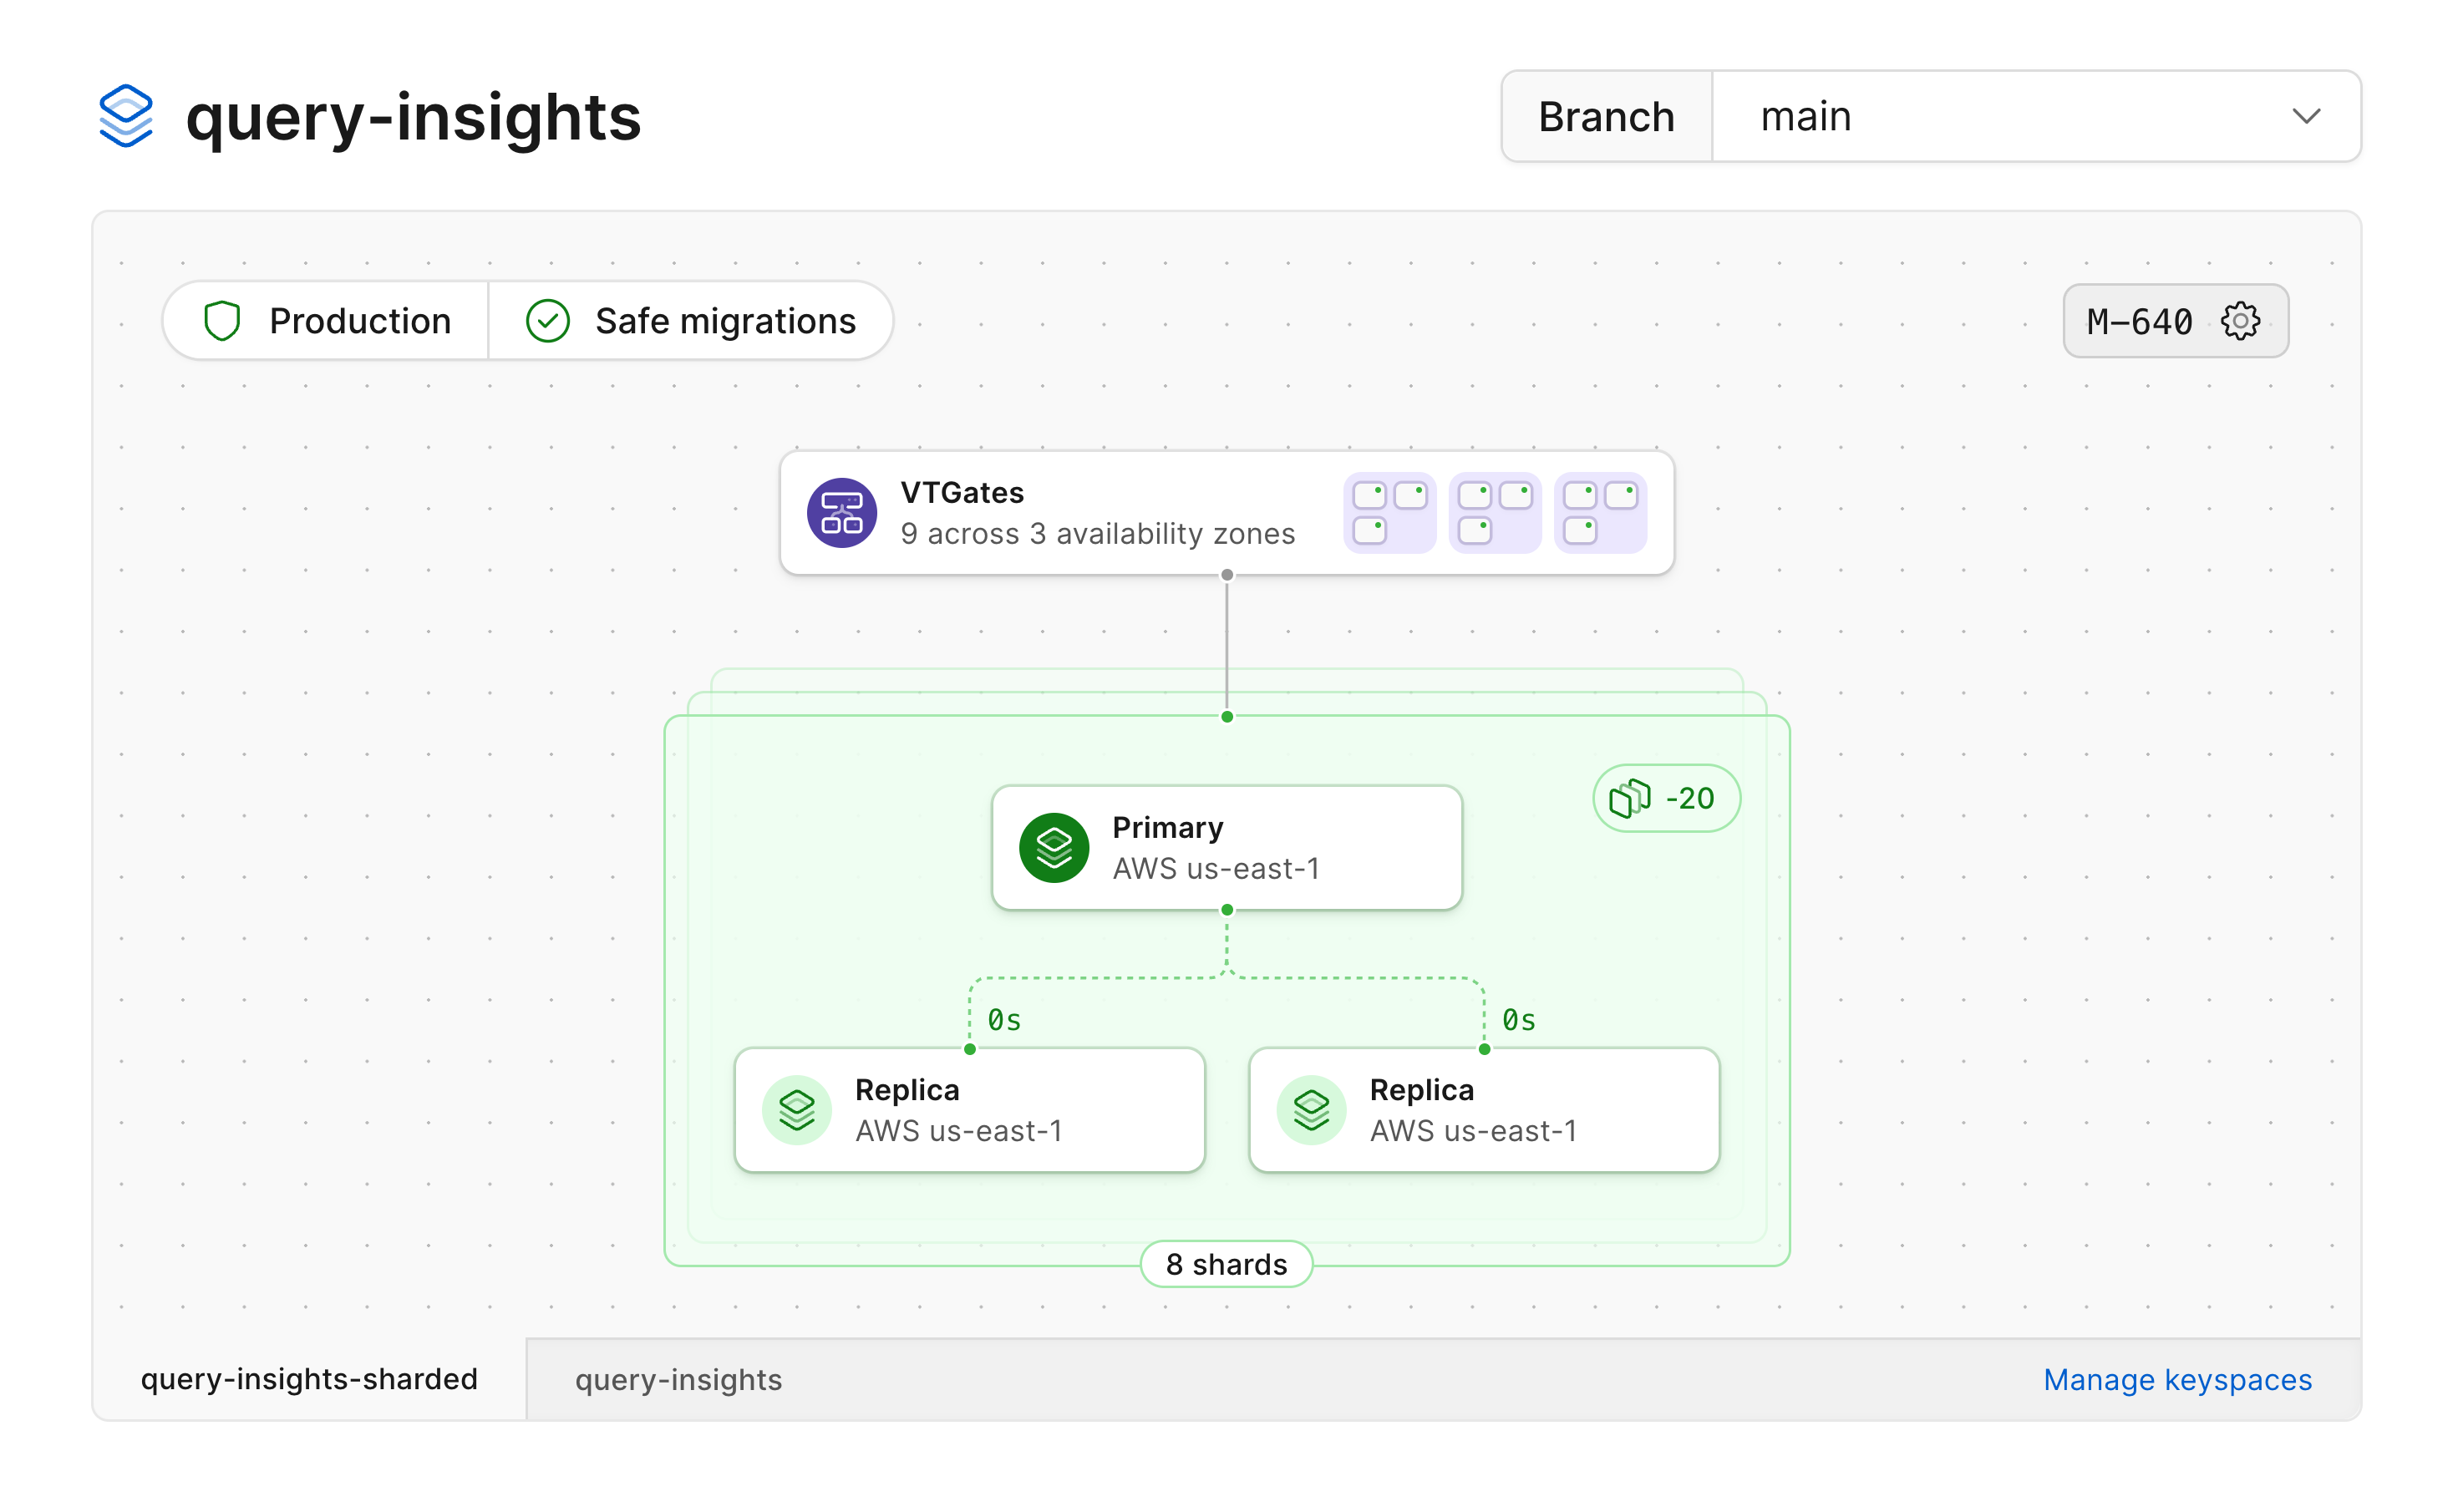 Selecting the stack from the diagram will open a card displaying all of the shards belonging to that keyspace.
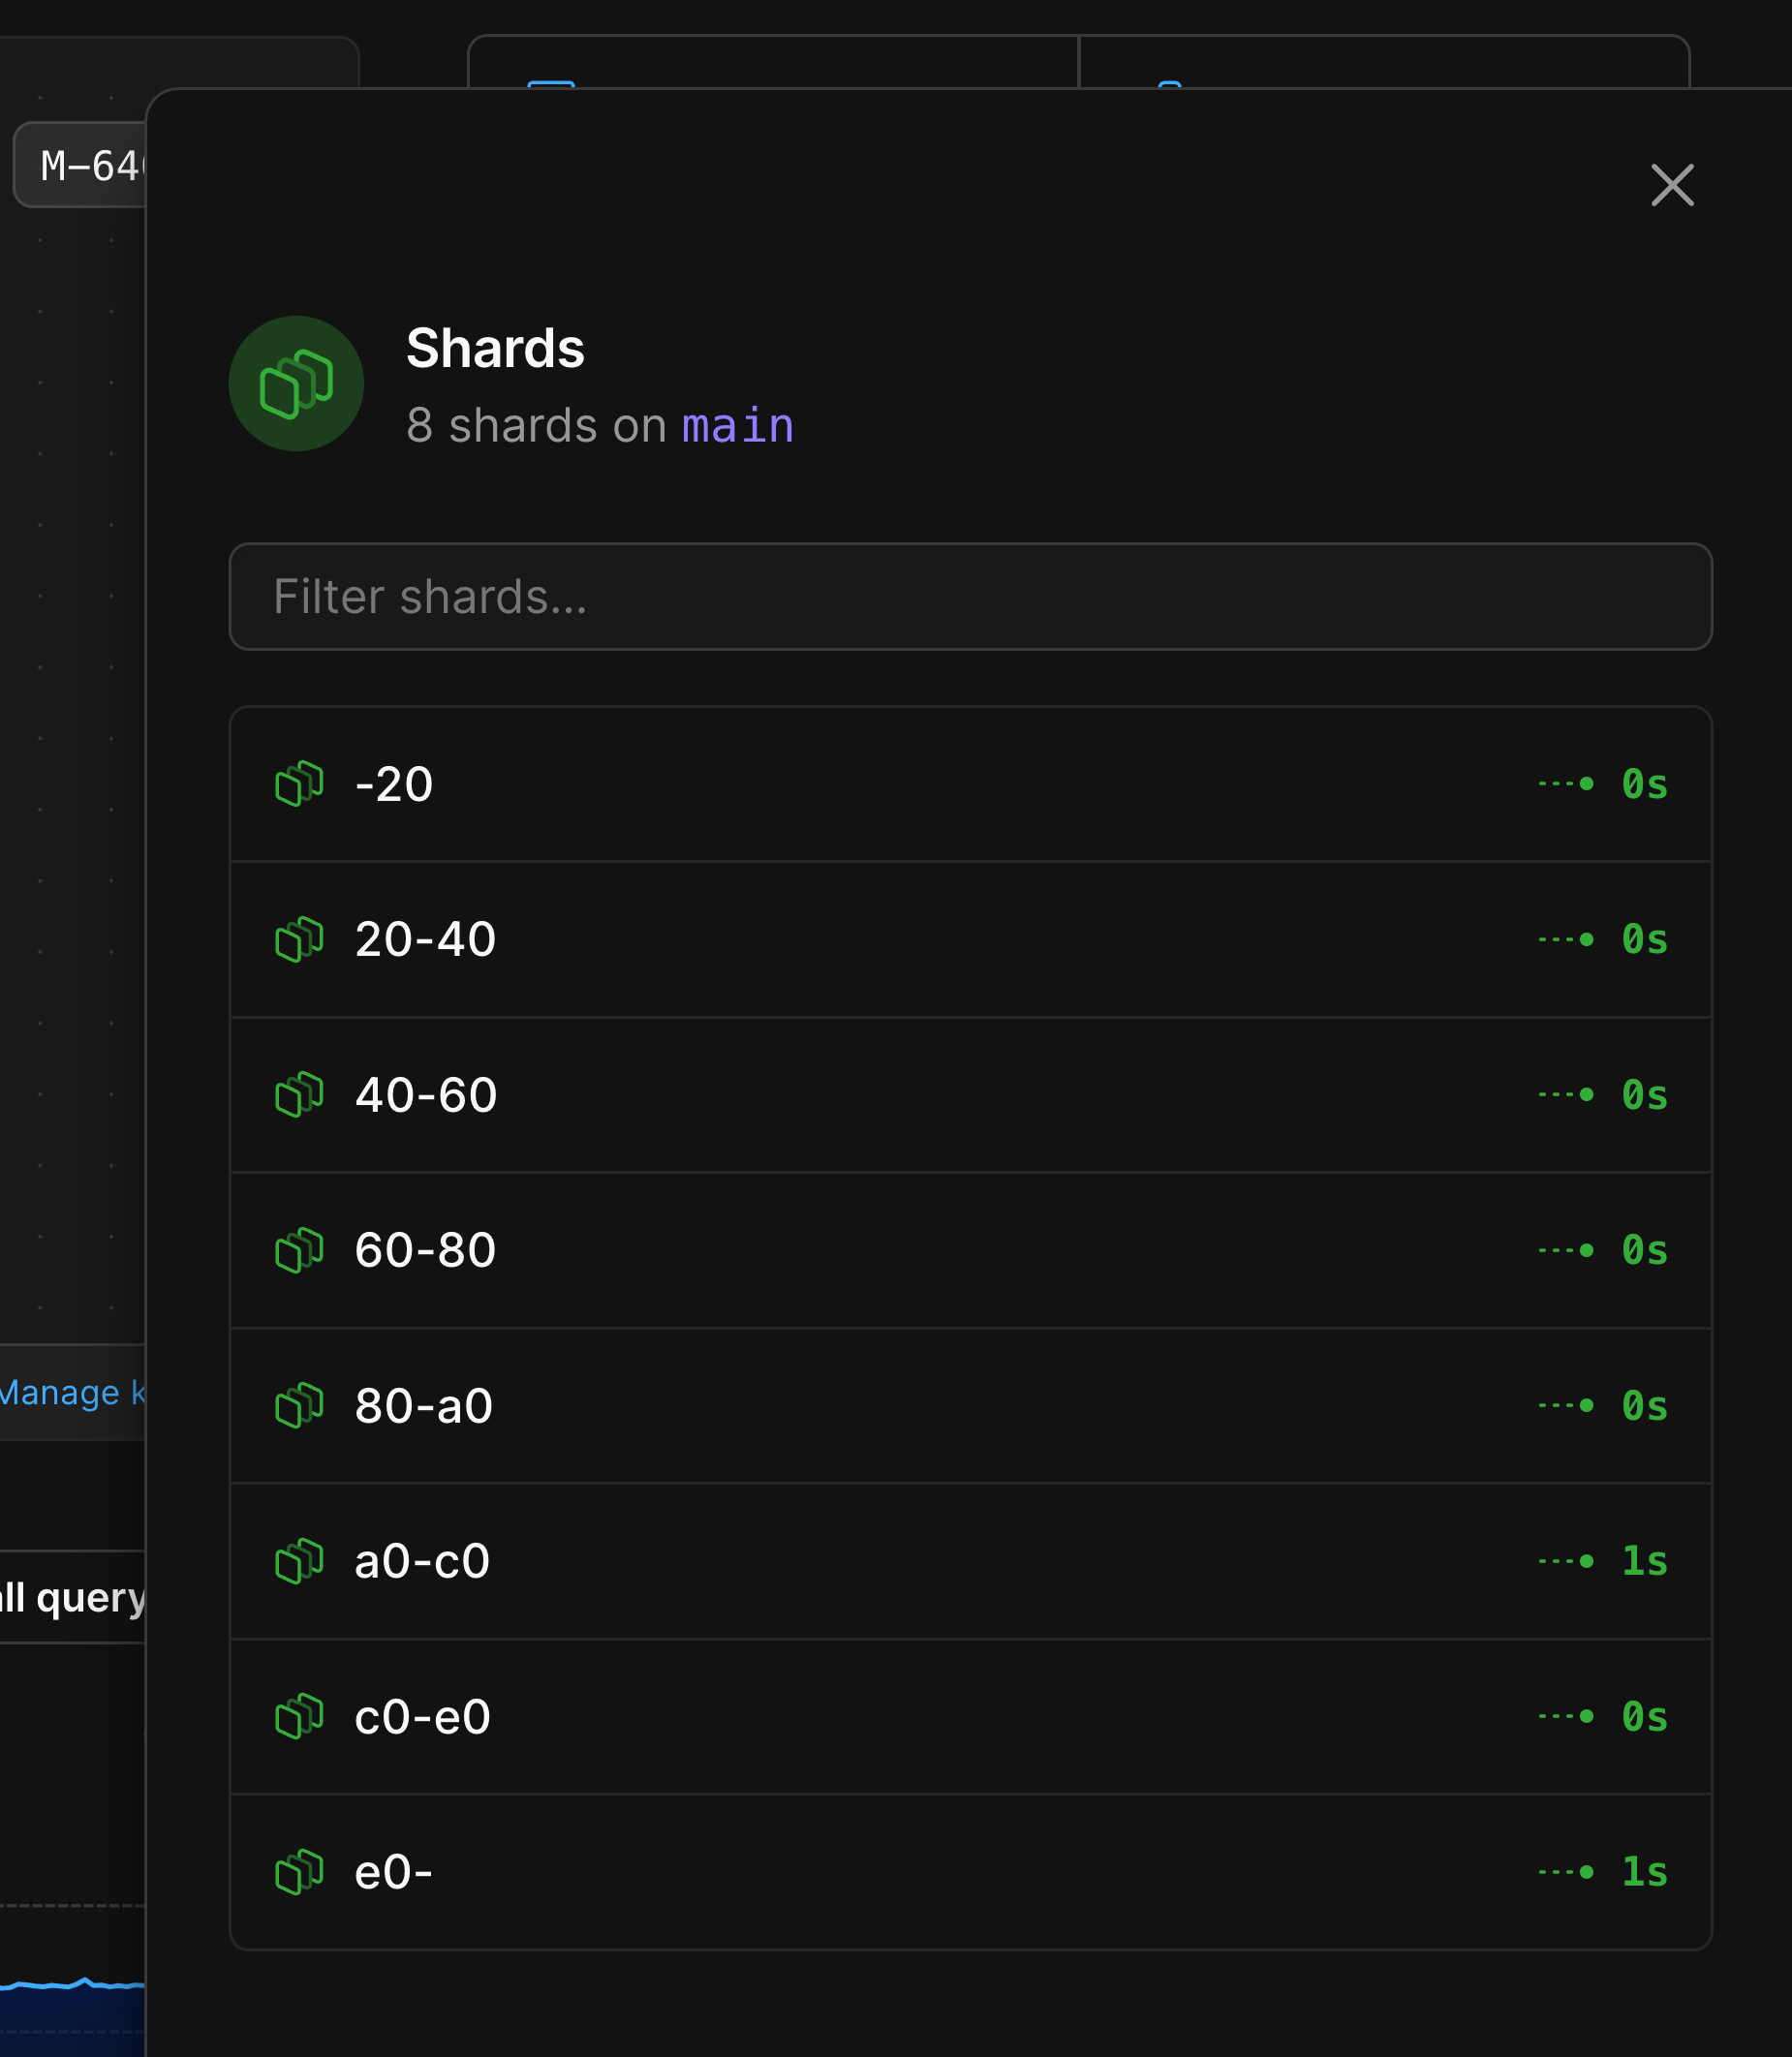
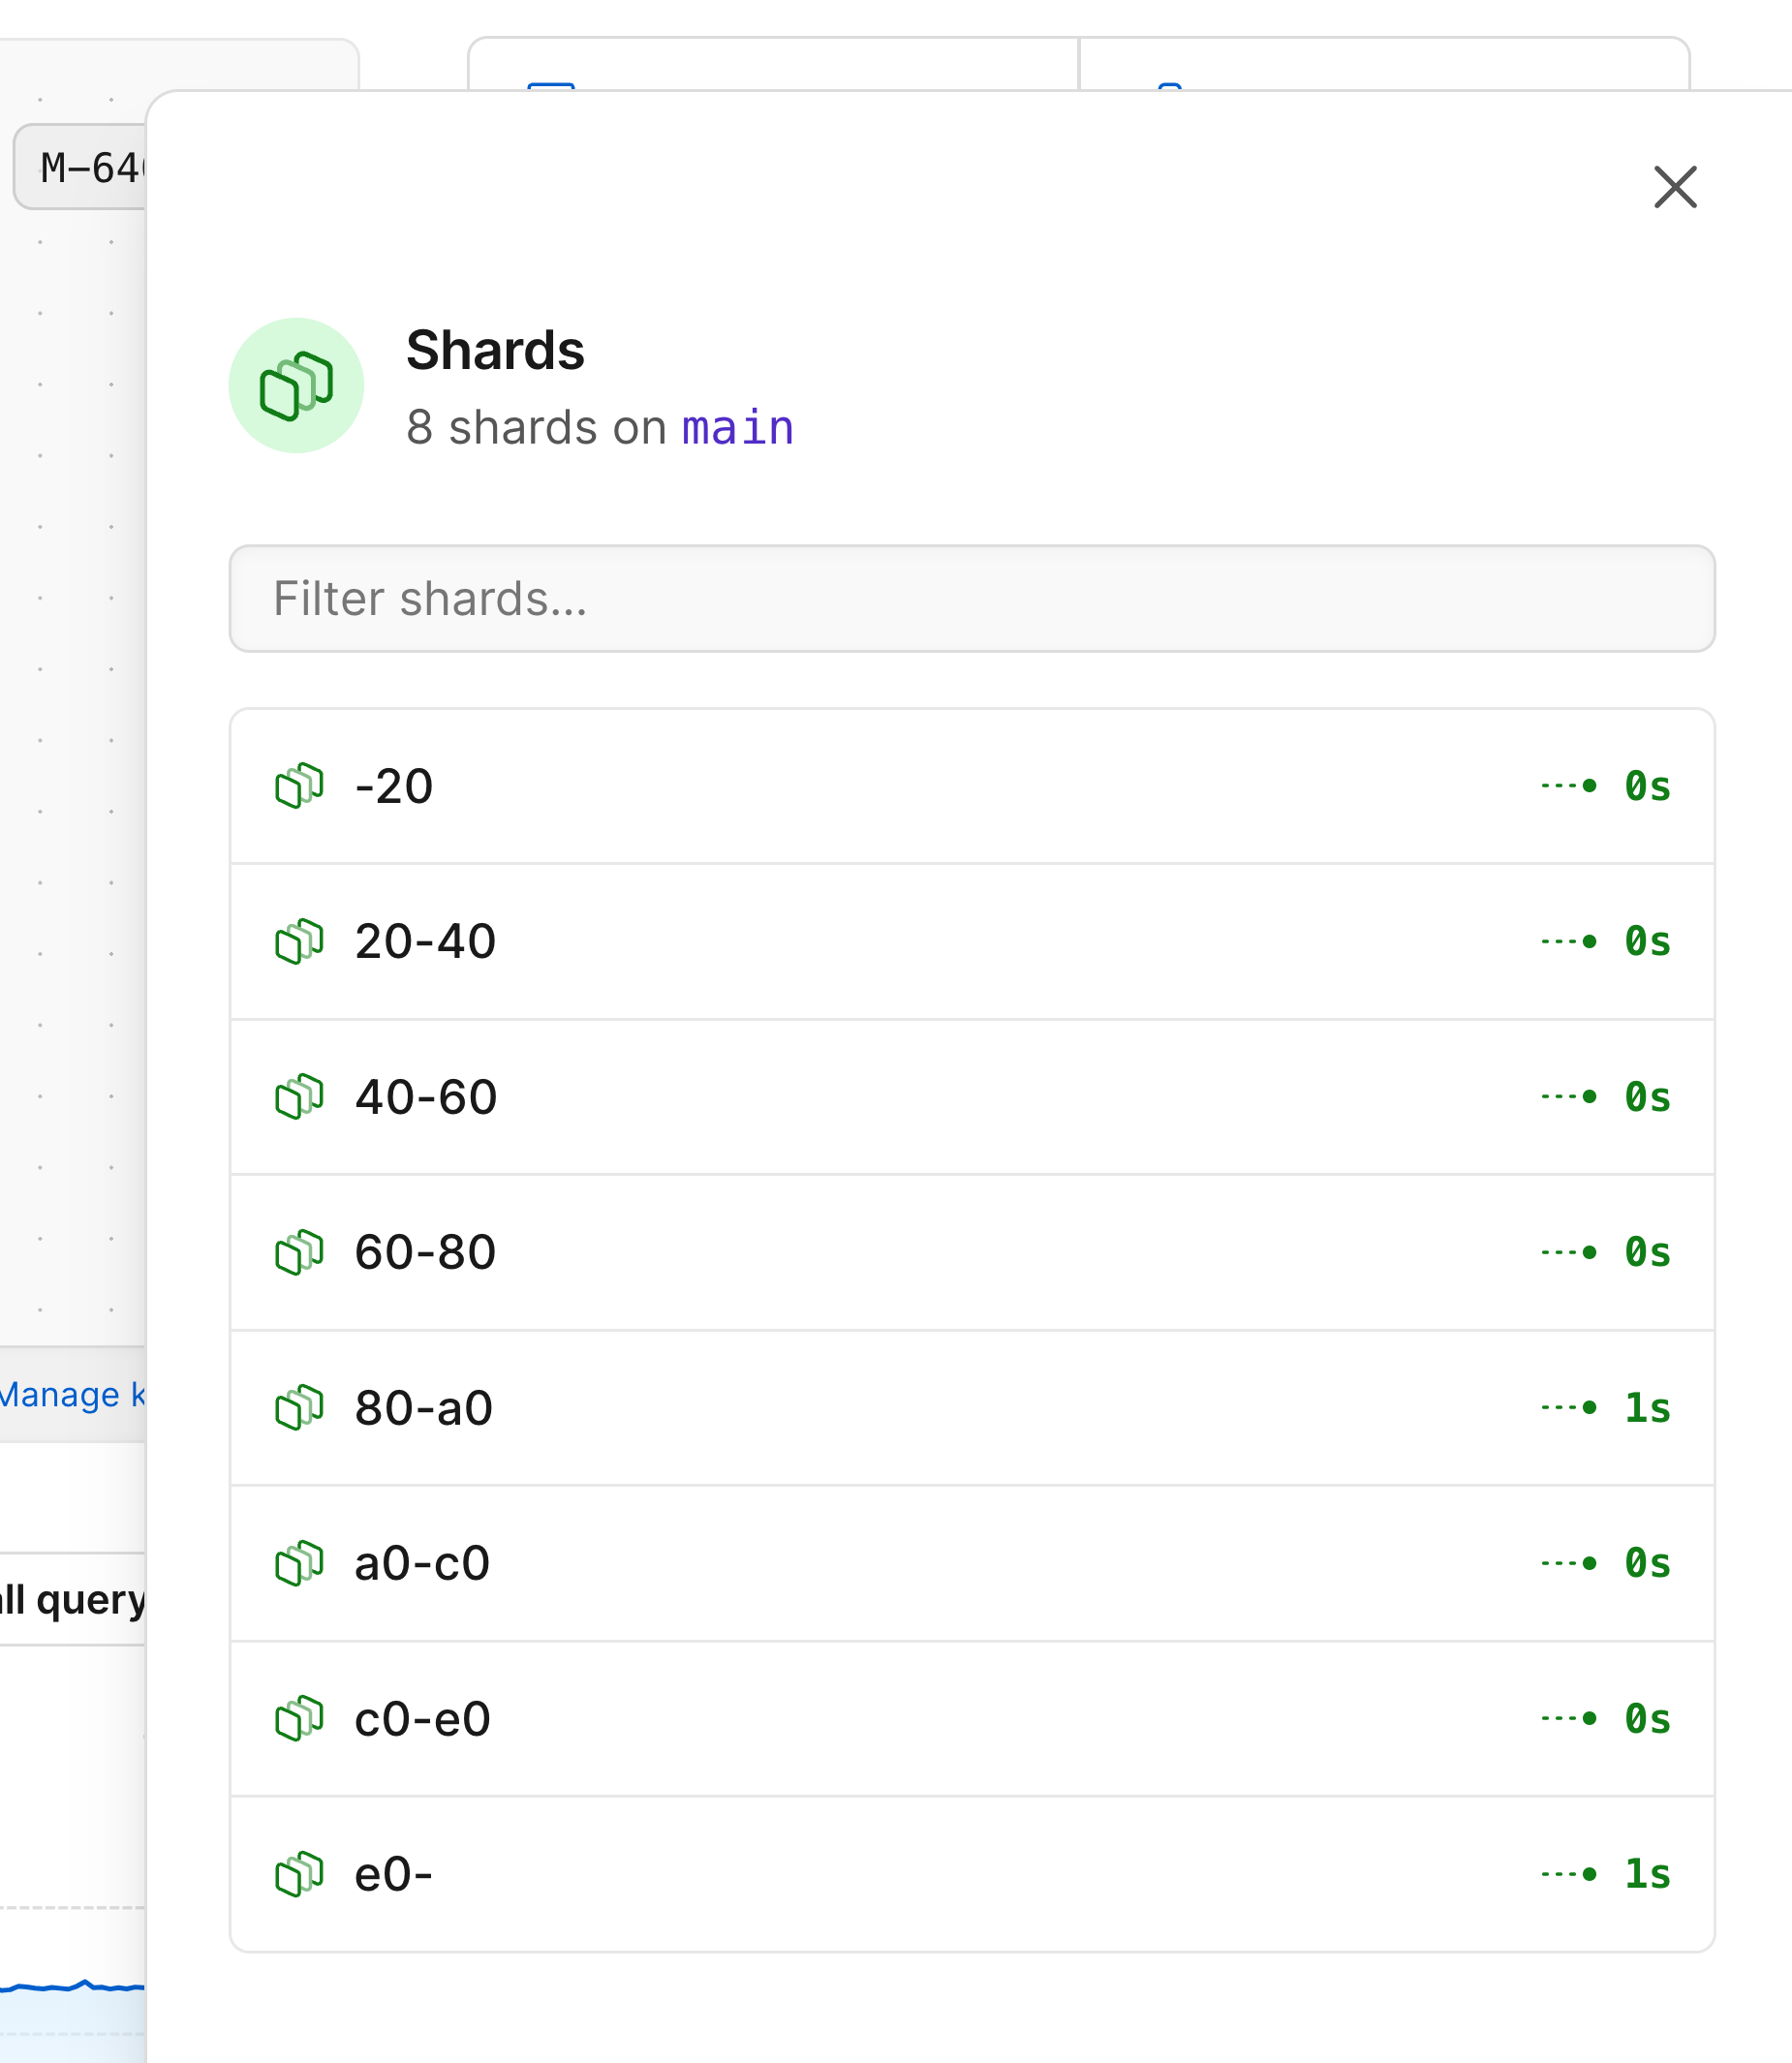 After selecting a shard, you'll be able to choose to look at metrics for either that shard's primary or one of its replicas.
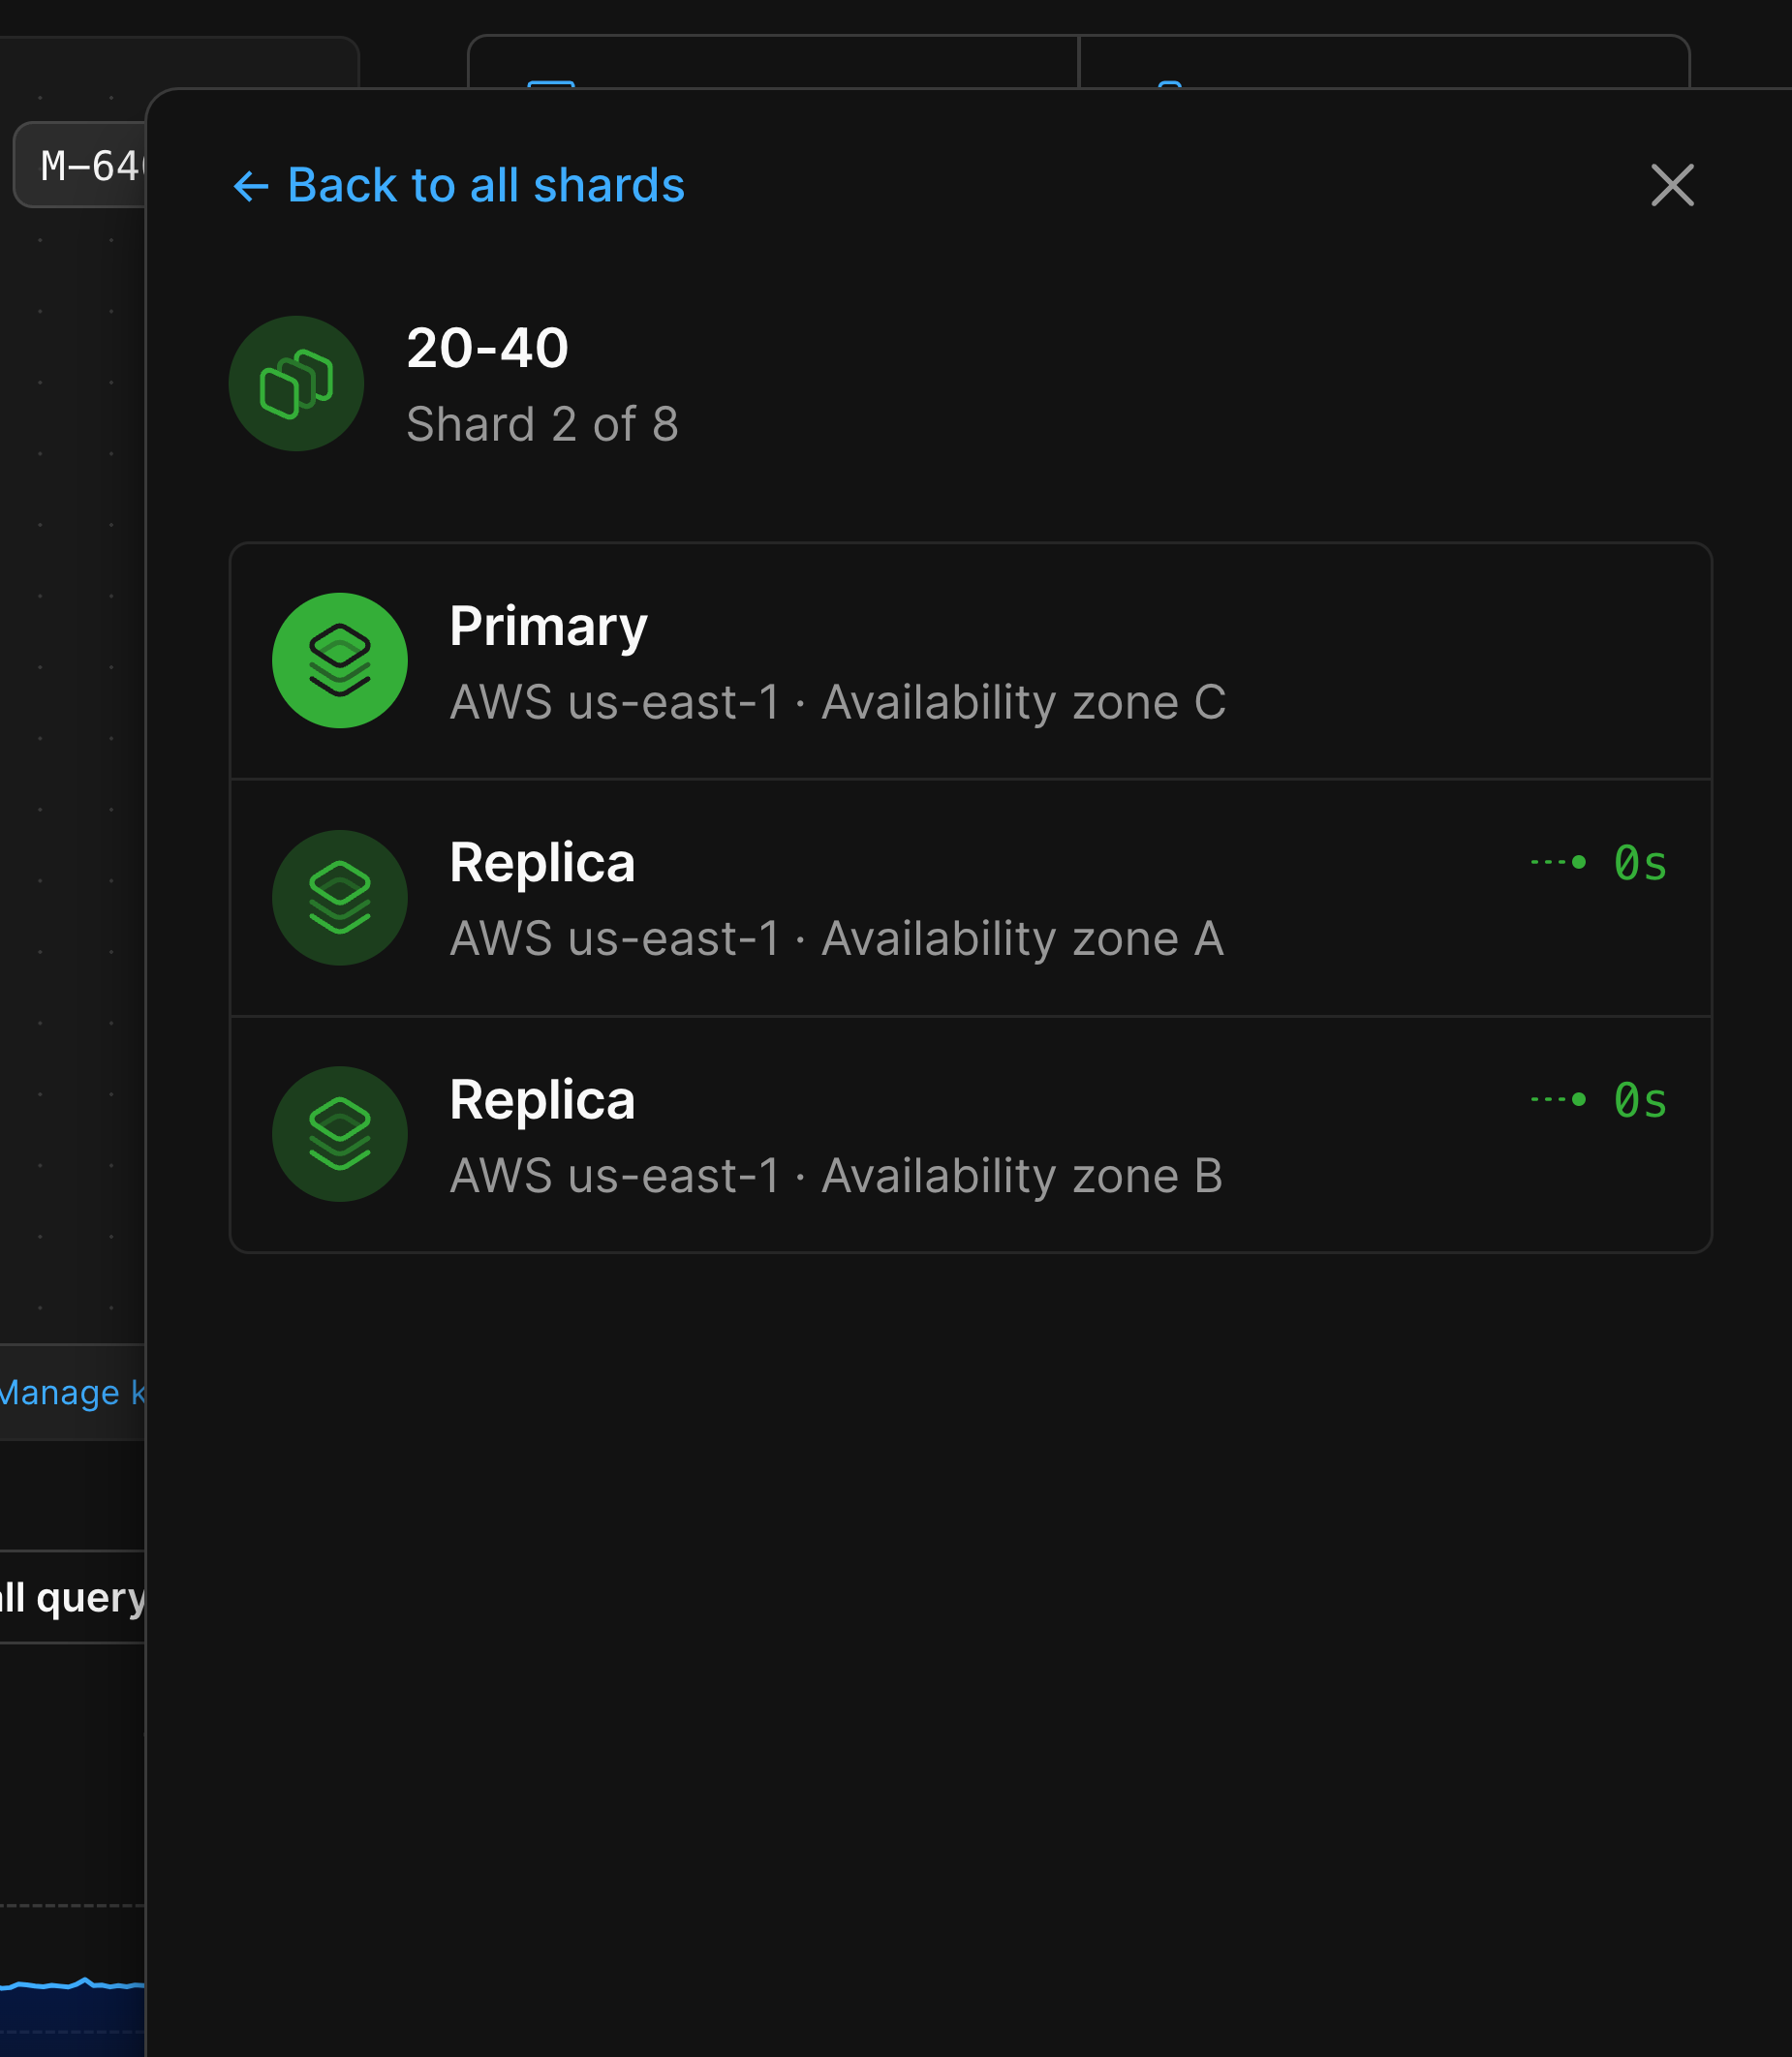
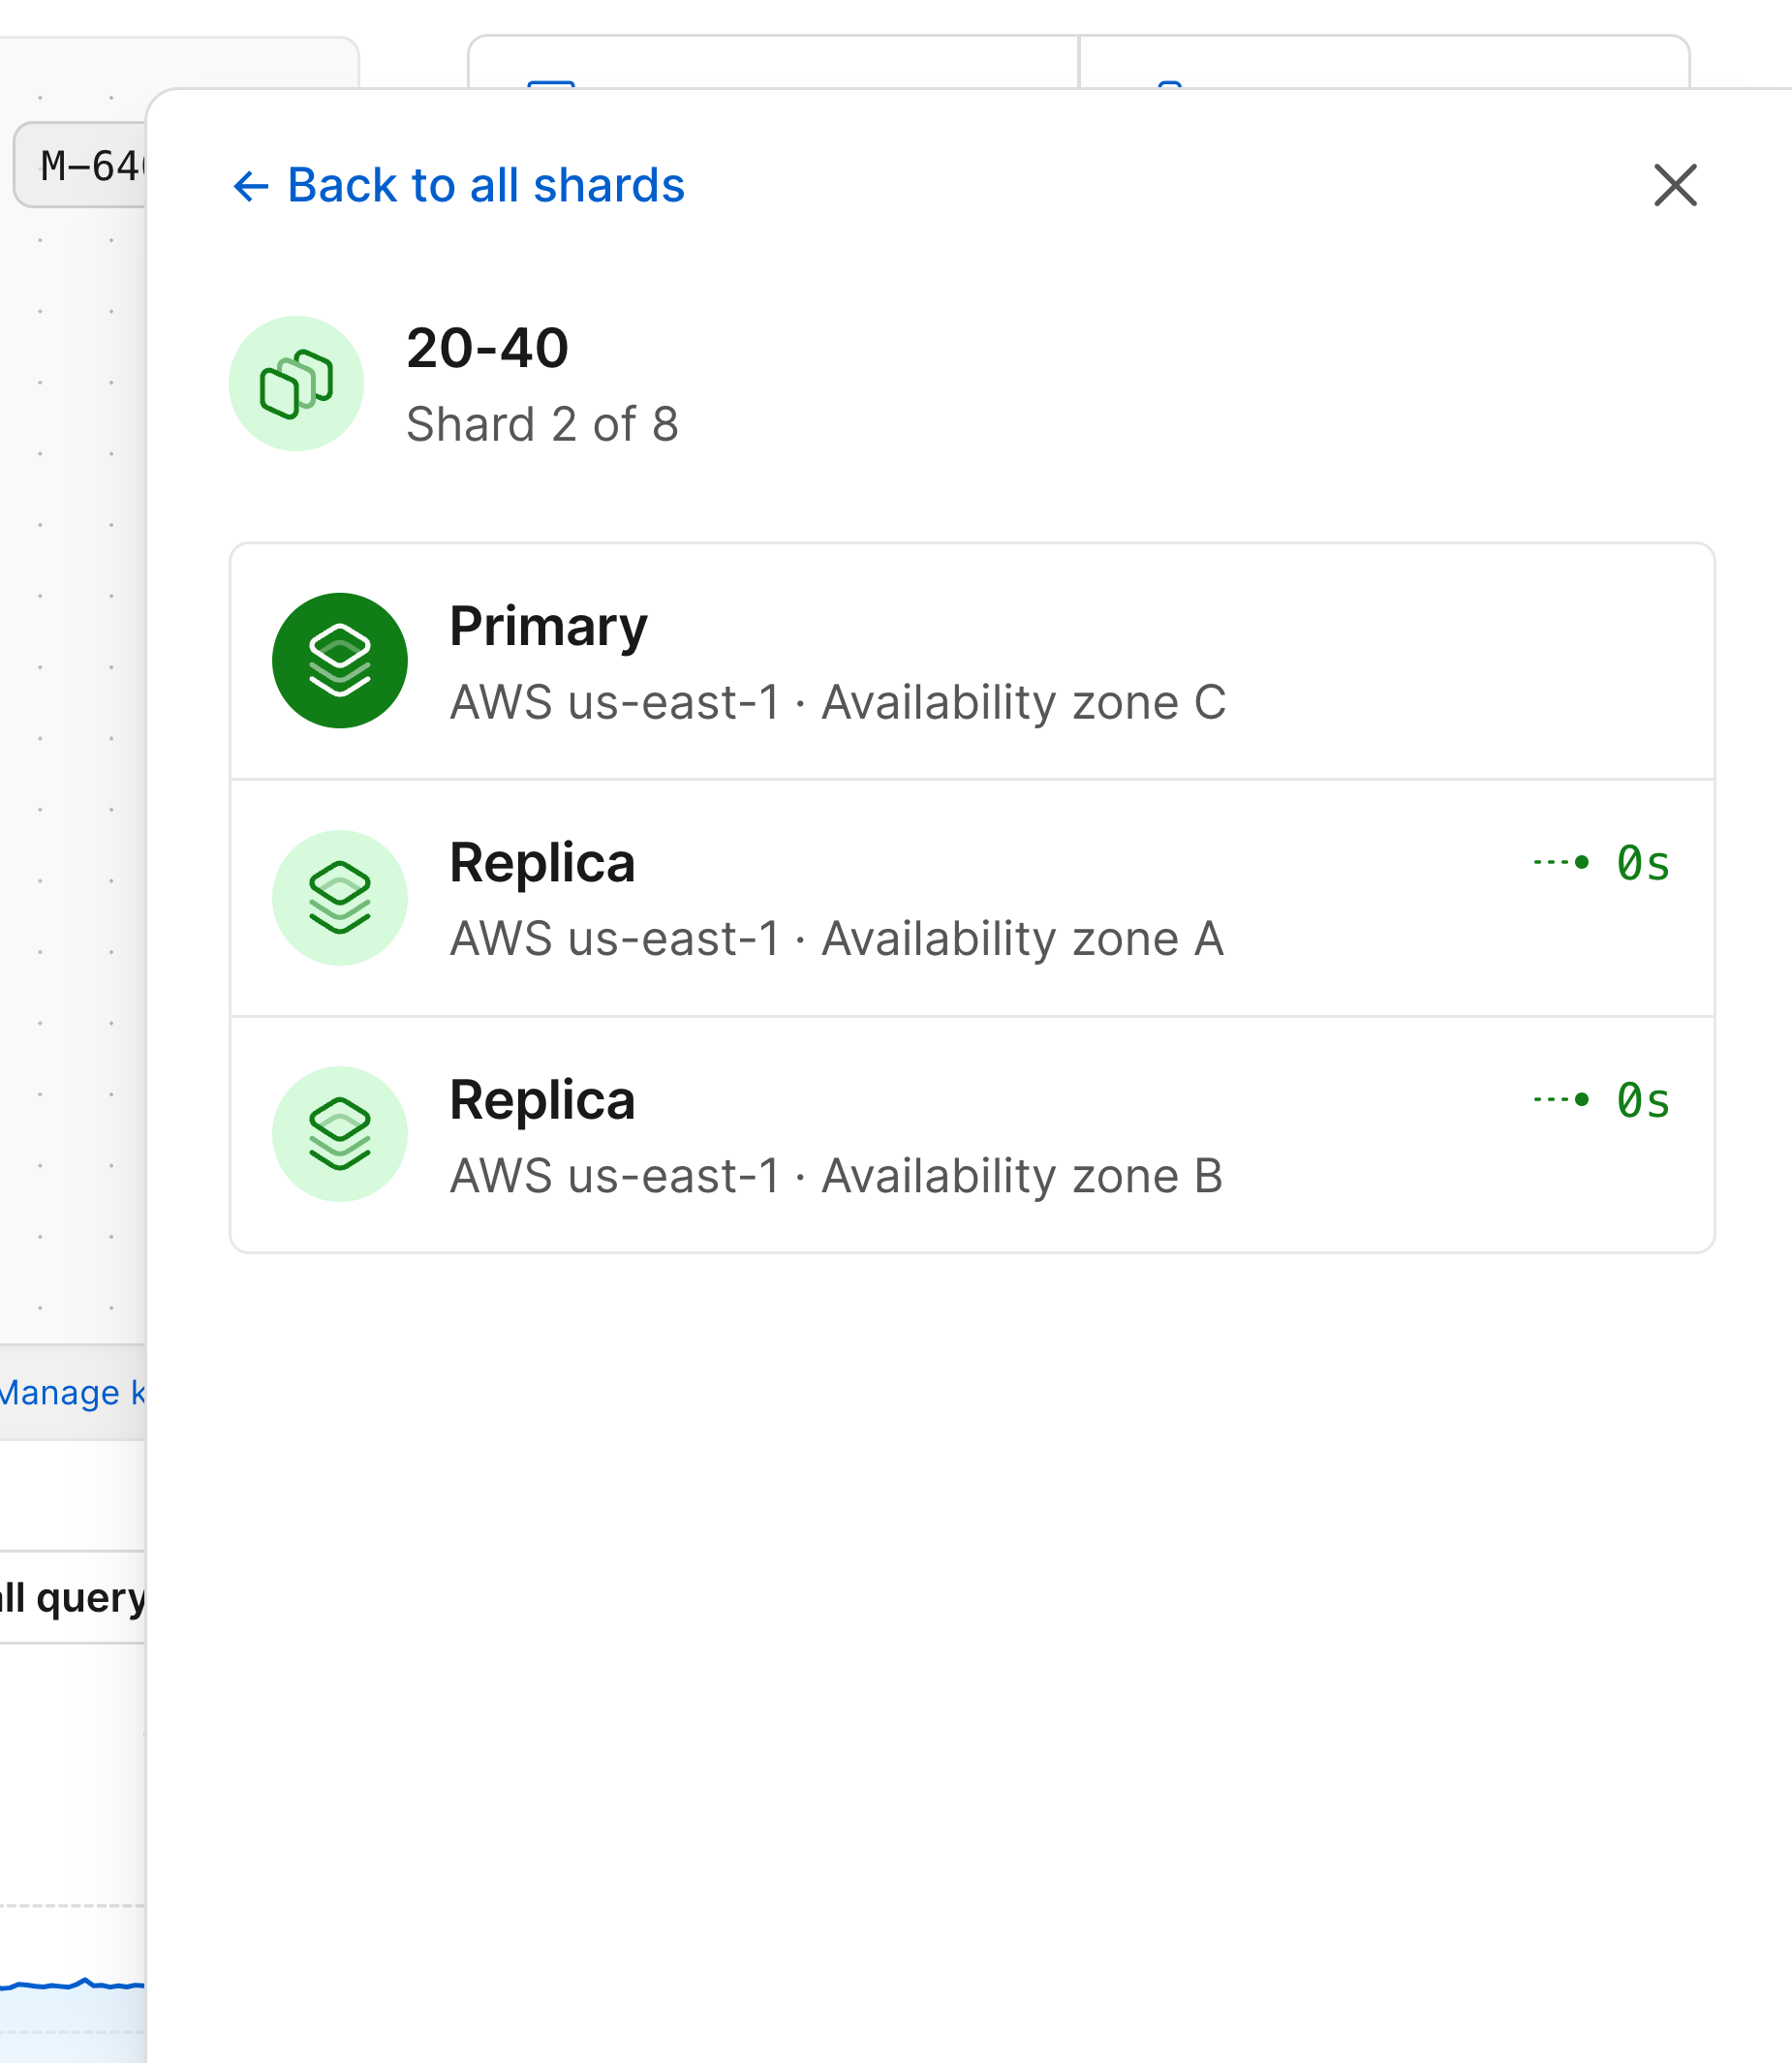 Selecting one will show you the metrics for that specific node in your database architecture.
 ### Resizing
You can use the [Clusters page](/vitess/cluster-configuration) menu to resize your keyspaces.
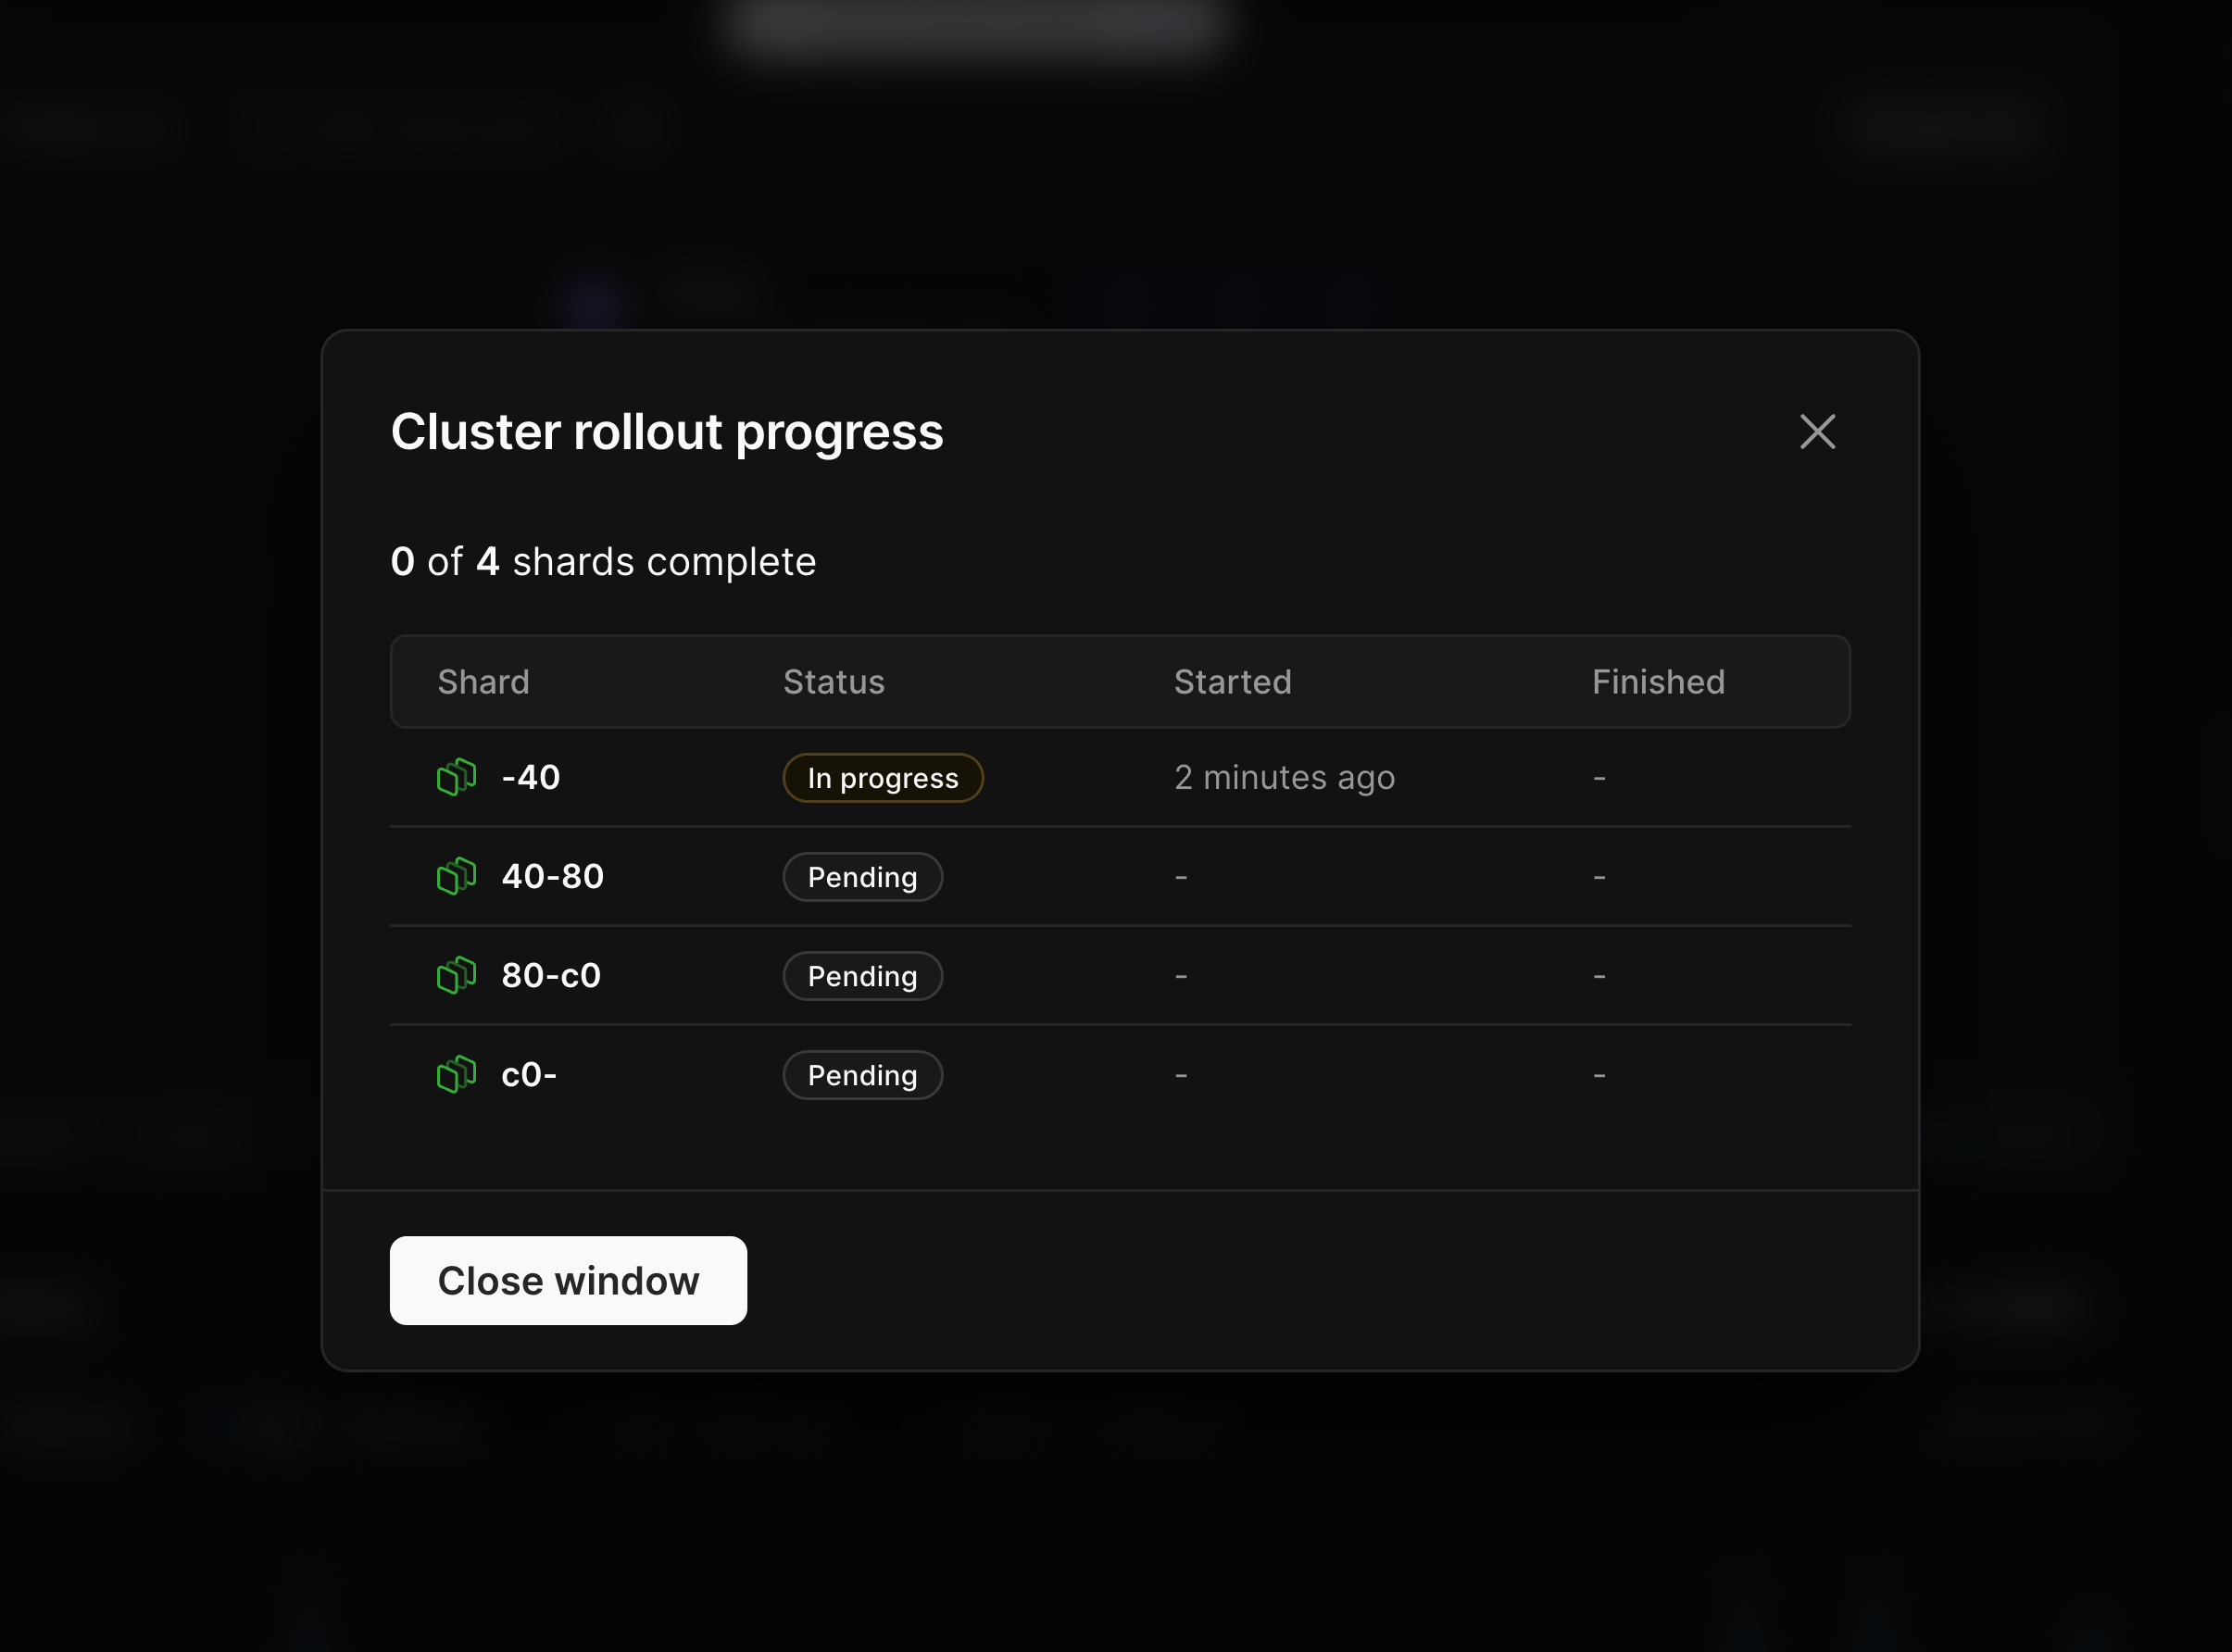
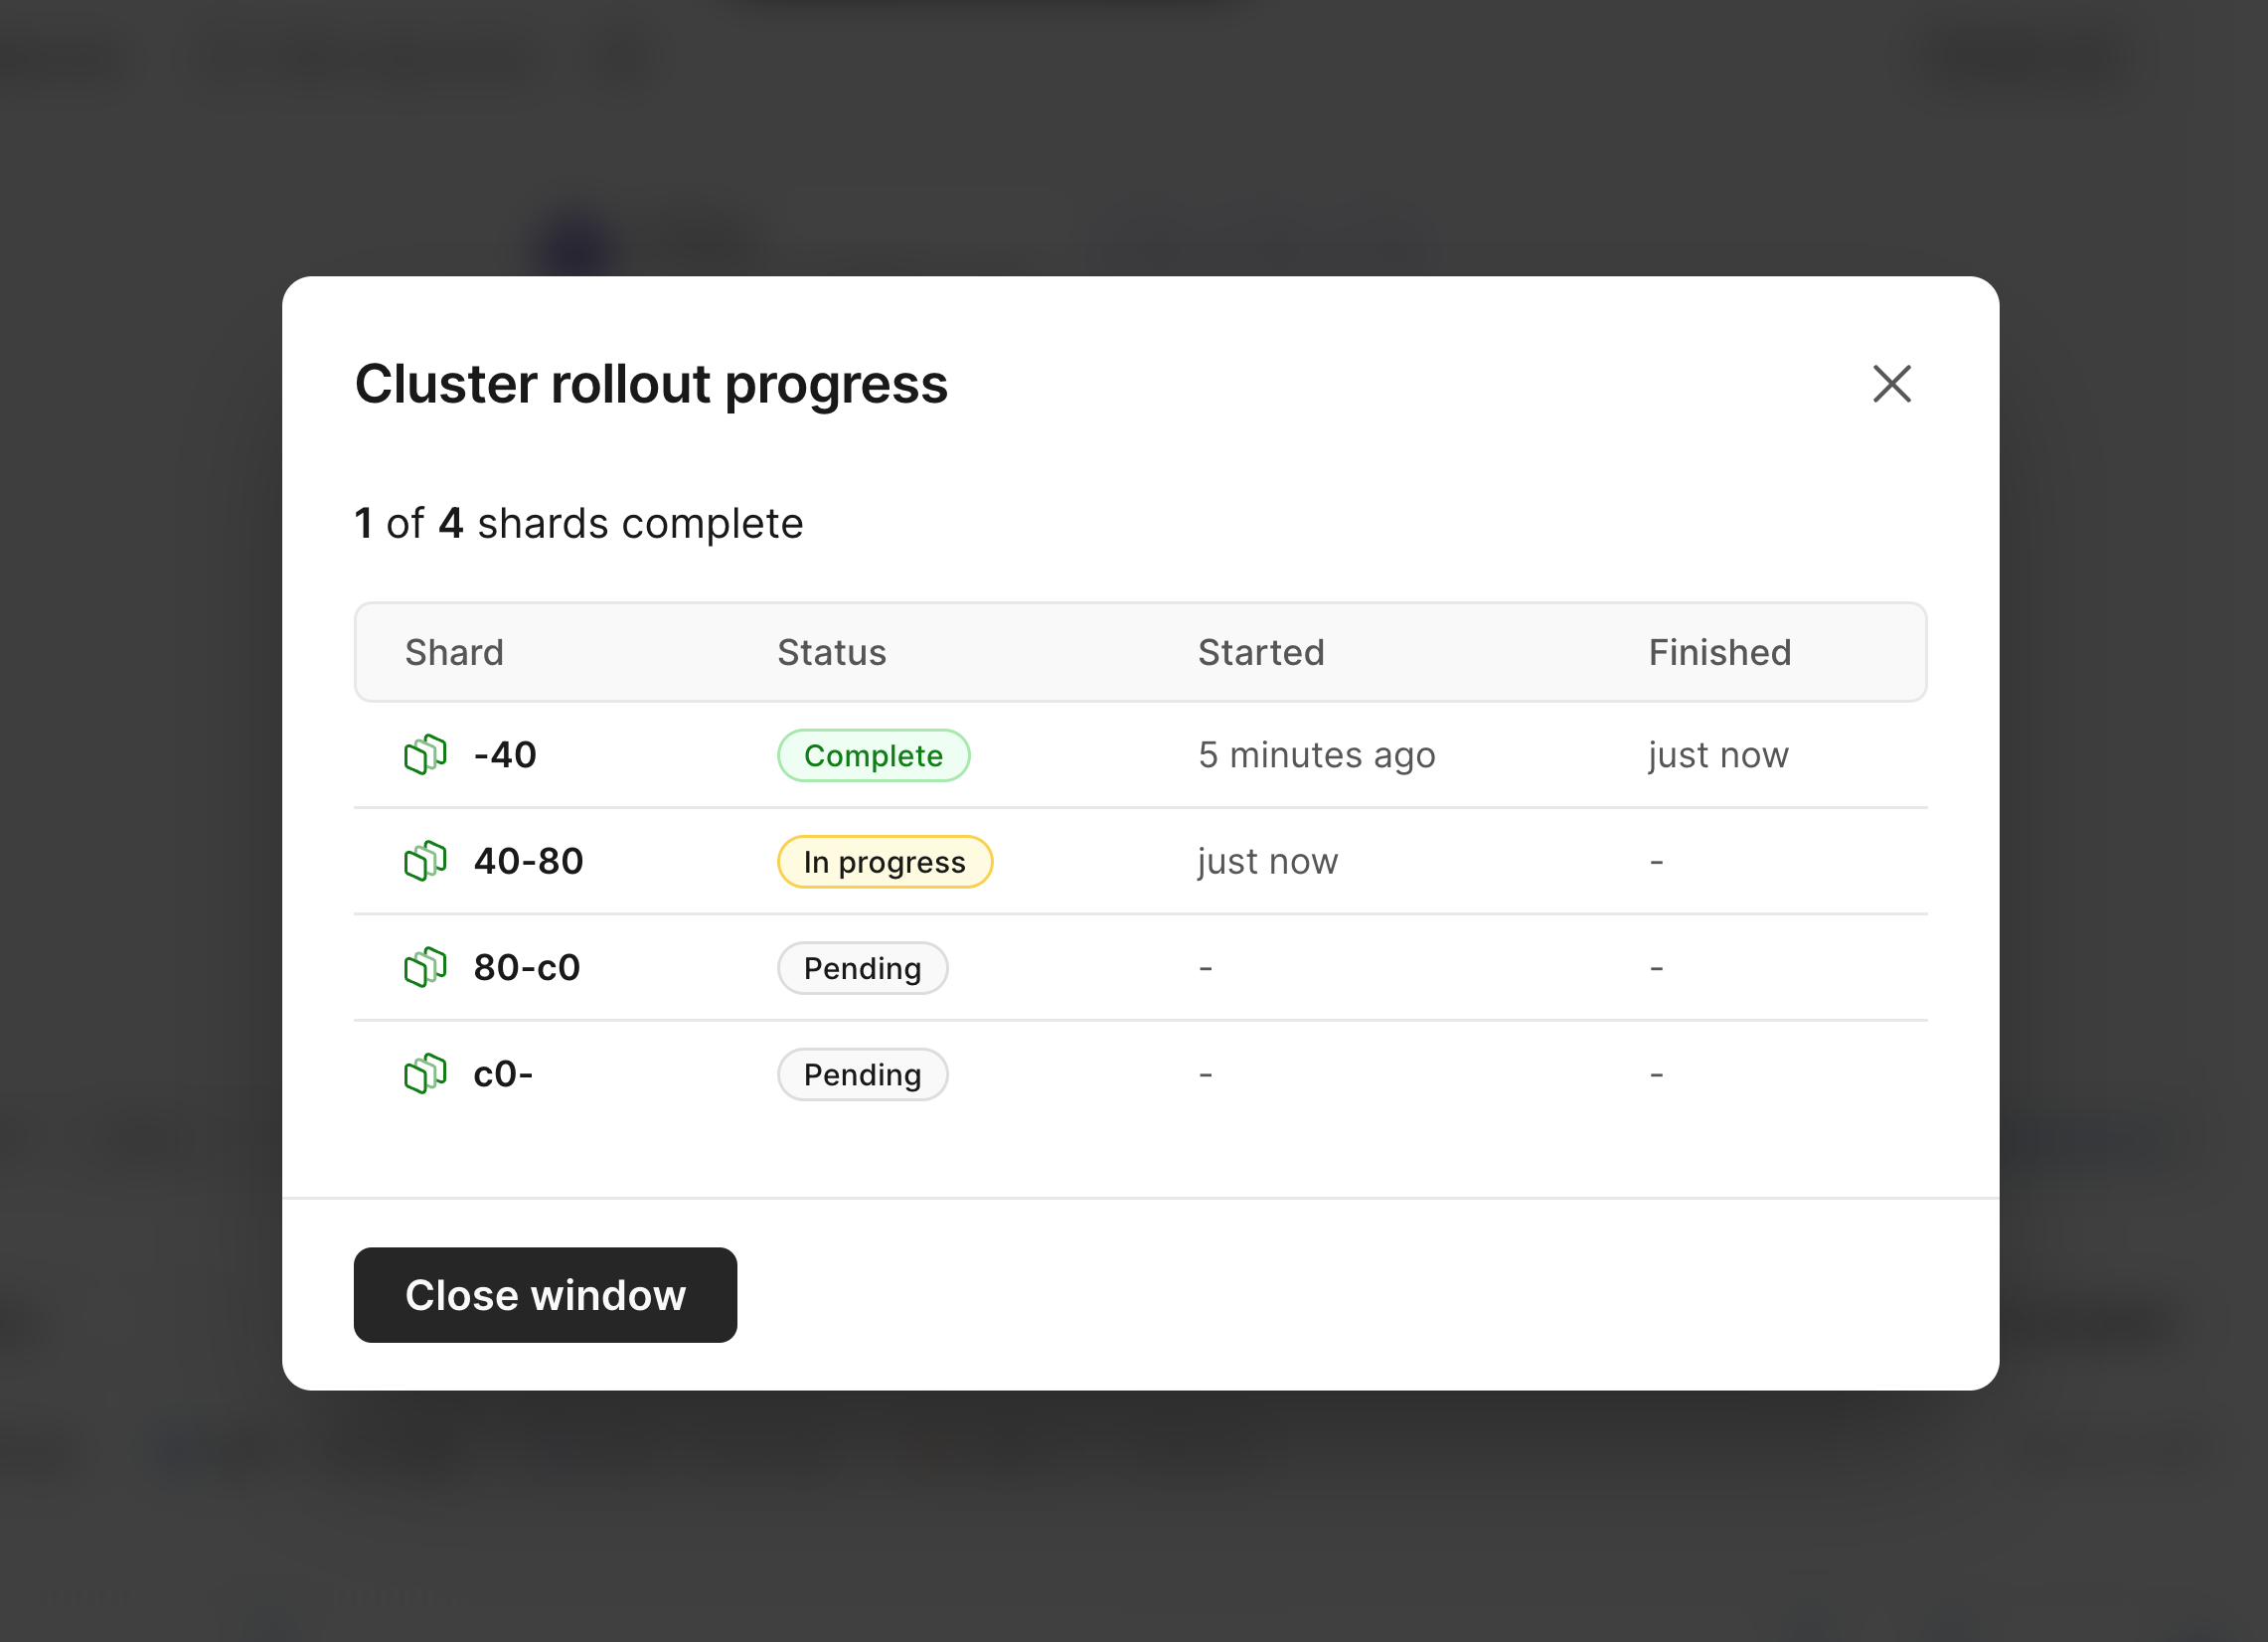
When a resize is in progress, this will be indicated at the top of the diagram.
### Resizing
You can use the [Clusters page](/vitess/cluster-configuration) menu to resize your keyspaces.
When a resize is in progress, this will be indicated at the top of the diagram.
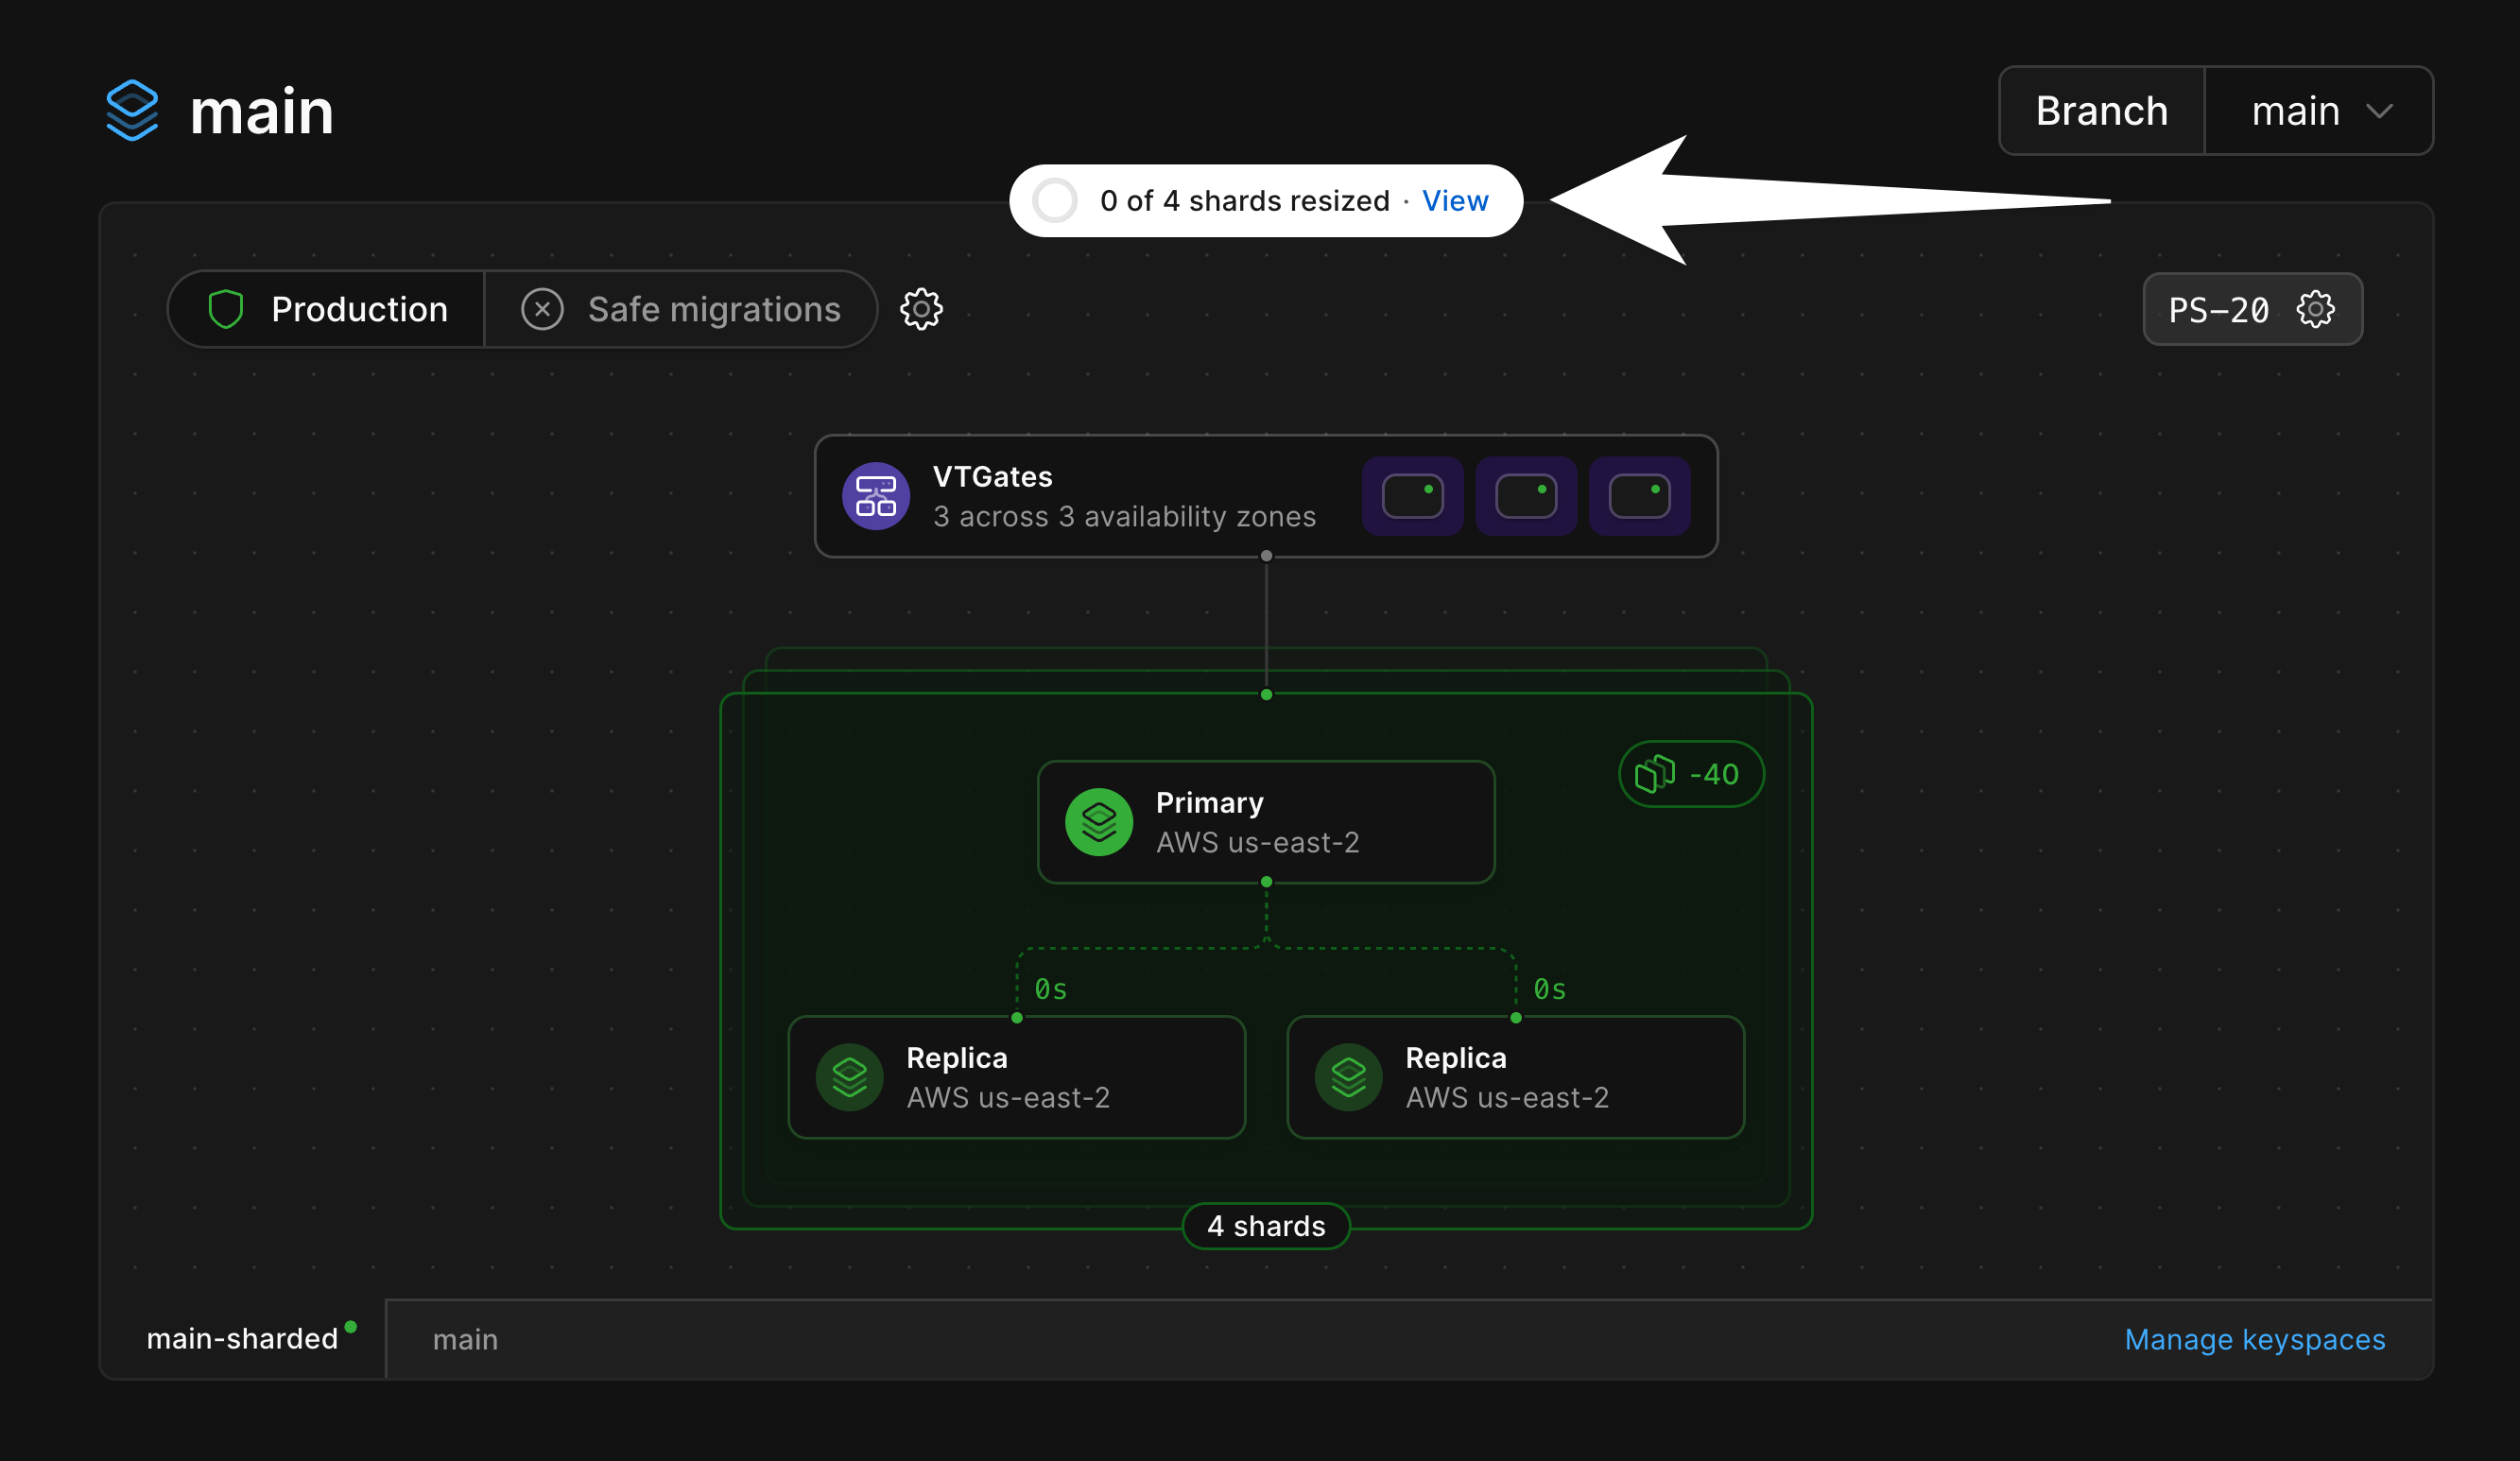
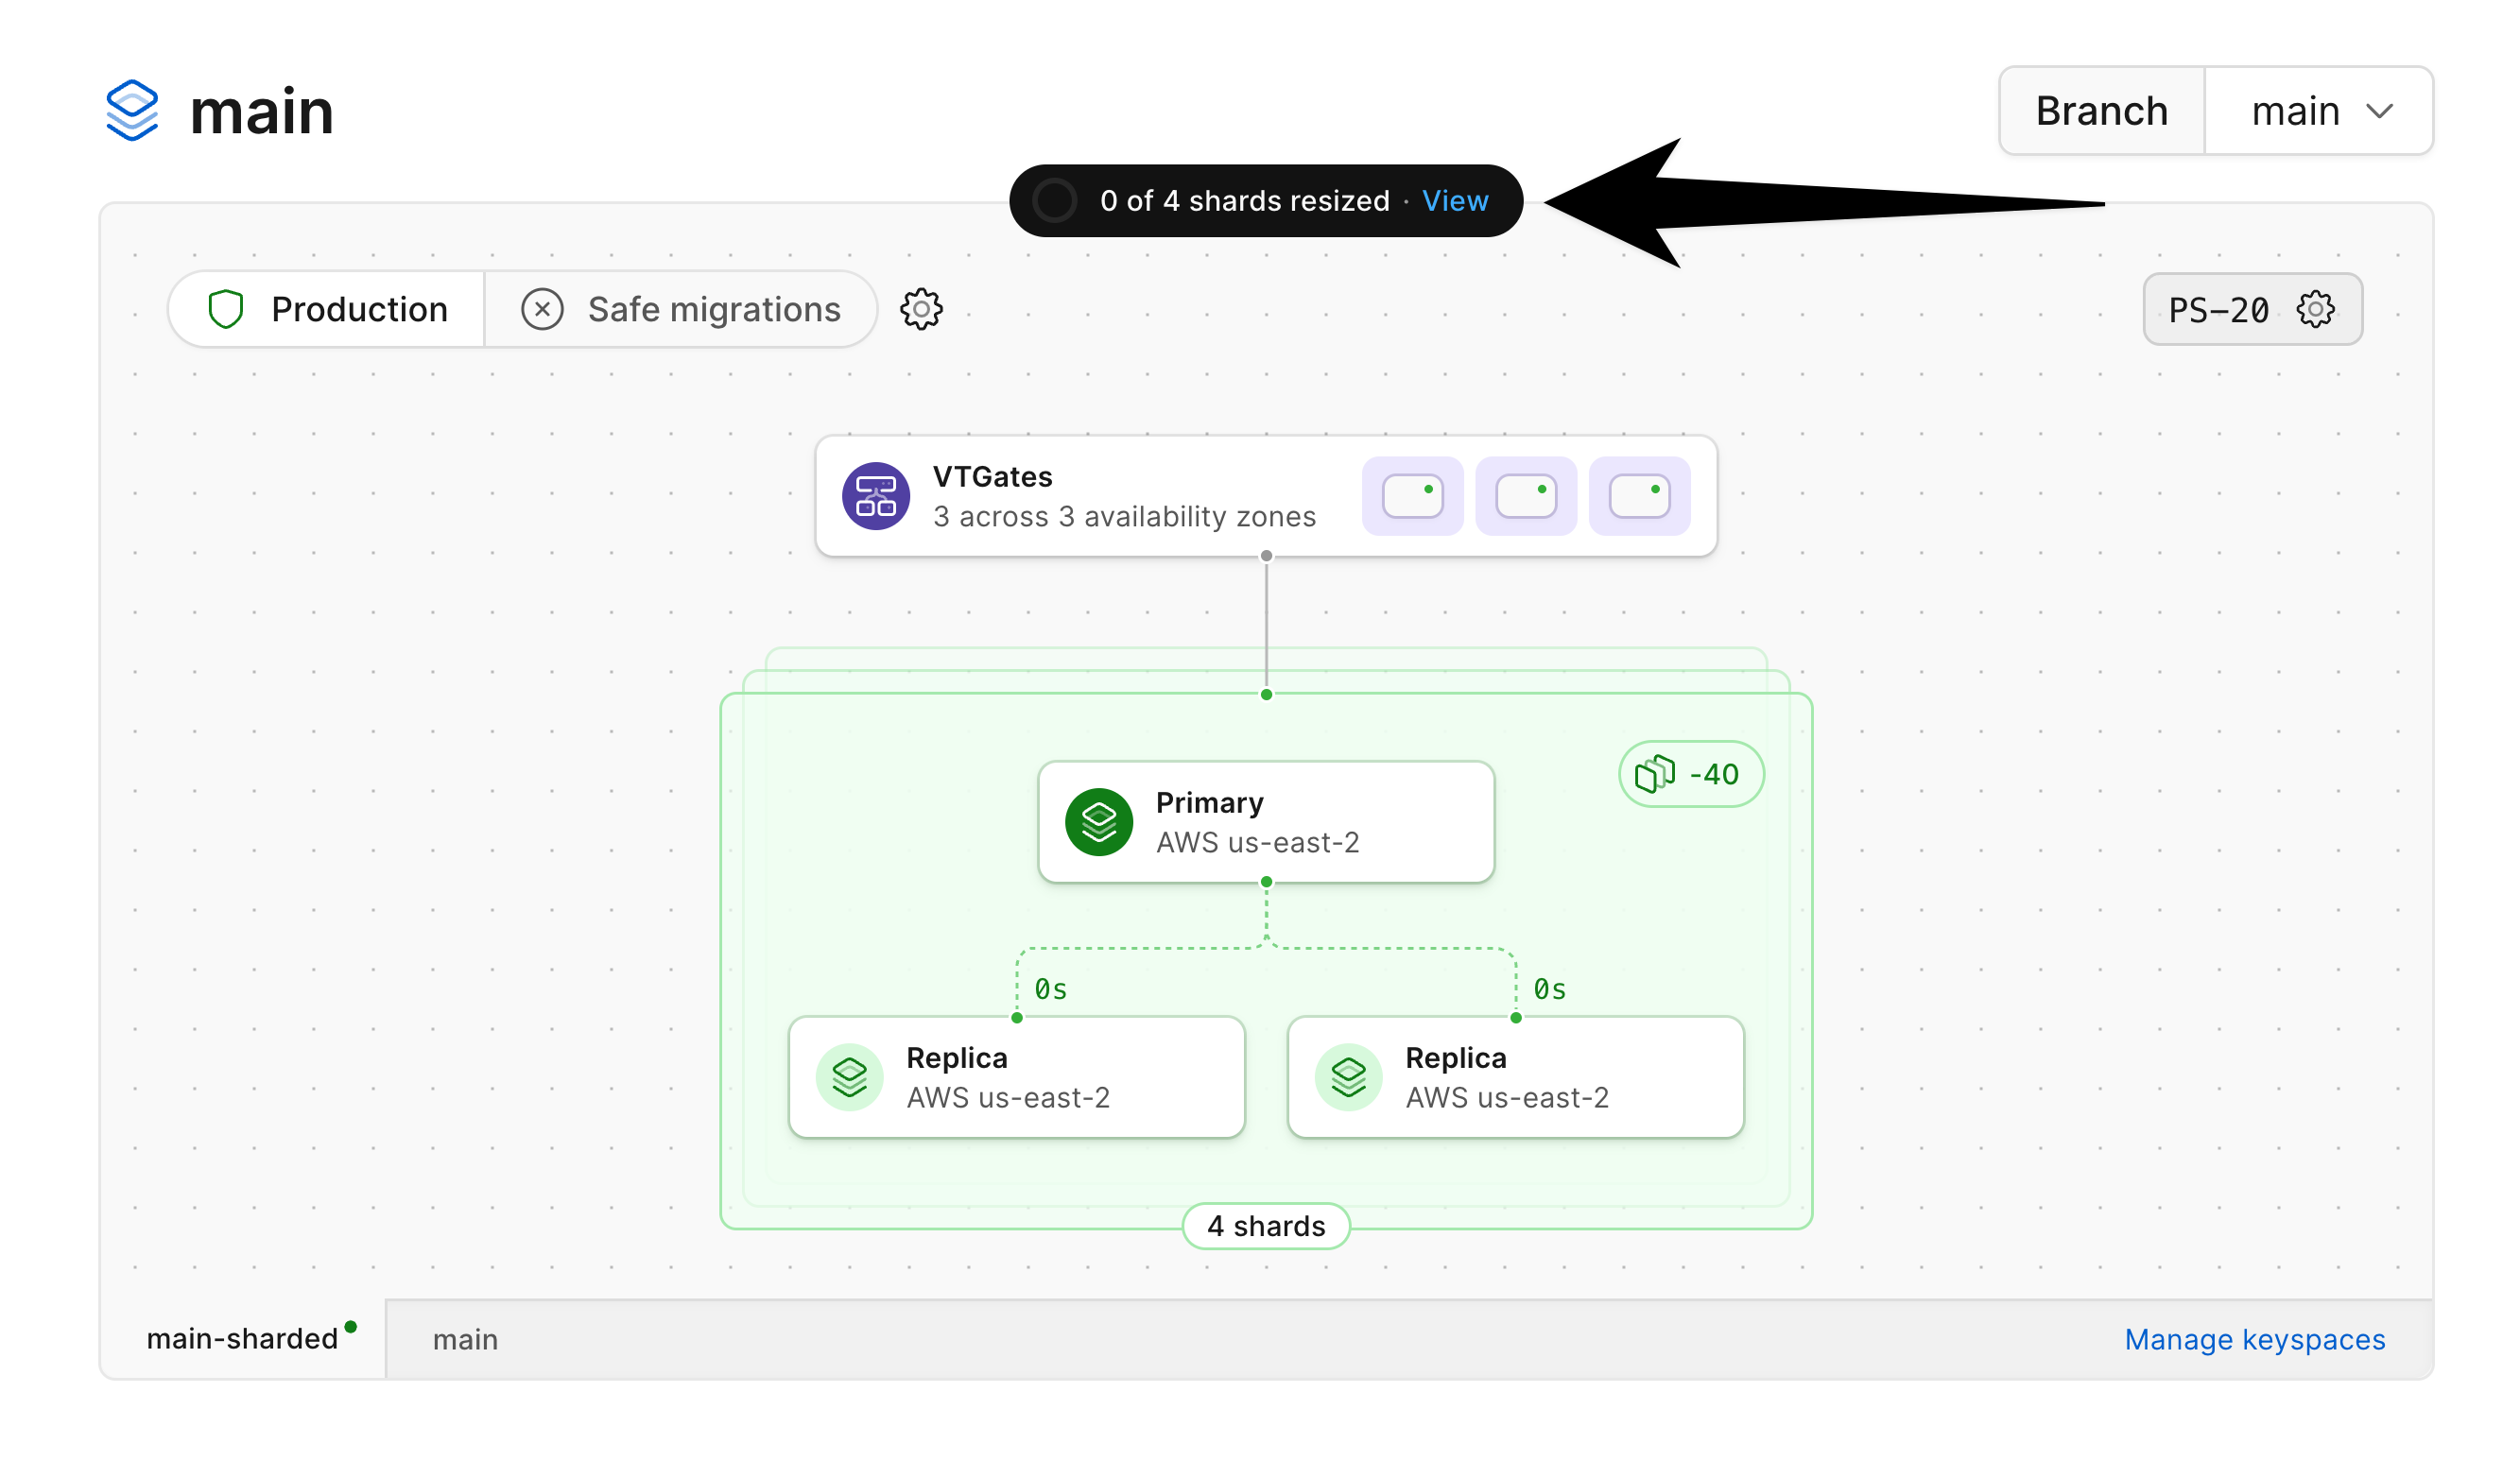 Click on "**View**" to see the status for each shard being resized:
 ## Need help?
Get help from [the PlanetScale Support team](https://planetscale.com/contact?initial=support), or join our [Discord community](https://pscale.link/community) to see how others are using PlanetScale.
## Need help?
Get help from [the PlanetScale Support team](https://planetscale.com/contact?initial=support), or join our [Discord community](https://pscale.link/community) to see how others are using PlanetScale.