> ## Documentation Index
> Fetch the complete documentation index at: https://planetscale.com/docs/llms.txt
> Use this file to discover all available pages before exploring further.
# Cluster Metrics
> The Metrics dashboard provides comprehensive monitoring and observability for your PostgreSQL database cluster.
export const YouTubeEmbed = ({id, title}) => {
return
;
};
This centralized view helps you track performance, identify bottlenecks, and ensure optimal database health.
 ## Dashboard overview
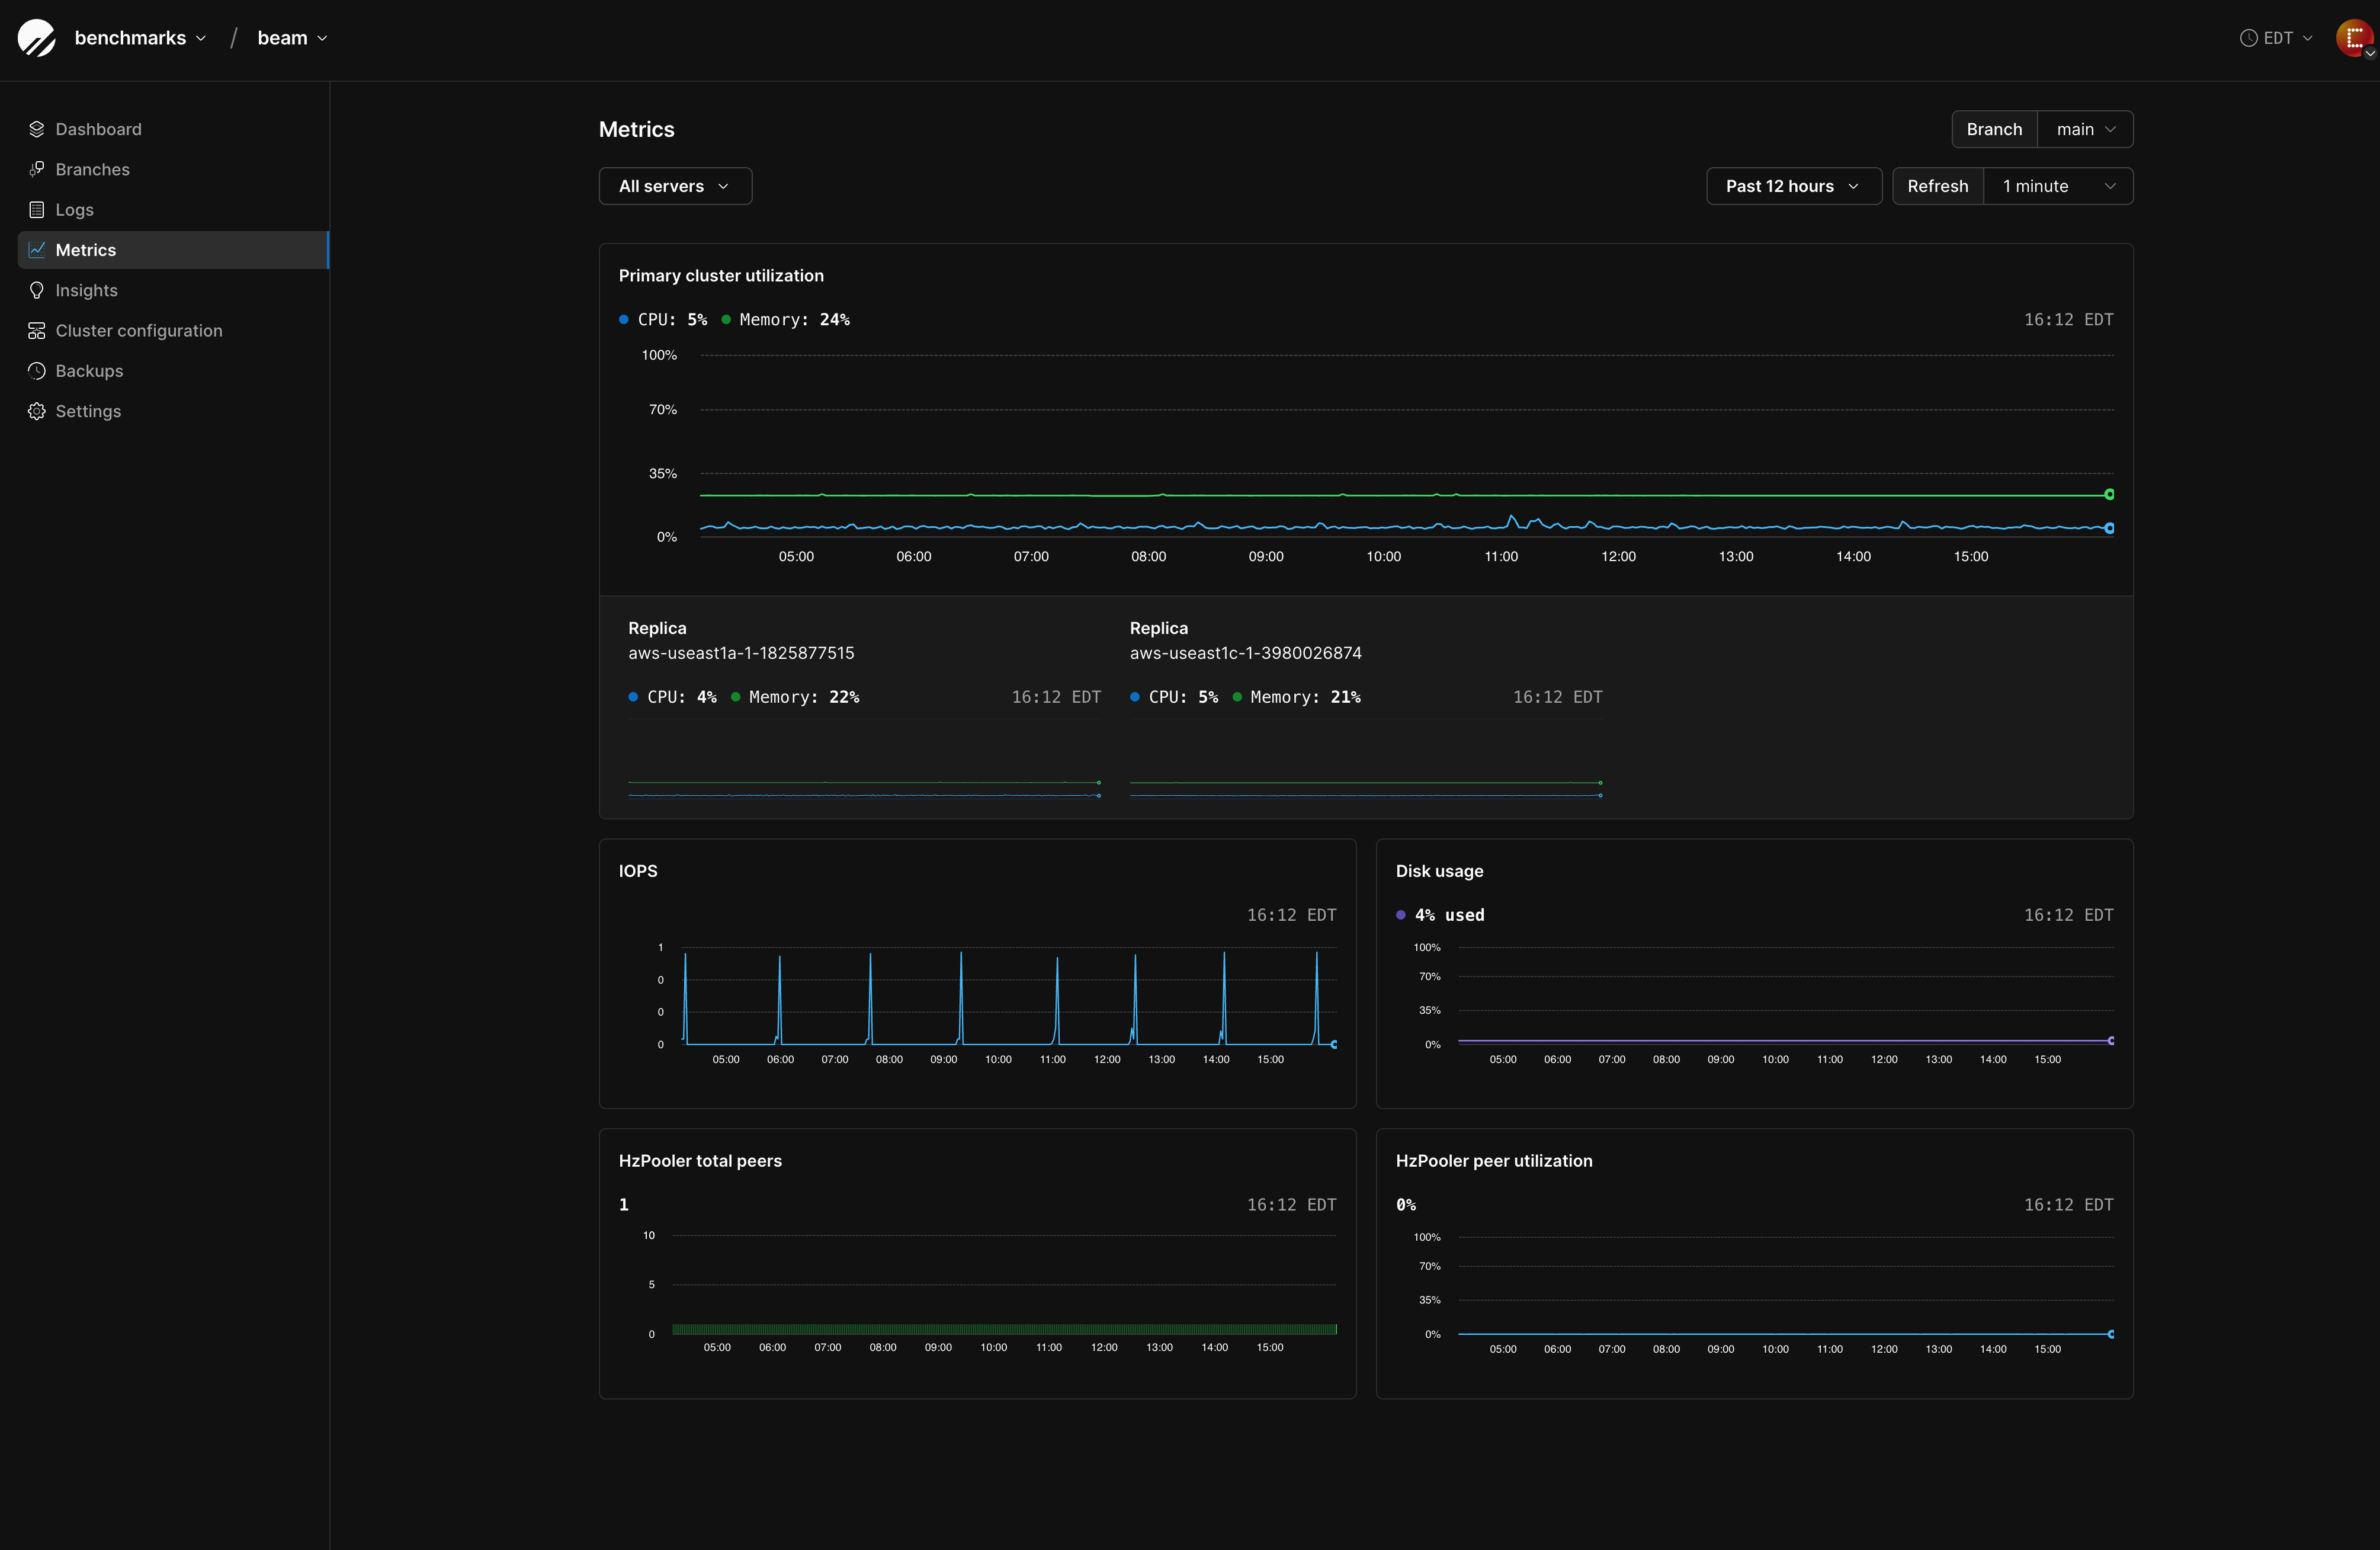
The Metrics dashboard displays real-time and historical data about your database cluster's performance across multiple dimensions. You can filter metrics by:
* **Server Filter**: Monitor all servers or focus on specific instances
* **Branch**: Select which database branch to monitor
* **Time Range**: View data from the past 15 minutes up to custom time ranges
* **Live update**: Toggle on/off the auto-refresh of data every \~30 seconds
## Key metrics categories
### Primary cluster utilization
The primary cluster utilization panel shows your primary database server's resource consumption:
| Metric | Unit | Purpose | Key Insights |
| :--------- | :------ | :------------------------- | :------------------------------------------------------------------------------ |
| **CPU** | Percent | Real-time CPU utilization | Monitor for consistent performance and identify when optimization may be needed |
| **Memory** | Percent | Current memory consumption | Track memory usage patterns and plan for scaling when approaching limits |
### Replica monitoring
Each replica displays individual performance metrics in dedicated panels:
| Metric | Unit | Purpose | Key Insights |
| :--------- | :------ | :------------------------------------- | :------------------------------------------------------------------------- |
| **CPU** | Percent | Individual CPU tracking per replica | Compare replica performance against primary and identify load distribution |
| **Memory** | Percent | Individual memory tracking per replica | Monitor replica resource consumption and ensure balanced utilization |
### Primary IOPS
| Metric | Unit | Purpose | Key Insights |
| :------- | :---------------- | :----------------------------------------------- | :-------------------------------------------------------------------------------- |
| **IOPS** | Operations/second | Tracks database read/write operations per second | Monitor I/O patterns and identify peak usage periods for performance optimization |
### Primary storage usage
Storage metrics vary depending on your cluster's storage type:
**For Network-attached Storage clusters:**
| Metric | Unit | Purpose | Key Insights |
| :---------------- | :---- | :-------------------------- | :------------------------------------------------------------------------------- |
| **Storage Usage** | MB/GB | Current storage consumption | Track storage growth trends for capacity planning and ensure adequate free space |
**For PlanetScale Metal clusters:**
| Metric | Unit | Purpose | Key Insights |
| ---------------------- | ---------- | ------------------------ | ------------------------------------------------------------------------------------------------- |
| **Primary disk usage** | Percentage | Current disk utilization | Monitor disk space consumption on Metal instances where storage is directly tied to instance size |
**Storage metric differences**: Network-attached storage clusters show absolute storage usage (MB/GB), while PlanetScale Metal clusters display disk usage as a percentage since storage scaling requires changing the entire instance size.
### Memory
| Metric | Unit | Purpose | Key Insights |
| :----------------- | :--- | :------------------------------------------------- | :----------------------------------------------------------- |
| **Memory mapped** | MB | Memory-mapped files used by PostgreSQL | Monitor shared memory usage for buffer pools and shared data |
| **RSS** | MB | Resident Set Size - physical memory currently used | Track actual memory consumption by PostgreSQL processes |
| **Active cache** | MB | Recently accessed cached data in memory | Monitor hot data retention and cache effectiveness |
| **Inactive cache** | MB | Less recently accessed cached data | Track memory available for eviction under pressure |
### Transaction rate
| Metric | Unit | Purpose | Key Insights |
| :-------------------------- | :--- | :------------------------------ | :--------------------------------------------------------- |
| **Transactions per second** | TPS | Database transaction throughput | Monitor database workload intensity and performance trends |
### Postgres connections
| Metric | Unit | Purpose | Key Insights |
| :-------------------------------- | :---- | :----------------------------------------- | :------------------------------------------------------------------- |
| **Active** | Count | Currently executing connections | Monitor active database workload and concurrent operations |
| **Disabled** | Count | Disabled connections | Track connection state management and administrative actions |
| **Fastpath function call** | Count | Connections using fastpath protocol | Monitor specialized connection types for performance optimization |
| **Idle** | Count | Idle but connected sessions | Track connection pool efficiency and unused capacity |
| **Idle in transaction** | Count | Idle connections holding transactions | Identify potential long-running transactions that may cause blocking |
| **Idle in transaction (aborted)** | Count | Idle connections with aborted transactions | Monitor failed transaction cleanup and connection state recovery |
### PgBouncer connections
| Metric | Unit | Purpose | Key Insights |
| :-------------------- | :---- | :-------------------------- | :------------------------------------------------------------------------ |
| **Total Connections** | Count | Active database connections | Monitor connection patterns and trends for capacity planning cluster size |
### PgBouncer peer utilization
| Metric | Unit | Purpose | Key Insights |
| :--------- | :------ | :----------------------------- | :------------------------------------------------------------- |
| **CPU** | Percent | PgBouncer process CPU usage | Monitor connection pooler performance and resource consumption |
| **Memory** | Percent | PgBouncer process memory usage | Track memory usage of the connection pooling layer |
### PgBouncer server pools
| Metric | Unit | Purpose | Key Insights |
| :------------------ | :---- | :---------------------------------- | :------------------------------------------------------ |
| **Active** | Count | Active server connections | Monitor backend database connections from the pool |
| **Active Cancel** | Count | Connections being cancelled | Track connection cleanup and cancellation events |
| **Being Cancelled** | Count | Connections in cancellation process | Monitor connection state transitions |
| **Idle** | Count | Idle server connections | Track connection pool efficiency and unused connections |
| **Login** | Count | Connections in login state | Monitor authentication and connection establishment |
| **Testing** | Count | Connections being tested | Track connection health check activities |
| **Tested** | Count | Recently tested connections | Monitor connection validation processes |
| **Used** | Count | Total used connections | Overall connection utilization from the pool |
### PgBouncer client pools
| Metric | Unit | Purpose | Key Insights |
| :---------------- | :---- | :------------------------------------ | :---------------------------------------------------------- |
| **Active** | Count | Active client connections | Monitor incoming client connection load |
| **Active Cancel** | Count | Client connections being cancelled | Track client-side connection cleanup |
| **Waiting** | Count | Client connections waiting for server | Identify connection queue buildup and potential bottlenecks |
The client connection ceiling shown for a dedicated pool is the total across all of its PgBouncers, not the `max_client_conn` value alone, because a dedicated pool runs multiple PgBouncers spread across availability zones (configured with "PgBouncers per availability zone"). See [Configuring PgBouncers](/postgres/connecting/pgbouncer#configuring-pgbouncers).
### WAL archival rate
| Metric | Unit | Purpose | Key Insights |
| :---------- | :---- | :------------------------------ | :-------------------------------------------------------------- |
| **Success** | Count | Successfully archived WAL files | Monitor backup and replication health |
| **Failed** | Count | Failed WAL archival attempts | Track archival failures that could impact recovery capabilities |
### WAL archive age
| Metric | Unit | Purpose | Key Insights |
| :---------- | :--- | :--------------------------- | :--------------------------------------------------------------- |
| **Seconds** | Time | Age of oldest unarchived WAL | Monitor WAL archival latency and ensure timely backup operations |
### WAL storage
| Metric | Unit | Purpose | Key Insights |
| :---------------- | :--- | :---------------------------------- | :---------------------------------------------------------------- |
| **Storage Usage** | MB | Write-ahead log storage consumption | Track WAL disk usage for capacity planning and cleanup monitoring |
### Replication lag
| Metric | Unit | Purpose | Key Insights |
| :------ | :------ | :------------------------------------- | :-------------------------------------------------------------------------------- |
| **Lag** | Seconds | Time delay between primary and replica | Monitor replication health and ensure acceptable lag for read replica consistency |
## Interpreting metrics
### Normal operating ranges
* **CPU**: 0-30% for typical workloads
* **Memory**: 20-80% depending on dataset size
* **IOPS**: Varies by workload type (OLTP vs. analytics)
* **Storage Usage**: Keep below 80% for optimal performance (applies to both absolute storage usage and disk usage percentage)
### Performance indicators
* **Consistent Low CPU/Memory**: Indicates healthy, optimized queries
* **Spiky IOPS**: May indicate batch processing or analytical workloads
* **Low Connection Pool Utilization**: Suggests efficient connection management
* **High Active Cache vs Inactive Cache**: Indicates good data locality and efficient query patterns
* **Low Transaction Rate**: May indicate application bottlenecks or connection pooling issues
* **High Idle in Transaction**: Suggests application issues with transaction management
### Troubleshooting with metrics
* **High CPU**: Check for inefficient queries or missing indexes
* **High Memory**: Monitor for high memory usage from large queries or buffer cache pressure
* **High IOPS**: Analyze query patterns and consider query optimization
* **High Storage/Disk Usage**: Plan for storage scaling or data archiving (for Metal clusters, this requires instance resizing)
* **High RSS vs Memory Mapped**: May indicate memory pressure or suboptimal shared\_buffers configuration
* **Low Transaction Rate**: Investigate connection pooling, application logic, or database locks
* **High Idle in Transaction**: Review application transaction handling and connection management
* **Imbalanced Cache (Active/Inactive)**: Consider adjusting memory settings or query optimization
### WAL monitoring best practices
* **Archive age**: Should typically be under 60 seconds for healthy systems
* **Archival success rate**: Aim for 100% success rate with zero failures
* **WAL storage**: Monitor for steady-state usage with periodic cleanup cycles
* **Replication lag**: High lag may indicate WAL transmission issues
## Best practices
1. **Baseline Establishment**: Understand your normal operating ranges
2. **Alert Thresholds**: Set up monitoring alerts for critical thresholds
3. **Trend Analysis**: Use historical data to predict scaling needs
4. **Performance Correlation**: Cross-reference metrics with application performance
The Metrics dashboard serves as your primary tool for maintaining optimal database performance and ensuring reliable service delivery.
## Need help?
Get help from [the PlanetScale Support team](https://planetscale.com/contact?initial=support), or join our [Discord community](https://pscale.link/community) to see how others are using PlanetScale.
## Dashboard overview
The Metrics dashboard displays real-time and historical data about your database cluster's performance across multiple dimensions. You can filter metrics by:
* **Server Filter**: Monitor all servers or focus on specific instances
* **Branch**: Select which database branch to monitor
* **Time Range**: View data from the past 15 minutes up to custom time ranges
* **Live update**: Toggle on/off the auto-refresh of data every \~30 seconds
## Key metrics categories
### Primary cluster utilization
The primary cluster utilization panel shows your primary database server's resource consumption:
| Metric | Unit | Purpose | Key Insights |
| :--------- | :------ | :------------------------- | :------------------------------------------------------------------------------ |
| **CPU** | Percent | Real-time CPU utilization | Monitor for consistent performance and identify when optimization may be needed |
| **Memory** | Percent | Current memory consumption | Track memory usage patterns and plan for scaling when approaching limits |
### Replica monitoring
Each replica displays individual performance metrics in dedicated panels:
| Metric | Unit | Purpose | Key Insights |
| :--------- | :------ | :------------------------------------- | :------------------------------------------------------------------------- |
| **CPU** | Percent | Individual CPU tracking per replica | Compare replica performance against primary and identify load distribution |
| **Memory** | Percent | Individual memory tracking per replica | Monitor replica resource consumption and ensure balanced utilization |
### Primary IOPS
| Metric | Unit | Purpose | Key Insights |
| :------- | :---------------- | :----------------------------------------------- | :-------------------------------------------------------------------------------- |
| **IOPS** | Operations/second | Tracks database read/write operations per second | Monitor I/O patterns and identify peak usage periods for performance optimization |
### Primary storage usage
Storage metrics vary depending on your cluster's storage type:
**For Network-attached Storage clusters:**
| Metric | Unit | Purpose | Key Insights |
| :---------------- | :---- | :-------------------------- | :------------------------------------------------------------------------------- |
| **Storage Usage** | MB/GB | Current storage consumption | Track storage growth trends for capacity planning and ensure adequate free space |
**For PlanetScale Metal clusters:**
| Metric | Unit | Purpose | Key Insights |
| ---------------------- | ---------- | ------------------------ | ------------------------------------------------------------------------------------------------- |
| **Primary disk usage** | Percentage | Current disk utilization | Monitor disk space consumption on Metal instances where storage is directly tied to instance size |
**Storage metric differences**: Network-attached storage clusters show absolute storage usage (MB/GB), while PlanetScale Metal clusters display disk usage as a percentage since storage scaling requires changing the entire instance size.
### Memory
| Metric | Unit | Purpose | Key Insights |
| :----------------- | :--- | :------------------------------------------------- | :----------------------------------------------------------- |
| **Memory mapped** | MB | Memory-mapped files used by PostgreSQL | Monitor shared memory usage for buffer pools and shared data |
| **RSS** | MB | Resident Set Size - physical memory currently used | Track actual memory consumption by PostgreSQL processes |
| **Active cache** | MB | Recently accessed cached data in memory | Monitor hot data retention and cache effectiveness |
| **Inactive cache** | MB | Less recently accessed cached data | Track memory available for eviction under pressure |
### Transaction rate
| Metric | Unit | Purpose | Key Insights |
| :-------------------------- | :--- | :------------------------------ | :--------------------------------------------------------- |
| **Transactions per second** | TPS | Database transaction throughput | Monitor database workload intensity and performance trends |
### Postgres connections
| Metric | Unit | Purpose | Key Insights |
| :-------------------------------- | :---- | :----------------------------------------- | :------------------------------------------------------------------- |
| **Active** | Count | Currently executing connections | Monitor active database workload and concurrent operations |
| **Disabled** | Count | Disabled connections | Track connection state management and administrative actions |
| **Fastpath function call** | Count | Connections using fastpath protocol | Monitor specialized connection types for performance optimization |
| **Idle** | Count | Idle but connected sessions | Track connection pool efficiency and unused capacity |
| **Idle in transaction** | Count | Idle connections holding transactions | Identify potential long-running transactions that may cause blocking |
| **Idle in transaction (aborted)** | Count | Idle connections with aborted transactions | Monitor failed transaction cleanup and connection state recovery |
### PgBouncer connections
| Metric | Unit | Purpose | Key Insights |
| :-------------------- | :---- | :-------------------------- | :------------------------------------------------------------------------ |
| **Total Connections** | Count | Active database connections | Monitor connection patterns and trends for capacity planning cluster size |
### PgBouncer peer utilization
| Metric | Unit | Purpose | Key Insights |
| :--------- | :------ | :----------------------------- | :------------------------------------------------------------- |
| **CPU** | Percent | PgBouncer process CPU usage | Monitor connection pooler performance and resource consumption |
| **Memory** | Percent | PgBouncer process memory usage | Track memory usage of the connection pooling layer |
### PgBouncer server pools
| Metric | Unit | Purpose | Key Insights |
| :------------------ | :---- | :---------------------------------- | :------------------------------------------------------ |
| **Active** | Count | Active server connections | Monitor backend database connections from the pool |
| **Active Cancel** | Count | Connections being cancelled | Track connection cleanup and cancellation events |
| **Being Cancelled** | Count | Connections in cancellation process | Monitor connection state transitions |
| **Idle** | Count | Idle server connections | Track connection pool efficiency and unused connections |
| **Login** | Count | Connections in login state | Monitor authentication and connection establishment |
| **Testing** | Count | Connections being tested | Track connection health check activities |
| **Tested** | Count | Recently tested connections | Monitor connection validation processes |
| **Used** | Count | Total used connections | Overall connection utilization from the pool |
### PgBouncer client pools
| Metric | Unit | Purpose | Key Insights |
| :---------------- | :---- | :------------------------------------ | :---------------------------------------------------------- |
| **Active** | Count | Active client connections | Monitor incoming client connection load |
| **Active Cancel** | Count | Client connections being cancelled | Track client-side connection cleanup |
| **Waiting** | Count | Client connections waiting for server | Identify connection queue buildup and potential bottlenecks |
The client connection ceiling shown for a dedicated pool is the total across all of its PgBouncers, not the `max_client_conn` value alone, because a dedicated pool runs multiple PgBouncers spread across availability zones (configured with "PgBouncers per availability zone"). See [Configuring PgBouncers](/postgres/connecting/pgbouncer#configuring-pgbouncers).
### WAL archival rate
| Metric | Unit | Purpose | Key Insights |
| :---------- | :---- | :------------------------------ | :-------------------------------------------------------------- |
| **Success** | Count | Successfully archived WAL files | Monitor backup and replication health |
| **Failed** | Count | Failed WAL archival attempts | Track archival failures that could impact recovery capabilities |
### WAL archive age
| Metric | Unit | Purpose | Key Insights |
| :---------- | :--- | :--------------------------- | :--------------------------------------------------------------- |
| **Seconds** | Time | Age of oldest unarchived WAL | Monitor WAL archival latency and ensure timely backup operations |
### WAL storage
| Metric | Unit | Purpose | Key Insights |
| :---------------- | :--- | :---------------------------------- | :---------------------------------------------------------------- |
| **Storage Usage** | MB | Write-ahead log storage consumption | Track WAL disk usage for capacity planning and cleanup monitoring |
### Replication lag
| Metric | Unit | Purpose | Key Insights |
| :------ | :------ | :------------------------------------- | :-------------------------------------------------------------------------------- |
| **Lag** | Seconds | Time delay between primary and replica | Monitor replication health and ensure acceptable lag for read replica consistency |
## Interpreting metrics
### Normal operating ranges
* **CPU**: 0-30% for typical workloads
* **Memory**: 20-80% depending on dataset size
* **IOPS**: Varies by workload type (OLTP vs. analytics)
* **Storage Usage**: Keep below 80% for optimal performance (applies to both absolute storage usage and disk usage percentage)
### Performance indicators
* **Consistent Low CPU/Memory**: Indicates healthy, optimized queries
* **Spiky IOPS**: May indicate batch processing or analytical workloads
* **Low Connection Pool Utilization**: Suggests efficient connection management
* **High Active Cache vs Inactive Cache**: Indicates good data locality and efficient query patterns
* **Low Transaction Rate**: May indicate application bottlenecks or connection pooling issues
* **High Idle in Transaction**: Suggests application issues with transaction management
### Troubleshooting with metrics
* **High CPU**: Check for inefficient queries or missing indexes
* **High Memory**: Monitor for high memory usage from large queries or buffer cache pressure
* **High IOPS**: Analyze query patterns and consider query optimization
* **High Storage/Disk Usage**: Plan for storage scaling or data archiving (for Metal clusters, this requires instance resizing)
* **High RSS vs Memory Mapped**: May indicate memory pressure or suboptimal shared\_buffers configuration
* **Low Transaction Rate**: Investigate connection pooling, application logic, or database locks
* **High Idle in Transaction**: Review application transaction handling and connection management
* **Imbalanced Cache (Active/Inactive)**: Consider adjusting memory settings or query optimization
### WAL monitoring best practices
* **Archive age**: Should typically be under 60 seconds for healthy systems
* **Archival success rate**: Aim for 100% success rate with zero failures
* **WAL storage**: Monitor for steady-state usage with periodic cleanup cycles
* **Replication lag**: High lag may indicate WAL transmission issues
## Best practices
1. **Baseline Establishment**: Understand your normal operating ranges
2. **Alert Thresholds**: Set up monitoring alerts for critical thresholds
3. **Trend Analysis**: Use historical data to predict scaling needs
4. **Performance Correlation**: Cross-reference metrics with application performance
The Metrics dashboard serves as your primary tool for maintaining optimal database performance and ensuring reliable service delivery.
## Need help?
Get help from [the PlanetScale Support team](https://planetscale.com/contact?initial=support), or join our [Discord community](https://pscale.link/community) to see how others are using PlanetScale.